The main category of Forex News.
You can use the search box below to find what you need.
[wd_asp id=1]
The main category of Forex News.
You can use the search box below to find what you need.
[wd_asp id=1]
According to forex market trading, the US dollar has rebounded from its lowest levels in three years amid easing concerns about the independence of the Federal Reserve and growing hopes for a de-escalation of the trade war. Recently, Trump stated that he has no intention of dismissing Federal Reserve Chairman Jerome Powell, allaying concerns about political interference in US monetary policy. Also, he indicated a softer stance toward China, saying he plans to be “very gentle” in any trade negotiations.
Meanwhile, US Treasury Secretary Scott Bessent acknowledged that the tariff standoff with China is unsustainable and stressed the need for both sides to de-escalate soon.
Despite the recent recovery, the US dollar remains down about 9% since the beginning of 2025 and has lost much of its safe-haven appeal in recent weeks amid ongoing trade tensions, recession risks, and political pressure on the US Federal Reserve, which has prompted many investors to move away from US assets.

” dir=”auto” id=”content-1686574122635″>
The USD/JPY trend remains bearish, and market tensions will ultimately support the Japanese yen.
During yesterday’s trading and across stock trading platforms, US stock market indices closed higher, with the S&P 500 index rising by 1.7%, the Nasdaq index by 2.5%, and the Dow Jones Industrial Average by 419 points, as the easing of trade tensions between the United States and China, and Trump’s confirmation that he would not dismiss Federal Reserve Chairman Jerome Powell, boosted sentiment.
However, the three US stock indices retreated from their highs, as investors questioned whether a trade resolution was imminent. US Treasury Secretary Bessent indicated that Trump had not proposed a unilateral reduction in tariffs and that talks with China had not yet begun, dampening early optimism. Clearly, this statement followed the President’s remarks suggesting that tariffs might not remain at the current 145% level.
Meanwhile, Trump’s change of tone toward Powell helped ease concerns about the US central bank’s independence. Tesla shares rose 5.4% after CEO Elon Musk announced he would significantly reduce his involvement with the government to focus on leading his companies. Boeing shares also rose 6.1%, supported by improved aircraft deliveries.
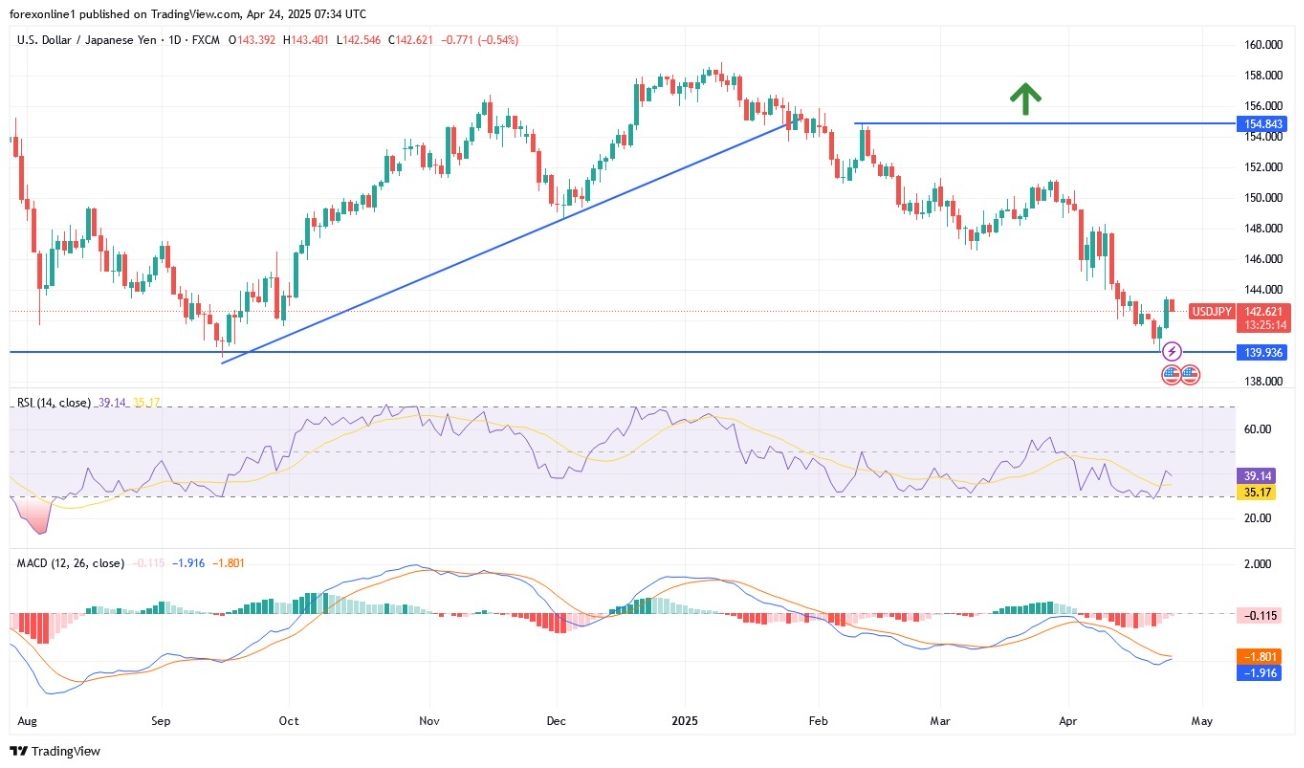
According to the performance on the daily chart, the overall trend for the USD/JPY currency pair remains bearish despite its recent gains. A break of the overall bearish trend on this timeframe will not occur without the bulls successfully pushing towards the resistance levels of 145.00 and 147.80, respectively. Conversely, on the same timeframe, the support levels of 141.70 and 140.00 will remain a real threat to the upward movement and important areas for strong bear control. After its recent gains, the 14-day RSI indicator is moving away from the oversold barrier, while the MACD indicator remains stable near the oversold peak so far.
The USD/JPY pair will be affected by the extent of investors’ risk appetite, as well as the release of the US weekly jobless claims and durable goods orders figures.
Want to trade our USD/JPY forex analysis and predictions? Here’s a list of forex brokers in Japan to check out.
The NZDCAD price forms bearish correctional waves but its main stability within the bullish channel’s levels, besides the continuation of forming extra support at 0.8220 level, these factors support the continuation of the positivity in the upcoming trading.
Gathering the required momentum is important to assist activating the bullish attack, which targets 0.8295 level reaching the near period of the resistance at 0.8365, while the trading below the extra support will confirm delaying the bullish attack and forming several bearish correctional waves, to attempt to test the moving average 55 near 0.8180.
The expected trading range for today is between 0.8220 and 0.8295
Trend forecast: Bullish
Do you need help in trading decisions? Do you want to learn how to start trading?
Join Economies.com VIP Club and benefit from over 15 years of market analysis expertise and get:
Special Offer: Subscribe to the Economies.com VIP channel and get also a free subscription to a trusted trading signals channel provided by Best Trading Signal.
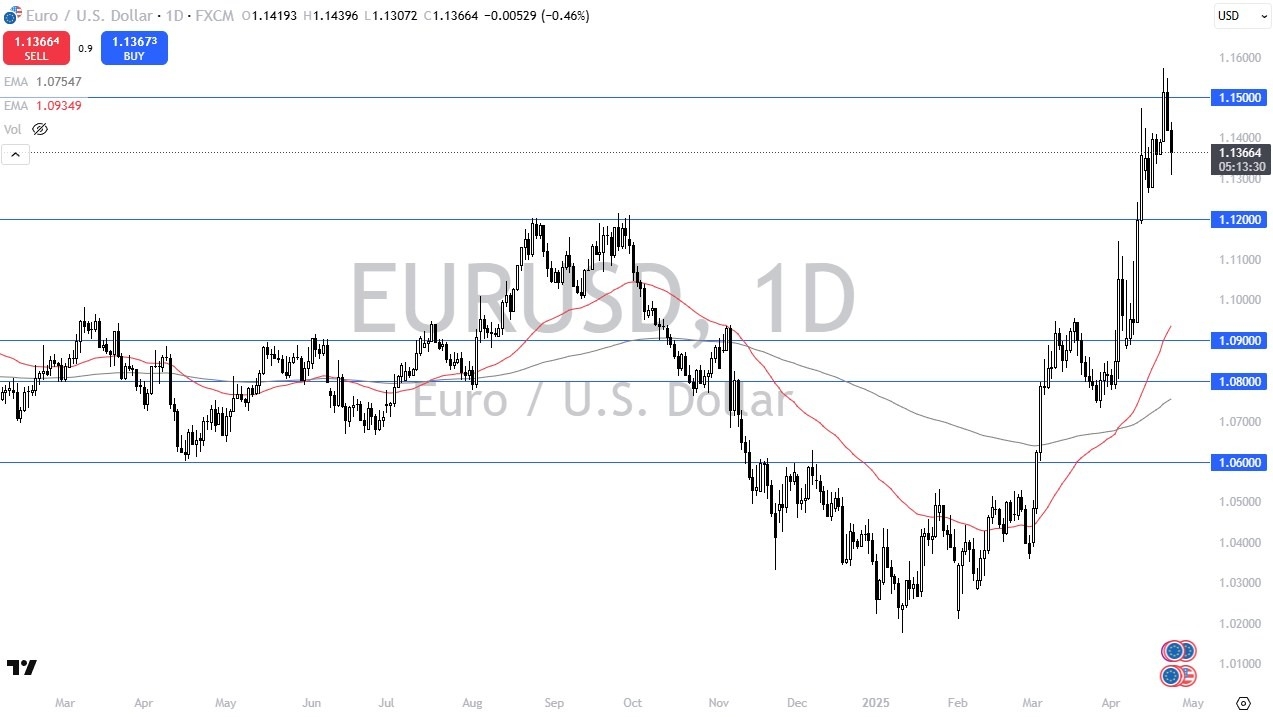
The 1.12 level underneath is a significant amount of support just waiting to happen as it had been major resistance, all things being equal. That’s an area where we will have to make a major inflection point. We will have to make a lot of decisions in that area.
Ultimately, I think we’ve got a situation where we are in the middle of a potential range between the 1.12 and 1.15 level. And therefore, it wouldn’t surprise me to see the market just level out here. After all, the market was parabolic for quite some time, and now it has to have a little bit of digestion. Markets cannot go in one direction forever, no matter how hyped people get.
Furthermore, the interest rate differential is actually starting to spread out quite far, and sooner or later, people are going to want to collect that interest, especially in an environment where the economic and market situation around the world is so jittery. Why risk or test your luck in a market that is all over the place when you can get a whopping return on just parking cash into treasuries.
We are starting to see US treasuries catch a bid and that helps the US dollar as there had been so many pulled out of the country, dollars are starting, I suspect, to flow back into America. Does that mean the trend changes here? No, not necessarily, but it does mean that we got way ahead of ourselves.
Ready to trade our daily Forex analysis? We’ve made a list of the best forex demo accounts worth trading with.
The EURUSD settled bearishly in its recent intraday trading, affected by the technical formation negativity, which was formed previously on the short- term basis, represented by the rising wedge pattern, which causes correctional pressures on the price.
The continuation of the trading below EMA50, besides the emergence of weakness signals from the (RSI), after offloading some of the exaggerated oversold conditions, increase the continuation of the negative scenario.
Do you need help in trading decisions? Do you want to learn how to start trading?
Join Economies.com VIP Club and benefit from over 15 years of market analysis expertise and get:
Special Offer: Subscribe to the Economies.com VIP channel and get also a free subscription to a trusted trading signals channel provided by Best Trading Signal.
Platinum price continued forming weak sideways trading by its repeated stability near the resistance at $975.00, confirming its affection for the continuation of the main indicators until this moment, therefore, we will keep waiting for achieving the required breach to increase the chances of forming new bullish waves, to begin recording gains by its rally to $994.00 and $1005.00.
While the breach failure might assist to activate the bearish correctional track in the current trading, which forces the price to renew the pressure on the moving average 55 at $960.00, to attempt to target extra support near $950.00.
The expected trading range for today is between $962.00 and $974.00
Trend forecast: Bullish
Do you need help in trading decisions? Do you want to learn how to start trading?
Join Economies.com VIP Club and benefit from over 15 years of market analysis expertise and get:
Special Offer: Subscribe to the Economies.com VIP channel and get also a free subscription to a trusted trading signals channel provided by Best Trading Signal.
Platinum price continued forming weak sideways trading by its repeated stability near the resistance at $975.00, confirming its affection for the continuation of the main indicators until this moment, therefore, we will keep waiting for achieving the required breach to increase the chances of forming new bullish waves, to begin recording gains by its rally to $994.00 and $1005.00.
While the breach failure might assist to activate the bearish correctional track in the current trading, which forces the price to renew the pressure on the moving average 55 at $960.00, to attempt to target extra support near $950.00.
The expected trading range for today is between $962.00 and $974.00
Trend forecast: Bullish
Do you need help in trading decisions? Do you want to learn how to start trading?
Join Economies.com VIP Club and benefit from over 15 years of market analysis expertise and get:
Special Offer: Subscribe to the Economies.com VIP channel and get also a free subscription to a trusted trading signals channel provided by Best Trading Signal.
The EURJPY pair provided several slow sideways range trading, due to its neediness to the negative momentum, but its main stability below the bearish channel’s resistance at 163.00 makes us keep the negative suggestion in the near and medium period trading.
Stochastic exit from the overbought level will increase the chances for gaining negative momentum, to reinforce the chances of targeting negative stations, which might begin at 161.30 and 160.30, while moving to the bullish track requires forming a strong bullish attack, to provide several positive closes above 163.25 level, then begin recording several gains by its rally to 164.20.
The expected trading range for today is between 160.35 and 162.65
Trend forecast: Bearish
Do you need help in trading decisions? Do you want to learn how to start trading?
Join Economies.com VIP Club and benefit from over 15 years of market analysis expertise and get:
Special Offer: Subscribe to the Economies.com VIP channel and get also a free subscription to a trusted trading signals channel provided by Best Trading Signal.
Silver (XAG/USD) attracts some sellers after hitting a nearly three-week top near the $33.70 region during the Asian session on Thursday and erodes a part of the previous day’s strong move up. The white metal currently trades around the $33.35-$33.30 area, down 0.75% for the day, though the technical setup supports prospects for the emergence of dip-buyers at lower levels.
The overnight breakout through a short-term trading range held over the past week or so, along with the fact that oscillators on the daily chart have just started gaining positive traction, validates the near-term positive outlook for the XAG/USD. Hence, any further decline is more likely to get bought into the $33.00 round figure mark, which should now act as a key pivotal point.
A convincing break below the said handle might prompt some technical selling and drag the XAG/USD further toward the $32.40 support en route to the $32.10-$32.00 area. Some follow-through selling will suggest that the recent recovery from the $28.00 mark, or the year-to-date low touched earlier this month, has run out of steam and pave the way for deeper losses.
On the flip side, momentum beyond the Asian session high, around the $33.70 region, should allow the XAG/USD to reclaim the $34.00 mark. The subsequent move higher could lift the commodity towards the $34.30 intermediate hurdle en route to the $34.55-$34.60 area or the highest level since October 2024 touched last month and the $35.00 psychological mark.
Silver is a precious metal highly traded among investors. It has been historically used as a store of value and a medium of exchange. Although less popular than Gold, traders may turn to Silver to diversify their investment portfolio, for its intrinsic value or as a potential hedge during high-inflation periods. Investors can buy physical Silver, in coins or in bars, or trade it through vehicles such as Exchange Traded Funds, which track its price on international markets.
Silver prices can move due to a wide range of factors. Geopolitical instability or fears of a deep recession can make Silver price escalate due to its safe-haven status, although to a lesser extent than Gold’s. As a yieldless asset, Silver tends to rise with lower interest rates. Its moves also depend on how the US Dollar (USD) behaves as the asset is priced in dollars (XAG/USD). A strong Dollar tends to keep the price of Silver at bay, whereas a weaker Dollar is likely to propel prices up. Other factors such as investment demand, mining supply – Silver is much more abundant than Gold – and recycling rates can also affect prices.
Silver is widely used in industry, particularly in sectors such as electronics or solar energy, as it has one of the highest electric conductivity of all metals – more than Copper and Gold. A surge in demand can increase prices, while a decline tends to lower them. Dynamics in the US, Chinese and Indian economies can also contribute to price swings: for the US and particularly China, their big industrial sectors use Silver in various processes; in India, consumers’ demand for the precious metal for jewellery also plays a key role in setting prices.
Silver prices tend to follow Gold’s moves. When Gold prices rise, Silver typically follows suit, as their status as safe-haven assets is similar. The Gold/Silver ratio, which shows the number of ounces of Silver needed to equal the value of one ounce of Gold, may help to determine the relative valuation between both metals. Some investors may consider a high ratio as an indicator that Silver is undervalued, or Gold is overvalued. On the contrary, a low ratio might suggest that Gold is undervalued relative to Silver.
PayPal Holdings’ stock price (PYPL) rose in latest intraday trading as the price tries to recoup some recent losses, amid the dominance of the main downward trend in the short term, while trading alongside a highly steep trend line, with ongoing negative pressure due to trading below the 50-day SMA, couple with negative signals from the Stochastic after reaching overbought levels.
Therefore we expect the price to return lower and target the support of $55.85, provided the resistance of $63.90 holds on.
Today’s price forecast: Bearish
Do you need help in trading decisions? Do you want to learn how to start trading?
Join Economies.com VIP Club and benefit from over 15 years of market analysis expertise and get:
Special Offer: Subscribe to the Economies.com VIP channel and get also a free subscription to a trusted trading signals channel provided by Best Trading Signal.
A decline below today’s low will indicate weakness and will put Tuesday’s low of $2.96 at risk of failing to hold as support. If that happens, the next lower support zone becomes a target. That would be from $2.79 to $2.77, consisting of the 78.6% Fibonacci retracement and the 127.2% projection for a declining ABCD pattern, respectively. There are also two trendlines around the price zone that may provide additional indications of supply and demand.
Despite the potential for a bearish continuation, natural gas has been stalled at a potential support zone around the late January higher swing low of $2.99. Although there was a brief dip below that low yesterday to a new trend low of $2.96, the breakdown has not yet been confirmed with a daily close below that low. Therefore, there remains the possibility that sentiment could change towards a short-term bullish posture.
A decisive rally above today’s high could provide an early sign of a potential bounce within the dominant downtrend. It would signal an inside day upside breakout as well as reclaim the 200-Day MA. If there is subsequently bullish confirmation with a daily close above the 200-Day line, further upside may be possible. Today is the eighth day since an inside day breakdown triggered a bearish continuation on April 11 and sellers have remained in control for most of those days. Therefore, a counter-trend bounce is due. Furthermore, keep an eye on the relative strength index (RSI) as it crosses into oversold territory.
There is another technical indication that current lows may hold as support. This week’s lows have also been testing support around the 50-Week MA, currently at $3.00. That is a long-term trend indicator. Since the 50-Week line was reclaimed in September there has only been one pullback to test it as support and that occurred relatively soon after the bull breakout. Not only does the 50-Week line indicate potentially strong support, but a sustained drop below it further adds to the potential significance of such a breakdown.
For a look at all of today’s economic events, check out our economic calendar.