The main category of Forex News.
You can use the search box below to find what you need.
[wd_asp id=1]
The main category of Forex News.
You can use the search box below to find what you need.
[wd_asp id=1]
Silver price (XAG/USD) trades firmly around $33.00 during North American trading hours on Wednesday. The white metal strengthens as fears of an intense trade war between the United States (US) and China have diminished after President Donald Trump signaled the possibility of a deal with Beijing.
“Discussions with Beijing are going well,” Trump said on Tuesday while addressing reporters at the Oval Office, and showed optimism that both nations will “reach a deal”. Trump added that tariffs on China “would not be as high as 145%, but they wouldn’t be zero”.
Theoretically, easing global economic tensions reduces the appeal of safe-haven assets, like Silver. However, the metal is rising due to its industrial demand. Silver has applications in various industries, such as Electric Vehicles (EV), electronics, power and cables, mining etc.
Financial market participants expect that easing tensions between the world’s two largest powerhouses will favor both economies.
Meanwhile, the intraday corrective move in the US Dollar (USD) has also supported the Silver price. The US Dollar Index (DXY), which tracks the Greenback’s value against six major currencies, surrenders initial gains and falls back to near 99.00.
The USD Index gives up intraday gains even though Donald Trump has pushed back fears of sacking Federal Reserve (Fed) Chair Jerome Powell. Still, he is frustrated with Powell for holding interest rates too restrictive.
Silver price trades back-and-forth in a range between $32.08 and $33.12 since Wednesday. The white metal turns sideways after a strong upside move since April 7. The 20-day Exponential Moving Average (EMA) near $32.40 continues to provide support to the Silver price.
The 14-day Relative Strength Index (RSI) oscillates in the 40.00-60.00 range, indicating a volatility contraction.
Looking up, the March 28 high of $34.60 will act as key resistance for the metal. On the downside, the April 11 low of $30.90 will be the key support zone.
Silver is a precious metal highly traded among investors. It has been historically used as a store of value and a medium of exchange. Although less popular than Gold, traders may turn to Silver to diversify their investment portfolio, for its intrinsic value or as a potential hedge during high-inflation periods. Investors can buy physical Silver, in coins or in bars, or trade it through vehicles such as Exchange Traded Funds, which track its price on international markets.
Silver prices can move due to a wide range of factors. Geopolitical instability or fears of a deep recession can make Silver price escalate due to its safe-haven status, although to a lesser extent than Gold’s. As a yieldless asset, Silver tends to rise with lower interest rates. Its moves also depend on how the US Dollar (USD) behaves as the asset is priced in dollars (XAG/USD). A strong Dollar tends to keep the price of Silver at bay, whereas a weaker Dollar is likely to propel prices up. Other factors such as investment demand, mining supply – Silver is much more abundant than Gold – and recycling rates can also affect prices.
Silver is widely used in industry, particularly in sectors such as electronics or solar energy, as it has one of the highest electric conductivity of all metals – more than Copper and Gold. A surge in demand can increase prices, while a decline tends to lower them. Dynamics in the US, Chinese and Indian economies can also contribute to price swings: for the US and particularly China, their big industrial sectors use Silver in various processes; in India, consumers’ demand for the precious metal for jewellery also plays a key role in setting prices.
Silver prices tend to follow Gold’s moves. When Gold prices rise, Silver typically follows suit, as their status as safe-haven assets is similar. The Gold/Silver ratio, which shows the number of ounces of Silver needed to equal the value of one ounce of Gold, may help to determine the relative valuation between both metals. Some investors may consider a high ratio as an indicator that Silver is undervalued, or Gold is overvalued. On the contrary, a low ratio might suggest that Gold is undervalued relative to Silver.
April 23, 2025 – Written by Frank Davies
STORY LINK Pound to Dollar FX Forecast: Sterling “Near-term Consolidation Around 1.33”
The US dollar secured net gains on Wednesday with support from a second successive surge in equities during the day.
The gains in equities and dollar were driven by another U-turn from President Trump as he stated that he was not looking to dismiss Fed Chair Powell. There was also an upbeat Administration assessment of trade prospects.
The latest US business confidence data also suggested more resilience than expected which provided an element of relief surrounding the US outlook.
The Pound to Dollar (GBP/USD) exchange rate posted sharp losses to below 1.3250 before a recovery to near 1.3300.
According to Scotiabank; “We look for near-term consolidation around 1.33 and note the fact that GBPUSD’s most recent highs were not confirmed by the RSI, offering negative divergence in momentum. We look to near-term support between 1.3220 and 1.3250 and resistance between 1.3400 and 1.3420.”
MUFG is not expecting an extended recovery; “The scale of the US dollar move does point to some scope if these reports of de-escalation intensify that we could see this US dollar rebound extend further. Still, investors are likely to remain cautious and in many ways, damage is already done that likely means any US dollar recovery will be brief and relatively modest.”
According to Scotiabank; “Relief for the USD may be temporary as trade uncertainty will continue to shade US economic prospects.”

The US PMI manufacturing index improved to a 2-month high of 50.7 for April from 50.2 previously and above consensus forecasts of 49.0.
The services sector index did retreat to a 2-month low of 51.4 for the month from 54.4 and compared with expectations of 52.8.
The PMI composite index did decline to a 16-month low for the month as business confidence dipped again to the lowest level since July 2022.
Prices charged for goods and services rose at the sharpest rate for 13 months.
Chris Williamson, Chief Business Economist at S&P Global Market Intelligence commented; “The early flash PMI data for April point to a marked slowing of business activity growth at the start of the second quarter, accompanied by a slump in optimism about the outlook. At the same time, price pressures intensified, creating a headache for a central bank which is coming under increasing pressure to shore up a weakening economy just as inflation looks set to rise.
Markets are pricing in a 65% chance of a June rate cut after no change in May.
Earlier, the UK PMI manufacturing index retreated further to a 32-month low of 44.0 for April from 44.9 previously and in line with consensus forecasts while the services-sector index retreated sharply to a 27-month low 48.9 from 52.5 and well below expectations of 51.5.

The composite output index dipped to a 29-month low in contraction territory.
Business confidence data dipped to the lowest level since October 2022 while employment declined further.
Costs increased at the fastest rate since February 2023 while output charges increased at the fastest rate for close to two years which will make Bank of England decision making notably difficult.
MUFG expressed reservations over the outlook; “The market may be reluctant to take kind of a strong view at this point in terms of how that’s likely to impact the UK economy and pound. But certainly, if you look at the (PMI) figures today it does show that business confidence did drop more sharply than expected in April, so that certainly increases the risk of the UK economy slowing down more in the second quarter.”
International Money Transfer? Ask our resident FX expert a money transfer question or try John’s new, free, no-obligation personal service! ,where he helps every step of the way,
ensuring you get the best exchange rates on your currency requirements.
TAGS: Pound Dollar Forecasts
Halliburton reported a first-quarter profit drop to $204 million (24 cents/share) from $606 million last year, with shares falling 6% to $20.62 after warning of a second-quarter earnings hit.
CEO Jeff Miller cited President Trump’s tariffs, which raise costs for steel-based equipment like drilling rigs, and weak U.S. crude prices below $64/barrel, deterring profitable drilling.
North American revenue declined 12% to $2.2 billion, as producers scaled back production due to prices below the $65 threshold. International revenue dipped 2%, led by reduced activity in debt-laden Mexico.
Halliburton forecasts a 2-3 cent/share impact from trade tensions, with second-quarter earnings at 63 cents/share. Despite a $356 million charge, including $107 million in severance costs, revenue of $5.42 billion beat estimates.
The company expects flat to slightly lower international revenue and a 1-3% rise in completion division revenue, but drilling margins may drop significantly.
Miller noted potential equipment “white space” as clients cut 2025 activity, possibly retiring or exporting fleets. The oilfield services sector braces for tariff-driven supply chain disruptions, with Halliburton’s stock down 24% year-to-date, outpacing rival SLB’s 11% decline.
For what it’s worth, German Flash Manufacturing came in a little hotter than anticipated, as its Services number came in a little lower than anticipated. It was a slightly mixed to negative picture coming out of the European Union. Later in the day, we’ll get manufacturing and services PMI coming out of the US and that could change things. But as things stand right now, this looks like the market is just simply trying to find some type of equilibrium right around the 1.14 level.
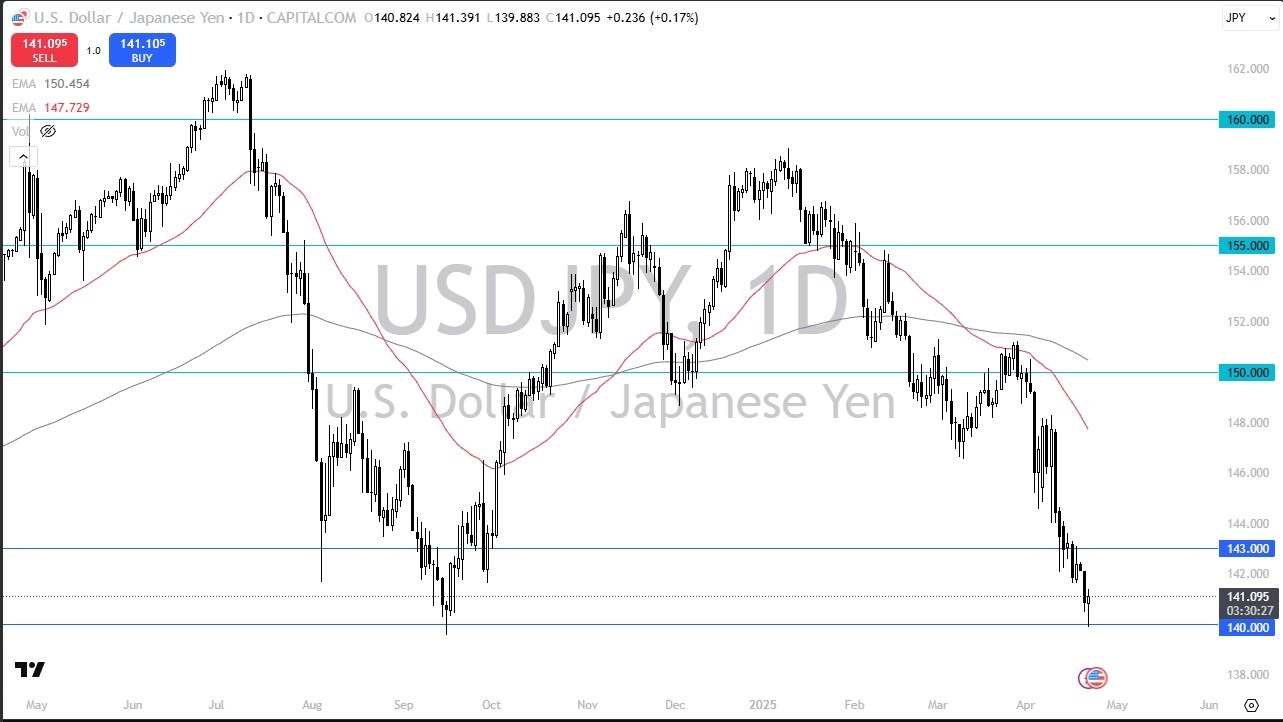
The US dollar spiked against the Japanese yen to break above the 143 yen level but then gave back quite a bit of those gains. Again, I think the PMI numbers in the United States could be a big mover here over the next 24 hours, but if we can break back above this 143 yen level, I’d be willing to start thinking about buying this pair because I think it would show a real chance at recovery. If we break down below the 140 yen level, then things could get rather ugly. We could drop, as low as maybe even 130 yen, possibly even 128 yen. So, the 140 yen level is very important.
The Australian dollar initially fell during the session, but turned around to rally and we find ourselves right at the 200 day EMA again. This obviously is a technical indicator that a lot of people pay attention to, and it has offered a bit of technical resistance over the last couple of days. The question at this point is, can we pick up enough momentum to continue going higher? That would be signified by a move above the 0.65 level.
And in the interim, I think we are just simply killing time trying to figure out where the next move is because quite frankly, we got here way too quickly. We will have to sort out, is this a short covering rally, as it looks like on longer term charts, or is there something positive going on here? It’s a little bit early to jump on the bandwagon of the Australian dollar, but we are definitely at a major inflection point.
For a look at all of today’s economic events, check out our economic calendar.
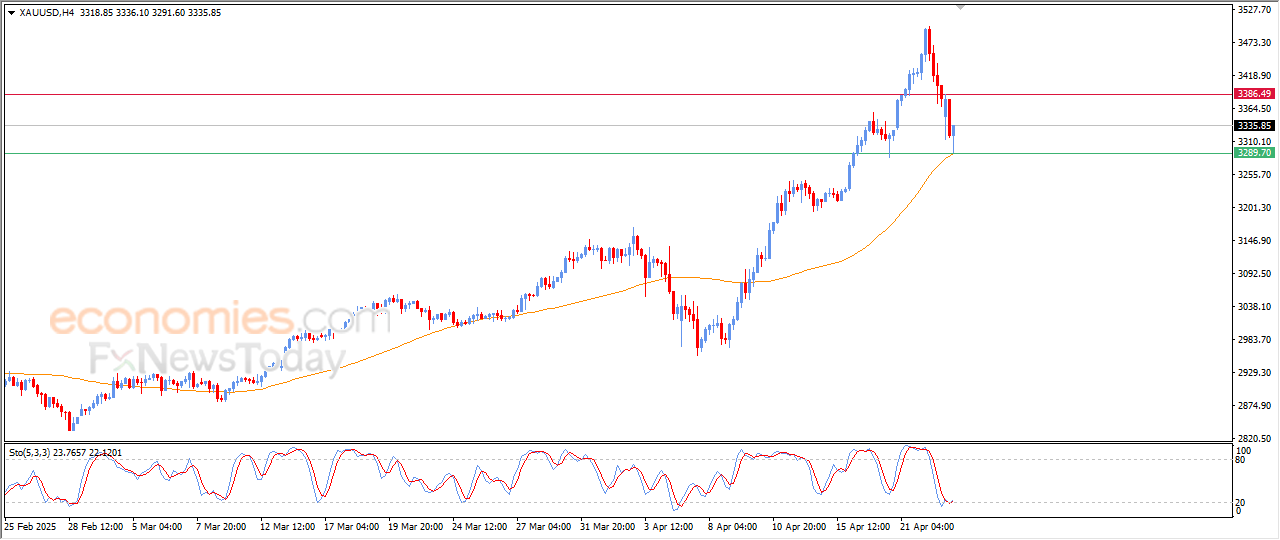
Spot Gold retreats on Wednesday, extending its slump to the $3,260 area during American trading hours. The bright metal fell as the market sentiment improved following United States (US) headlines. US President Donald Trump clarified on Tuesday that he is not willing to fire Federal Reserve (Fed) Chairman Jerome Powell, but that he is frustrated with the decision to maintain interest rates at high levels. Even further, Trump mentioned progress in trade negotiations with China, adding to speculative interests’ relief.
Stock markets reflect the better mood, as Asian and European indexes closed in the green, while Wall Street is firmly up for a second consecutive day, having trimmed all of its Monday losses.
Further optimism came from market talks suggesting the US would lower tariffs on China. Treasury Secretary Scott Bessent on Wednesday said that “there is an opportunity for a big deal” between the two countries, but declined to comment on the tariffs’ levels. He finally added that tariffs will likely have to come down for trade negotiations.
On the data front, S&P Global released the preliminary estimates of the April Purchasing Managers’ Indexes (PMIs), which showed that the manufacturing index improved to 50.7 in April after posting 50.2in March. The Services PMI eased from its previous reading of 54.4 to 51.4, while both indicating expansion in business activity.
The XAU/USD pair bounced from the mentioned low and trades around the $3,290 level. Technical readings in the daily chart suggest Gold may fall further, given that indicators head south almost vertically. Still, as indicators hold within positive levels, the slide could be considered corrective. Even further, the pair develops above all its moving averages, with a firmly bullish 20 Simple Moving Average (SMA) currently at $3,168.
The near-term picture shows sellers have paused. In the 4-hour chart, technical indicators are losing their bearish momentum near oversold readings, but are still far from suggesting an upcoming recovery. In the meantime, the 20 SMA turned flat, providing resistance in the $3,380 region. Finally, the 100 and 200 SMAs maintain their bullish slopes far below the current level, limiting the case for a steeper decline.
Support levels: 3,283.40 3,260.00 3,247.10
Resistance levels: 3,313.65 3,329.20 3,342.35
April 23, 2025 – Written by Frank Davies
STORY LINK GBP/EUR Forecast: 3-Month Pound Sterling Forecast of 1.15
Global risk appetite has recovered strongly on Wednesday following another change in direction by President Trump.
Stronger risk conditions boosted the Pound, but the latest data triggered fresh doubts over the UK economic outlook which hampered the UK currency.
After an initial boost the Pound to Euro (GBP/EUR) exchange rate failed to hold the boost to 1.1715 with a retreat to 1.1665.
European business confidence data was also important and there was some evidence that the UK economy has been hit harder by trade fears than the Euro-Zone which hampered the Pound.
Conflicting pressures will continue with ING expecting risk conditions to dominate. It sees GBP/EUR gains to at least 1.1765 if confidence continues to improve.
Danske Bank, however, has a 3-month GBP/EUR forecast of 1.15.
The UK PMI manufacturing index retreated further to a 32-month low of 44.0 for April from 44.9 previously and in line with consensus forecasts while the services-sector index retreated sharply to a 27-month low 48.9 from 52.5 and well below expectations of 51.5.
The composite output index dipped to a 29-month low in contraction territory.
Total new work from abroad decreased sharply at the fastest pace for nearly five years.
Business confidence data dipped to the lowest level since October 2022 while employment declined further.
Costs increased at the fastest rate since February 2023 while output charges increased at the fastest rate for close to two years.
Chris Williamson, Chief Business Economist at S&P Global Market Intelligence commented; “The biggest concern lies in a slump in exports amid weakened global demand and rising global trade worries, but higher staffing costs have also piled pressure on companies.”
He added; “The collapse in confidence and drop in output during April raise red flags as to the near-term economic outlook and add pressure on the Bank of England to reduce interest rates again at its May meeting. There will be some uncertainty, however, as to whether the recent upturn in price pressures could become entrenched or whether it merely represents a short-term tax-related spike which should be ‘looked through’.”
Capital Economics UK economist Alex Kerr expects a middle path for the bank; “Overall, although Trump’s tariffs may prove to be disinflationary for the UK eventually, the continued stickiness of near-term price pressures suggests that the Bank of England will continue to cut interest rates gradually from 4.50% now to 3.50% in the first half of next year.”
The Euro-Zone manufacturing sector was resilient for April at 48.7 from 48.6 previously while the services sector edged into contraction territory at 49.7 from 51.0 previously.
Dr. Cyrus de la Rubia, Chief Economist at Hamburg Commercial Bank commented; “the higher fiscal spending on infrastructure in Germany and defence spending across Europe should eventually benefit not just manufacturing but also the service sector, though with a bit of a lag.”
The March UK government borrowing requirement increased to £16.4 billion in March 2025 from £13.6bn the previous year and above expectations of £15.4bn.
Provisionally, the fiscal 2024/25 deficit increased to £151.9bn from £131.2bn the previous year and compared with the OBR forecast of £137.3bn.
Revenue increased, but there was a larger increase in spending. Debt interest payments increased to £4.3bn in March, the highest March figure since monthly records began in 1998.
According to Capital Economics deputy chief UK economist Ruth Gregory; “[Chancellor] Reeves may not be too far away from having to raise money again in the Autumn Budget, by cutting spending and/or raising taxes, to meet her fiscal rules.”
International Money Transfer? Ask our resident FX expert a money transfer question or try John’s new, free, no-obligation personal service! ,where he helps every step of the way,
ensuring you get the best exchange rates on your currency requirements.
The CADCHF lost its positive momentum by stochastic exit from the overbought, to end the bullish rally by hitting 1.8520 level, to form a temporary correctional rebound, to settle near 1.8410.
By the above image, we notice the price stability within the main bullish channel’s levels, and 23.6%Fibonacci correction level forms a strong support at 1.8220, which makes us wait for gathering the positive momentum, to activate the bullish rally again by reaching 1.8460, repeating the pressure on the obstacle at 1.8520, in order to find an exit to achieve extra gains in the upcoming period.
The expected trading range for today is between 1.8355 and 1.8460
Trend forecast: Bullish
Do you need help in trading decisions? Do you want to learn how to start trading?
Join Economies.com VIP Club and benefit from over 15 years of market analysis expertise and get:
Special Offer: Subscribe to the Economies.com VIP channel and get also a free subscription to a trusted trading signals channel provided by Best Trading Signal.
GBP/USD dropped below 1.3250 in the Asian session on Wednesday after posting daily losses on Tuesday. Although the pair staged a rebound afterward, disappointing Purchasing Managers Index (PMI) data from the UK limited the upside.
The table below shows the percentage change of British Pound (GBP) against listed major currencies this week. British Pound was the weakest against the New Zealand Dollar.
| USD | EUR | GBP | JPY | CAD | AUD | NZD | CHF | |
|---|---|---|---|---|---|---|---|---|
| USD | -0.11% | -0.11% | -0.16% | -0.26% | -0.46% | -1.01% | 0.85% | |
| EUR | 0.11% | -0.14% | -0.06% | -0.19% | -0.52% | -0.92% | 0.95% | |
| GBP | 0.11% | 0.14% | 0.25% | -0.03% | -0.40% | -0.78% | 1.10% | |
| JPY | 0.16% | 0.06% | -0.25% | -0.11% | -0.41% | -0.71% | 1.04% | |
| CAD | 0.26% | 0.19% | 0.03% | 0.11% | -0.30% | -0.73% | 1.14% | |
| AUD | 0.46% | 0.52% | 0.40% | 0.41% | 0.30% | -0.38% | 1.50% | |
| NZD | 1.01% | 0.92% | 0.78% | 0.71% | 0.73% | 0.38% | 1.92% | |
| CHF | -0.85% | -0.95% | -1.10% | -1.04% | -1.14% | -1.50% | -1.92% |
The heat map shows percentage changes of major currencies against each other. The base currency is picked from the left column, while the quote currency is picked from the top row. For example, if you pick the British Pound from the left column and move along the horizontal line to the US Dollar, the percentage change displayed in the box will represent GBP (base)/USD (quote).
S&P Global/CIPS Composite PMI in the UK slumped to 48.2 in April’s flash estimate from 51.5 in March, highlighting a contraction in the private sector’s business activity.
Commenting on the survey’s findings, “while recent months have been characterised by UK businesses treading water, broadly stagnating since last autumn’s Budget, businesses are reporting more of a struggle to keep their heads above water in April,” Chris Williamson, Chief Business Economist at S&P Global Market Intelligence, said.
“The collapse in confidence and drop in output during April raise red flags as to the near-term economic outlook and add pressure on the Bank of England to reduce interest rates again at its May meeting,” Williamson added.
S&P Global will publish preliminary April Manufacturing and Services PMI data for the US later in the day.
In case either of the headline PMIs come in well below 50, the USD could have a difficult time finding demand. In this scenario, GBP/USD could stretch higher with the immediate reaction. On the flip side, a positive surprise in the PMI report could boost the USD and cause the pair to turn south. Investors will also scrutinize the commentary in the report to see whether business activity is being impacted negatively by tariffs. If the publication points to a significant deterioration in the private sector’s business outlook, the USD could continue to weaken against its peers.
GBP/USD broke below the ascending regression channel and closed the last four 4-hour candles below the 20-period Simple Moving Average (SMA), reflecting a lack of buyer interest. On the downside, immediate support is located at 1.3260 (static level, 50-period SMA) before 1.3200 and 1.3090 (100-period SMA).
Looking north, resistances could be spotted at 1.3340 (20-period SMA, static level), 1.3400-1.3410 (round level, static level) and 1.3460 (static level).
The Pound Sterling (GBP) is the oldest currency in the world (886 AD) and the official currency of the United Kingdom. It is the fourth most traded unit for foreign exchange (FX) in the world, accounting for 12% of all transactions, averaging $630 billion a day, according to 2022 data.
Its key trading pairs are GBP/USD, also known as ‘Cable’, which accounts for 11% of FX, GBP/JPY, or the ‘Dragon’ as it is known by traders (3%), and EUR/GBP (2%). The Pound Sterling is issued by the Bank of England (BoE).
The single most important factor influencing the value of the Pound Sterling is monetary policy decided by the Bank of England. The BoE bases its decisions on whether it has achieved its primary goal of “price stability” – a steady inflation rate of around 2%. Its primary tool for achieving this is the adjustment of interest rates.
When inflation is too high, the BoE will try to rein it in by raising interest rates, making it more expensive for people and businesses to access credit. This is generally positive for GBP, as higher interest rates make the UK a more attractive place for global investors to park their money.
When inflation falls too low it is a sign economic growth is slowing. In this scenario, the BoE will consider lowering interest rates to cheapen credit so businesses will borrow more to invest in growth-generating projects.
Data releases gauge the health of the economy and can impact the value of the Pound Sterling. Indicators such as GDP, Manufacturing and Services PMIs, and employment can all influence the direction of the GBP.
A strong economy is good for Sterling. Not only does it attract more foreign investment but it may encourage the BoE to put up interest rates, which will directly strengthen GBP. Otherwise, if economic data is weak, the Pound Sterling is likely to fall.
Another significant data release for the Pound Sterling is the Trade Balance. This indicator measures the difference between what a country earns from its exports and what it spends on imports over a given period.
If a country produces highly sought-after exports, its currency will benefit purely from the extra demand created from foreign buyers seeking to purchase these goods. Therefore, a positive net Trade Balance strengthens a currency and vice versa for a negative balance.
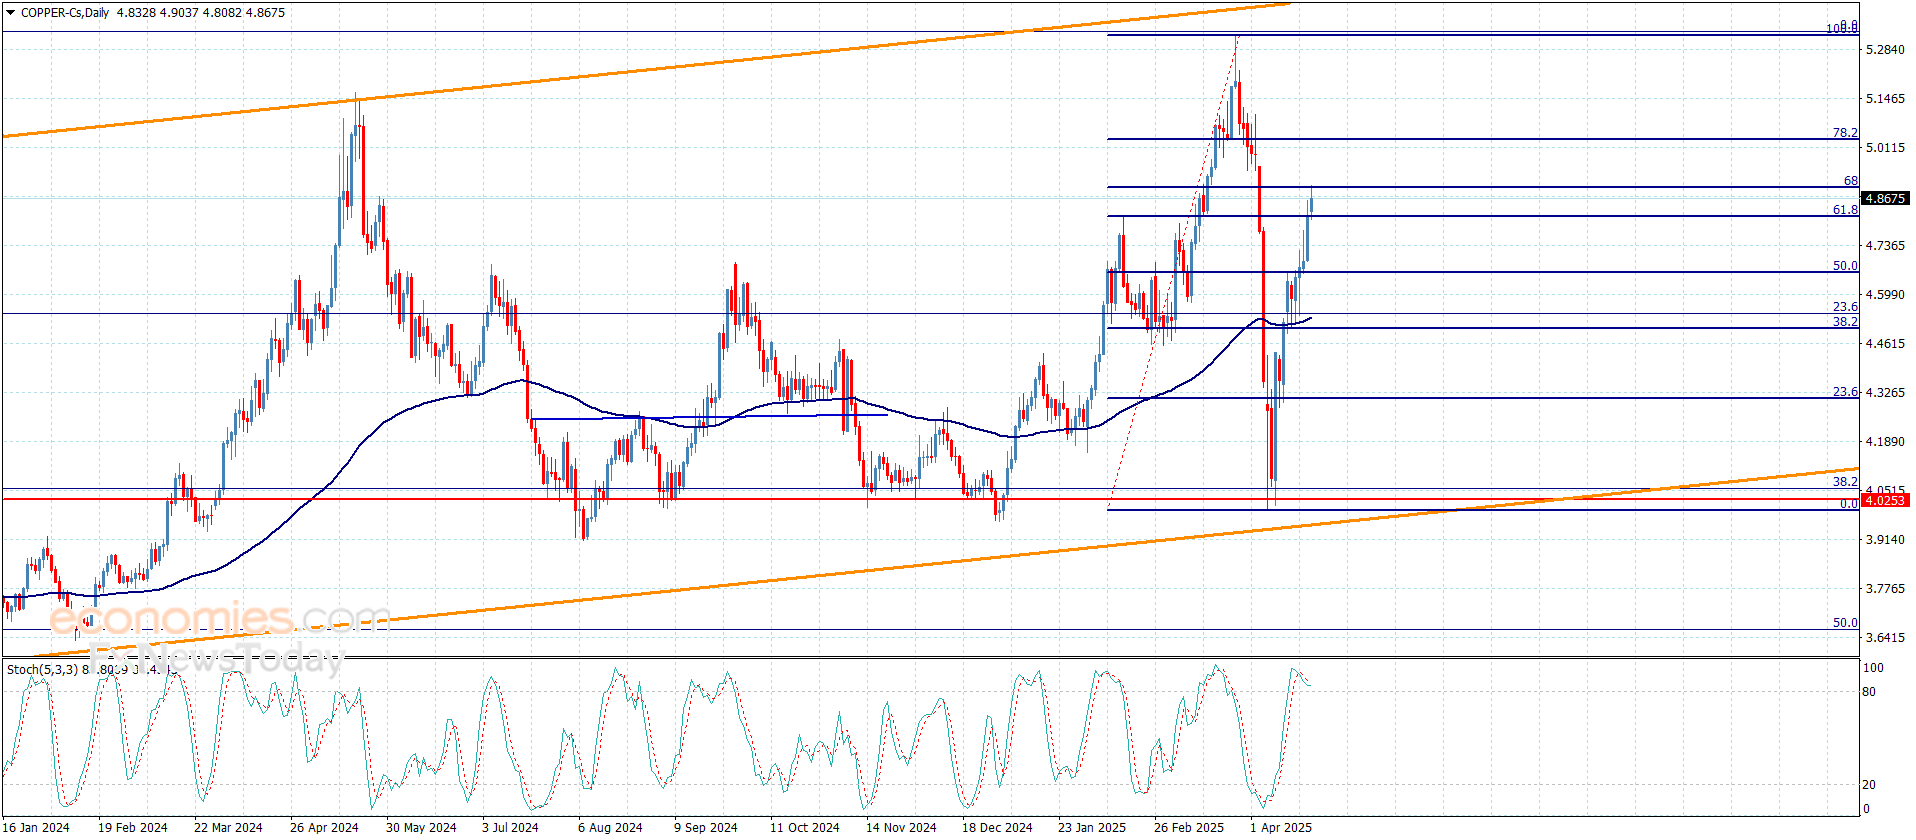
Copper price’s trading extended towards 68% Fibonacci correction level, recording the second target at $4.9000, to form an extra barrier against the bullish rally.
We expect price affection by some of the negative pressures, especially, stochastic attempts to exit the overbought level, which might increase the chances for activating the bearish correctional track and suffering some losses by reaching $4.7700 and $4.6800, while the price success to breach the obstacle will reinforce the chances for recording new gains that might extend towards $4.9600 reaching the next barrier near $5.0300.
The expected trading range for today is between $4.7700 and $4.900
Trend forecast: Fluctuated within the bullish track
Do you need help in trading decisions? Do you want to learn how to start trading?
Join Economies.com VIP Club and benefit from over 15 years of market analysis expertise and get:
Special Offer: Subscribe to the Economies.com VIP channel and get also a free subscription to a trusted trading signals channel provided by Best Trading Signal.
The technical analysis for this USD/JPY pair is obviously negative, but the ¥140 level is an area that a lot of people will be paying close attention to because it had been such a massive support previously. Furthermore, it looks as if the market is trying to form a hammer for the day, and if it does in fact do that, one would have to assume that there might be buyers willing to get involved. That being said, I prefer to have a little bit more in the way of confirmation with a move like this, and in this environment, I will be waiting for a move above the ¥143 level.

If we were to break above the ¥143 level, then I think you have a scenario where we may go looking to reach the ¥148 level again, which is where the 50 Day EMA currently resides. This of course is a technical indicator that a lot of people will be paying close attention for potential resistance. That being said, it is worth noting that market participants continue to look at this through the prism of a market that will be moving on the latest tariff headlines, and of course risk appetite in general. Remember, the Japanese yen is considered to be the ultimate “safety currency” for a lot of traders, and with that being said, this pair will continue to be highly sensitive to the latest headlines involving the tariff war.
Want to trade our USD/JPY forex analysis and predictions? Here’s a list of forex brokers in Japan to check out.