The main category of Forex News.
You can use the search box below to find what you need.
[wd_asp id=1]
The main category of Forex News.
You can use the search box below to find what you need.
[wd_asp id=1]
May arabica coffee (KCK25) today is down -4.80 (-1.24%), and May ICE robusta coffee (RMK25) is down -91 (-1.68%).
Coffee prices today extended Thursday’s sharp losses on forecasts for rain in Brazil. Somar Meteorologia said Thursday that dry and hot weather in Brazil for the rest of this week will give way to several days of showers next week, easing dry conditions.
Commodity Bulletin: From crude oil to coffee, this FREE newsletter is for industry pros and rookies alike
Robusta coffee is also under pressure after Vietnam’s General Statistics Office reported Thursday that Vietnam’s Feb coffee exports rose +6.6% y/y to 169,000 MT. Also, the outlook for rain in Vietnam is weighing on coffee prices, with forecasts showing a chance of rain every day for the next week in Vietnam’s Central Highlands, the country’s largest coffee-growing region.
A rebound in coffee inventories is bearish for coffee prices after ICE-monitored robusta coffee inventories rose to a 1-month high today of 4,356 lots. Meanwhile, ICE-monitored arabica coffee inventories slid to a 9-1/4 month low on February 18 at 758,514 bags, although they have since recovered to a 2-week high of 809,128 bags as of last Thursday.
Last Monday, Somar Meteorologia reported that Brazil’s biggest arabica coffee growing area of Minas Gerais received 11.4 mm the week ended February 22, or 24% of the historical average. This past Monday’s rain report was delayed by the Brazilian Carnival holiday. Brazil is the world’s biggest arabica coffee growing country.
In a bullish factor, an increased percentage of Brazil’s coffee harvest has already been sold compared with previous years, meaning less supply is still available. Safras & Mercado reported last Monday that producers sold 88% of Brazil’s 2024/25 coffee harvest as of February 11, faster than last year’s comparable year-earlier figure of 79% and the 5-year average of 82%. Meanwhile, sales of the 2025/26 crop have been slow at 13% of the crop, well behind the 4-year average of 22%, which suggests a lack of new supply and an unwillingness of producers to sell.
Continued supply fears have supported coffee prices. Cecafe reported on February 12 that Brazil’s January green coffee exports fell -1.6% y/y to 3.98 million bags. Also, on January 28, Conab, Brazil’s government crop forecasting agency, forecasted that Brazil’s 2025/26 coffee crop would fall -4.4% y/y to a 3-year low of 51.81 million bags. Conab also cut its 2024 Brazil coffee crop estimate by -1.1% to 54.2 million bags from a September estimate of 54.8 million bags.
The impact of dry El Nino weather last year may lead to longer-term coffee crop damage in South and Central America. Rainfall in Brazil has consistently been below average since last April, damaging coffee trees during the all-important flowering stage and reducing the prospects for Brazil’s 2025/26 arabica coffee crop. Brazil has been facing the driest weather since 1981, according to the natural disaster monitoring center Cemaden. Also, Colombia, the world’s second-largest arabica producer, is slowly recovering from the El Nino-spurred drought last year.
Robusta coffee prices are underpinned by reduced robusta production. Due to drought, Vietnam’s coffee production in the 2023/24 crop year dropped by -20% to 1.472 MMT, the smallest crop in four years. The USDA FAS on May 31 projected that Vietnam’s robusta coffee production in the new marketing year of 2024/25 will dip slightly to 27.9 million bags from 28 million bags in the 2023/24 season. In addition, Vietnam’s General Statistics Office reported on January 10 that 2024 Vietnam coffee exports fell -17.1% y/y to 1.35 MMT. Conversely, the Vietnam Coffee and Cocoa Association on December 3 raised its 2024/25 Vietnam coffee production estimate to 28 million bags from an October estimate of 27 million bags.
News of larger global coffee exports is bearish for prices. Conab reported on February 4 that Brazil’s 2024 coffee exports rose +28.8% y/y to a record 50.5 million bags. However, ICO reported on February 6 that Dec global coffee exports fell -12.4% y/y to 10.73 million bags, and Oct-Dec global coffee exports fell -0.8% y/y to 32.25 million bags.
The USDA’s biannual report on December 18 was mixed for coffee prices. The USDA’s Foreign Agriculture Service (FAS) projected that world coffee production in 2024/25 will increase +4.0% y/y to 174.855 million bags, with a +1.5% increase in arabica production to 97.845 million bags and a +7.5% increase in robusta production to 77.01 million bags. The USDA’s FAS forecasts that 2024/25 ending stocks will fall by -6.6% to a 25-year low of 20.867 million bags from 22.347 million bags in 2023/24. Separately, the USDA’s FAS on November 22 projected Brazil’s 2024/25 coffee production at 66.4 MMT, below its previous forecast of 69.9 MMT. The USDA’s FAS projects Brazil’s coffee inventories at 1.2 million bags at the end of the 2024/25 season in June, down -26% y/y.
For the 2025/26 marketing year, Volcafe on December 17 cut its 2025/26 Brazil arabica coffee production estimate to 34.4 million bags, down by about 11 million bags from a September estimate after a crop tour revealed the severity of an extended drought in Brazil. Volcafe projects a global 2025/26 arabica coffee deficit of -8.5 million bags, wider than the -5.5 million bag deficit for 2024/25 and the fifth consecutive year of deficits.
On the date of publication,
did not have (either directly or indirectly) positions in any of the securities mentioned in this article. All information and data in this article is solely for informational purposes. For more information please view the Barchart Disclosure Policy
here.
More news from Barchart
The views and opinions expressed herein are the views and opinions of the author and do not necessarily reflect those of Nasdaq, Inc.
Brent oil price shows some slight bearish bias now to test 71.00$ barrier, while stochastic continues to provide the positive signals on the intraday time frames, waiting to motivate the price to resume the expected rise for today, which depends on the price stability above 70.75$ and 70.30$ levels, reminding you that our targets begin at 72.00$ and extend to 73.00$ after surpassing the previous level.
To review the full report, and to get our more detailed analysis and 100% accurate signals provided by Best Trading Signal, subscribe to Economies.com VIP Club through the link below!
Brent oil price faced strong negative pressures in the previous sessions to break 70.75$ and settle below it, noticing that the price attempts to rise again, approaching the mentioned level, while stochastic loses its positive momentum clearly to enter the overbought areas.
To review the full report, and to get our more detailed analysis and 100% accurate signals provided by Best Trading Signal, subscribe to Economies.com VIP Club through the link below!
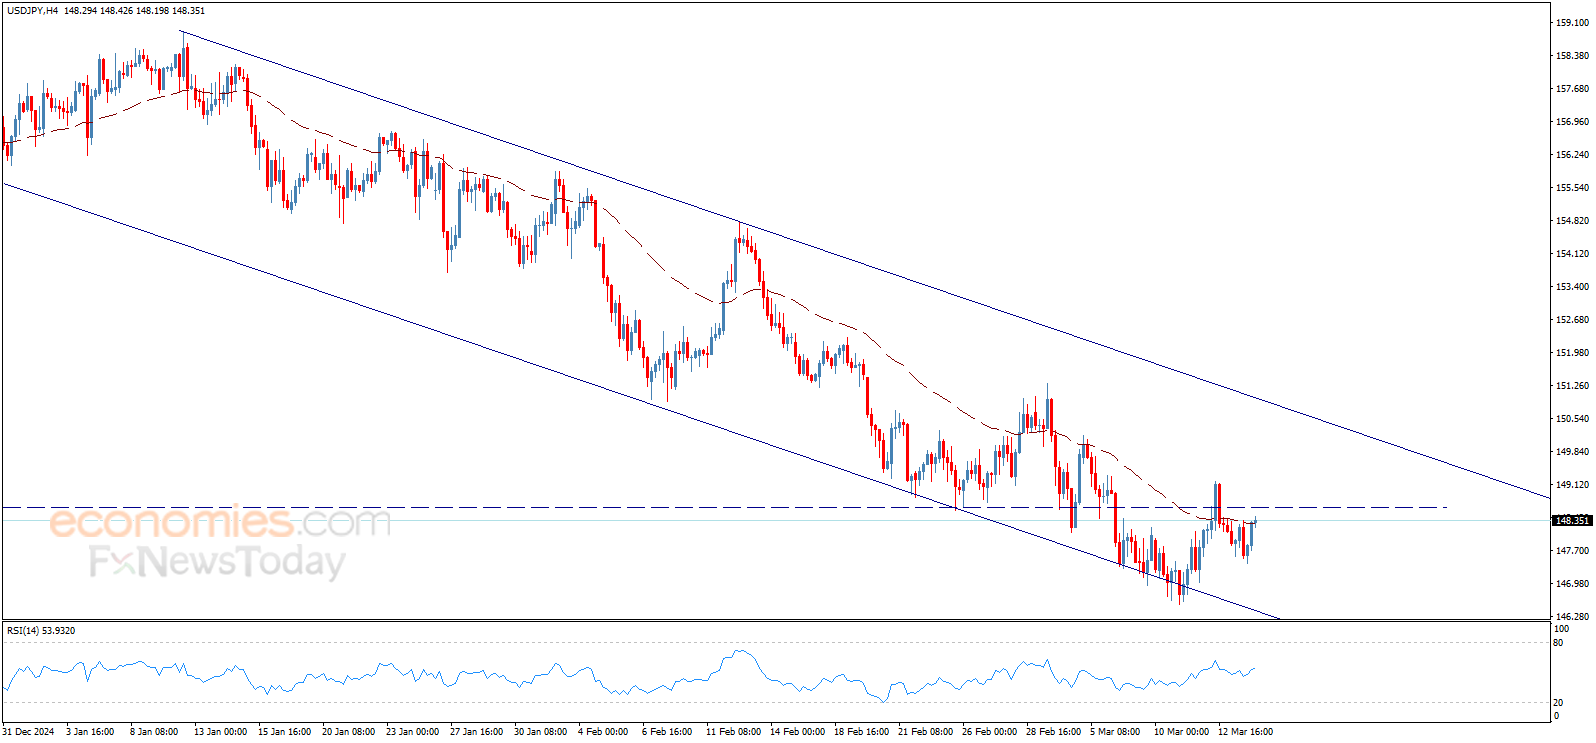
The USDJPY price opened today with new rise to approach the key resistance 148.65, noticing that the EMA50 forms negative pressure that hinders the attempts to achieve more rise, waiting to push the price to resume the expected main bearish trend for the upcoming period, which its next target reaches 146.55.
To review the full report, and to get our more detailed analysis and 100% accurate signals provided by Best Trading Signal, subscribe to Economies.com VIP Club through the link below!
Recent support around $65.50 has some significance as it is near support from September of last year at $65.65, prior to the current decline, was the low price for crude oil since May of 2023. Following the 2023 low traded price, crude oil rallied to a peak of $95.50 before progressing lower and establishing a slow downtrend of lower swing highs and lower swing lows. Therefore, the drop to $65.50 recently established a slightly new low for the bear trend.
There are reasons to believe that support may be retained at that low and lead to at least a bounce before being challenged again. For one, the bearish correction from the $80.76 mid-January high was the deepest bearish correction of the prior four larger corrections, but not by much. There was an 18.3% decline from an August swing high, which was the largest decline of the four.
Although a bullish signal will be generated on a breakout of the double bottom, a potentially significant resistance zone is slightly higher from around $68.74 to $68.82. However, the 20-Day MA trend indicator, currently at $69.26, marks a more significant price area, along with a downtrend line. Since it is falling the 20-Day line may be within the price zone by the time it is approached. Subsequently, a lower swing high is at $70.81.
For a look at all of today’s economic events, check out our economic calendar.
Support around the 50-Day MA was successfully tested as support during the prior bearish decline following the January swing high. Therefore, if the trend breakdown continues lower then natural gas looks to be targeting the 50-Day MA (orange), now at $3.83. A sustained decline below the 20-Day MA enhances the potential for a test of support of the next higher moving average. There is also potential support around the recent swing low at $3.74.
It is joined by the 61.8% retracement at $3.72. A decline below that low will trigger a bearish reversal of the short bull trend that began from the late-January swing low at $2.99. Notice that the 20-Day MA has stayed above the 50-Day line since the 20-Day crossed above the 50-Day in September of last year, other than for a brief period recently. The bullish crossover followed a swing low at $1.88 in late August, which began a new upswing of a larger developing bull trend.
Also, since the immediate trendline may have been broken, the next lower trendline becomes a potential target. Notice that the lower rising trendlines show an acceleration in bullish momentum as the uptrend from the February 2024 bottom progressed. The most recent trendline shows an unsustainable rate of price appreciation. Since there has been a clearly bearish reaction following another test of resistance around the top of a rising parallel trend channel, there is the possibility that the next lower trendline may be tested before the current decline is complete.
For a look at all of today’s economic events, check out our economic calendar.
Silver price (XAG/USD) trades close to near the monthly high of $33.40 in North American trading hours on Thursday. The white metal strengthens as cooling United States (US) consumer and producer inflationary pressures pave the way for the Federal Reserve (Fed) to cut interest rates in the June policy meeting.
The US Producer Price Index (PPI) report showed that the headline and core producer inflation decelerated at a faster-than-expected pace to 3.2% and 3.4%, respectively, in 12 months to February. Month-on-month headline PPI remained flat while the core figure deflated by 0.1%.
On Wednesday, the US headline and core Consumer Price Index (CPI) rose by 2.8% and 3.1%, respectively, in February slower than their estimates and their prior releases.
Last week, Fed Chair Jerome Powell stated that the restrictive monetary policy stance won’t long last “if the labor market unexpectedly weakens or inflation falls more than expected”. The scenario of lower interest rates by the Fed bodes well for non-yielding assets, such as Silver.
On the global front, escalating economic risks due to US President Donald Trump’s tariff agenda have also improved the safe-haven demand of the Silver price. On Wednesday, Trump confirmed that he will respond to counter-tariffs from the European Union (EU). Such a scenario would result in the EU-US trade war, which will diminish the risk appetite of investors significantly.
The cautious market sentiment has also increased the safe-haven demand of the US Dollar (USD) but US economic risks and soft CPI report have capped its upside. The US Dollar Index (DXY), which tracks the Greenback’s value against six major currencies, rises to near 103.80 from its four-month low of 103.20, which it posted on Tuesday.
Silver price trades near the horizontal border of the Ascending Triangle chart pattern on a daily timeframe, which is placed from the February 14 high of $33.40. The upward-sloping border is placed from the December 31 low of $28.78. The above-mentioned chart pattern indicates indecisiveness among market participants.
The 20-day Exponential Moving Average (EMA) near $32.30, continues to support the Silver price.
The 14-day Relative Strength Index (RSI) climbs above 60.00. A bullish momentum would trigger if the RSI sustains above that level.
Looking down, the psychological level of $30.00 will act as key support for the Silver price. While, the October 22 high of $34.87 will be the major barrier.
Silver is a precious metal highly traded among investors. It has been historically used as a store of value and a medium of exchange. Although less popular than Gold, traders may turn to Silver to diversify their investment portfolio, for its intrinsic value or as a potential hedge during high-inflation periods. Investors can buy physical Silver, in coins or in bars, or trade it through vehicles such as Exchange Traded Funds, which track its price on international markets.
Silver prices can move due to a wide range of factors. Geopolitical instability or fears of a deep recession can make Silver price escalate due to its safe-haven status, although to a lesser extent than Gold’s. As a yieldless asset, Silver tends to rise with lower interest rates. Its moves also depend on how the US Dollar (USD) behaves as the asset is priced in dollars (XAG/USD). A strong Dollar tends to keep the price of Silver at bay, whereas a weaker Dollar is likely to propel prices up. Other factors such as investment demand, mining supply – Silver is much more abundant than Gold – and recycling rates can also affect prices.
Silver is widely used in industry, particularly in sectors such as electronics or solar energy, as it has one of the highest electric conductivity of all metals – more than Copper and Gold. A surge in demand can increase prices, while a decline tends to lower them. Dynamics in the US, Chinese and Indian economies can also contribute to price swings: for the US and particularly China, their big industrial sectors use Silver in various processes; in India, consumers’ demand for the precious metal for jewellery also plays a key role in setting prices.
Silver prices tend to follow Gold’s moves. When Gold prices rise, Silver typically follows suit, as their status as safe-haven assets is similar. The Gold/Silver ratio, which shows the number of ounces of Silver needed to equal the value of one ounce of Gold, may help to determine the relative valuation between both metals. Some investors may consider a high ratio as an indicator that Silver is undervalued, or Gold is overvalued. On the contrary, a low ratio might suggest that Gold is undervalued relative to Silver.
The US Dollar Is Affected by Weaker Inflation Figures
According to Forex market trading, the US dollar rose in tandem with news of US inflation for February declining to 0.2% month-on-month from 0.5%, surpassing expectations of 0.3%. Officially announced, the annual rate fell to 3.1% from 3.3%, also lower than the consensus expectations of 3.2%.
Overall, the Forex market guide suggests that weak US inflation would increase the chances of the Federal Reserve cutting interest rates further, which would negatively impact the US dollar. However, the recent period has witnessed sharp volatility for the US dollar and the global currency market in general, so we are not surprised by the unexpected rise in the dollar.
The decline in inflation will alleviate concerns about the US economy heading towards a bout of stagflation, which is, to some extent, supportive of the currency. Furthermore, the US Dollar Index performance had declined during 2025 amid signs of a slowing US economy and expectations of rising inflation with increased import costs due to tariffs. Obviously, high inflation and declining growth create a stagflation environment that rarely supports currencies.
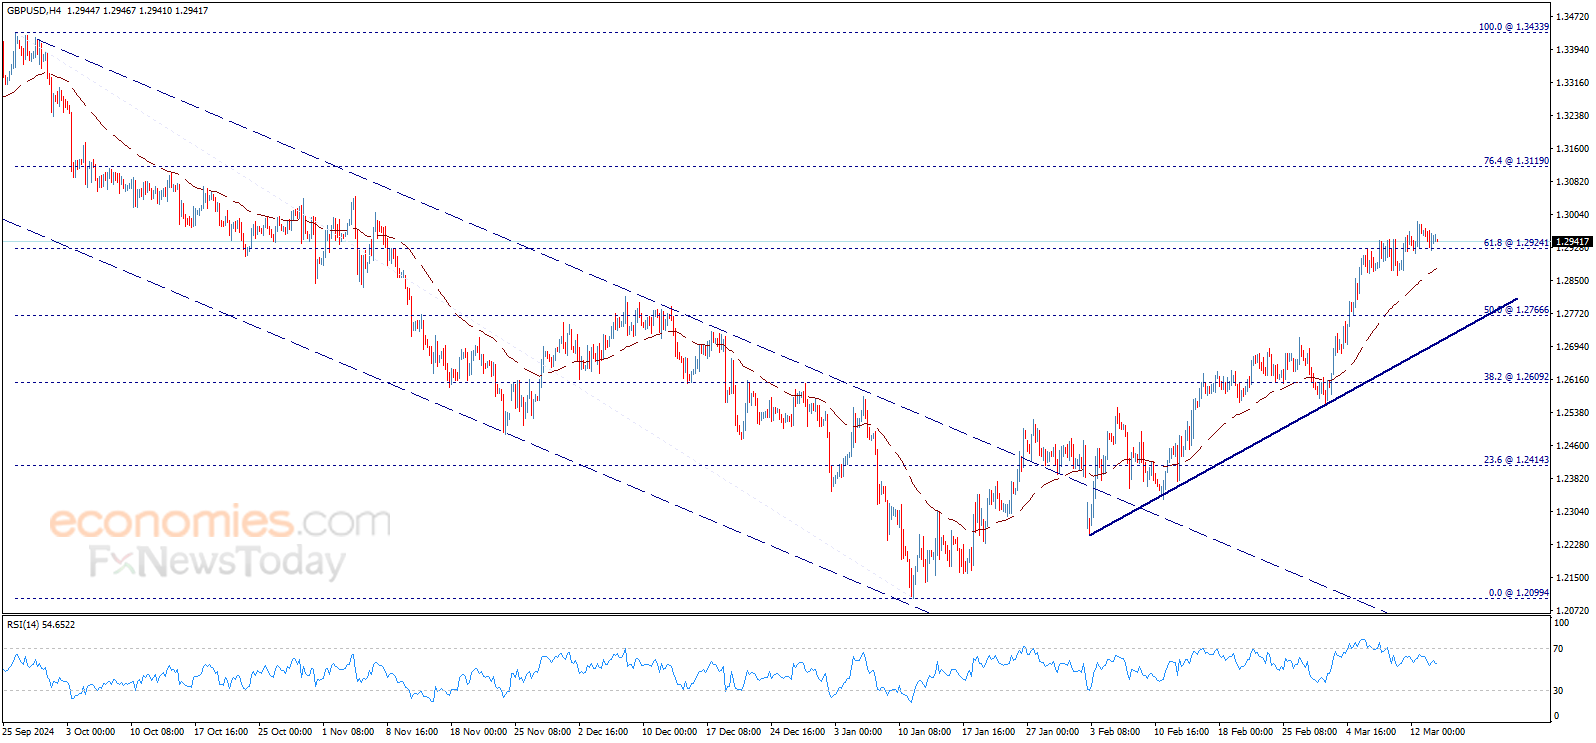
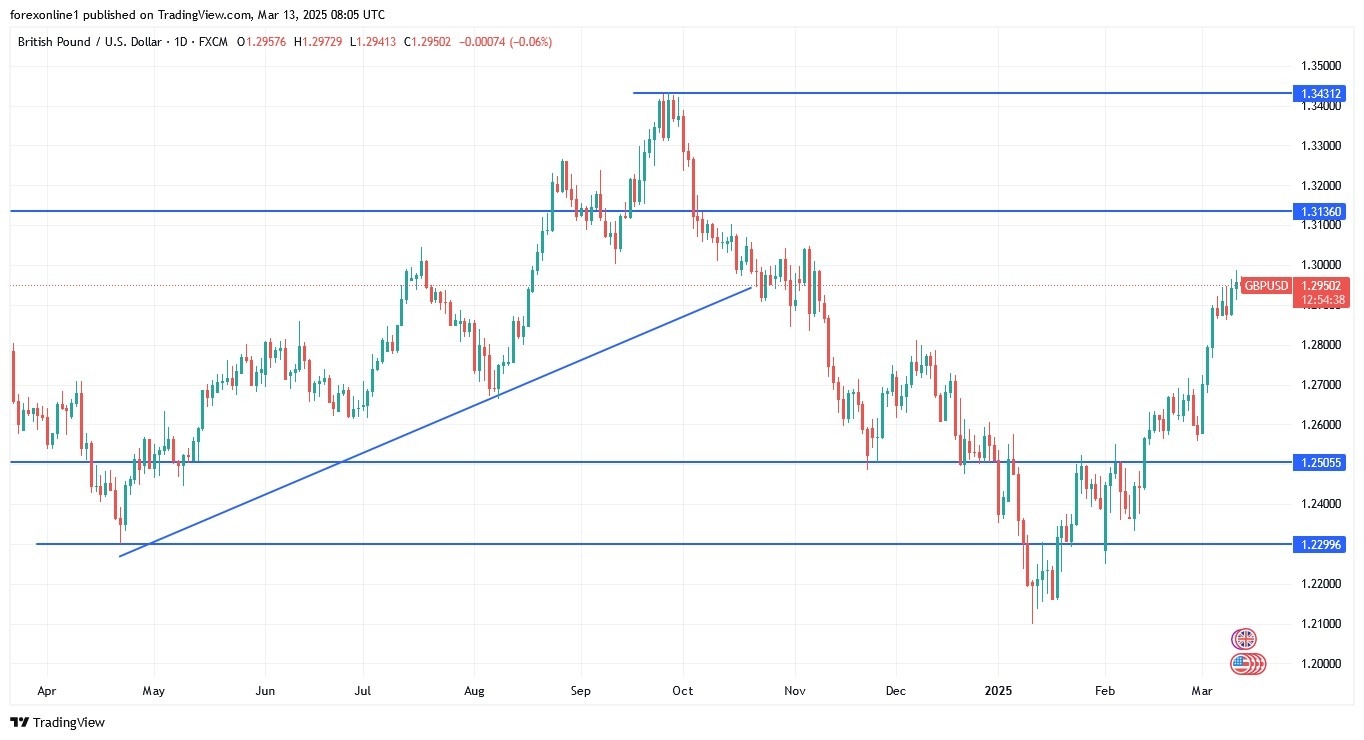
However, the US dollar is also benefiting from the sense that concerns about tariffs are fully understood, and that headlines and threats from the White House are losing their grip on the currency. However, the decline in the GBP/USD pair remains shallow, and the trend of least resistance remains upward, with the psychological resistance level of 1.30 emerging.

The GBP/USD upward trend is at an important stage for continuation or exposure to profit-taking selloffs, so caution is advised.
According to Forex market experts, the situation for the GBP/USD pair will become more difficult at this important 1.30 level. The GBP/USD exchange rate is primarily dependent on the EUR/GBP and EUR/USD exchange rates these days (the EUR/GBP pair is experiencing a slight increase simply because its rise has been slower than the EUR/USD pair’s). However, the slowdown in UK economic growth, caused by fiscal measures, is likely to be sufficient to encourage hedging of any long-term exposure to the British pound, as the GBP/USD exchange rate approaches or breaks the 1.30 level.
According to daily chart trading above, the general trend for the GBP/USD currency pair remains upward. As we mentioned before, the psychological resistance of 1.3000 will remain the most important for the strength of the bulls’ control of the trend, and at the same time, it will be sufficient to push technical indicators towards strong overbought levels, led by the Relative Strength Index and the MACD indicator. In contrast, there will be no exit from the current upward channel without moving towards and below the support level of 1.2740. furthermore, the GBP/USD performance will remain dependent on investor sentiment towards risk appetite and the reaction to signals from global central bank officials. So far, the GBP has avoided the reaction from US tariffs.
Ready to trade the GBP/USD Forex analysis? Check out the best forex trading company in UK worth using.
March 13, 2025 – Written by Ben Hughes
STORY LINK Euro to Dollar Forecast: EUR/USD Drops as US-EU Trade War Escalates
Risk markets are fading lower again and the Euro (EUR) is retracing some of its recent rally against the US Dollar (USD). This comes despite better-than-expected inflation readings in the US. The trade war has escalated in the last 24 hours and the EU is in Trump’s sights.
There was a peculiar reaction to Wednesday’s cooler CPI readings in the US. After a strong rally, stocks faded back into the red, while the US dollar reversed higher. Not only that, the odds of rate cut in May from the Fed fell from 40% to 30%.
This was not the expected reaction – fears of inflation have been weighing on risk markets so the lower-than-expected readings should have given them a significant boost. There were several possible reasons for the reaction.
Firstly, the February data may be the calm beofre the storm. Tariffs are expected to significantly increases inflation over the coming months as prices of imports increase and are passed on to consumers. This has only just started happening.
Secondly, President Trump took credit for the better inflation readings with a post on Truth Social stating,
“The price of eggs have come down, interest rates have come down, gasoline prices have come down—It’s all coming down!”
The problem – at least for markets – is that Trump’s policies seem to be tackling inflation, at least in the short-term. This encourages more of the same policies and Trump has taken to social media to air his thoughts.

“The U.S. doesn’t have Free Trade. We have “Stupid Trade.” The Entire World is RIPPING US OFF!!!,” he posted on Thursday.
Indeed, the last 24 hours have been awash with trade war threats., with the EU now firmly in the crosshairs.
“The European Union, one of the most hostile and abusive taxing and tariffing authorities in the World, which was formed for the sole purpose of taking advantage of the United States, has just put a nasty 50% Tariff on Whisky. If this Tariff is not removed immediately, the U.S. will shortly place a 200% Tariff on all WINES, CHAMPAGNES, & ALCOHOLIC PRODUCTS COMING OUT OF FRANCE AND OTHER E.U. REPRESENTED COUNTRIES.”
This has hit the euro and EURUSD is down 0.4% at 1.085 having reached a peak of 1.095 earlier this week. Tariffs threaten the still-fragile EU economy and could lead to further aggressive cuts from the ECB in a bid to support affected businesses.
The Bank of Canada has taken a similar approach and lowered rates by 25bps yet again this week, taking the rate to 2.75%. This marks 225bps of cuts since June 2024, when rates peaked at 5%. The statement blamed US-Canada trade tensions as a potential drag on growth and a driver of inflation. As ING noted on Wednesday,
“The Bank continues to acknowledge “more than usual uncertainty” due to trade tariffs and has a sense that this uncertainty is “restraining consumers’ spending intentions and businesses’ plans to hire and invest.” After all, 76% of Canadian exports go to the US, equivalent to 20% of Canadian GDP – so even a modest drop in exports could risk a recession.”
Cutting rates will help the economy but they are only now around neutral rates – if stimulus is required to avoid a recession they may have to go much lower and this prospect should keep the Canadian Dollar and euro suppressed and the US dollar bid. So far, there are no signs of inflation making a comeback but both the BoC and ECB will have a challenging year trying to balance out growth and inflation with a messy trade war constantly evolving in the background.
According to FX strategists at Scotiabank, the short-term outlook remains neutral.
“EURUSD continues to consolidate. Spot losses are extending for a second day and testing support in the upper 1.08s but the broader, technical undertone remains constructive and dips to the low/mid 1.08 area should remain supported. Key short-term support is 1.0805. Resistance is 1.0950 and 1.10.”
International Money Transfer? Ask our resident FX expert a money transfer question or try John’s new, free, no-obligation personal service! ,where he helps every step of the way,
ensuring you get the best exchange rates on your currency requirements.
TAGS: Euro Dollar Forecasts
Gold prices (XAU/USD) advanced for a third consecutive day on Thursday, soaring to all-time highs past the $2,980 mark per troy ounce and setting the stage for a potential test of the psychological $3,000 threshold.
The precious metal’s steady climb has entered its second straight week, with gold posting gains in the first three months of the new year. Looking at the bigger picture, the yellow metal has only recorded monthly losses four times since 2024.
Since President Trump’s inauguration on January 20, US trade policy has taken center stage. However, the lack of a clear direction—highlighted by announcements of new tariffs followed by abrupt reversals—has heightened uncertainty among market participants, who see the administration’s trade stance as anything but firm.
This ongoing back-and-forth in the tariff narrative has driven investors toward safe-haven assets, giving gold an extra push and bringing the $3,000 milestone into sight.
Meanwhile, US inflation gauges—both the Consumer Price Index (CPI) and Producer Price Index (PPI)—eased slightly in February, fueling speculation that the Federal Reserve (Fed) could resume its easing cycle in the near future. On the flip side, softening inflation also suggests a slowing economy, bolstering concerns about a possible recession in light of recent weakness in US fundamentals.
For now, negotiations aimed at ending the Russia-Ukraine conflict are ongoing, but no concrete outcome has emerged. Should a ceasefire scenario materialize, gold could face a setback as the removal of geopolitical risk might prompt a move back into riskier assets.
Gold’s next big target on the upside is its record high of $2,983 reached on March 13. Should these levels be breached, Fibonacci projections point to potential milestones at $3,254, $3,396, and $3,600.
On the downside, the first line of defense lies at the weekly low of $2,832 (February 28), followed by the interim 55-day and 100-day SMAs t $2,805 and $2,741, respectively. Down from here emerges the ky 200-day SMA at $2,610, which precedes the November’s low of $2,536 (November 14).
While the Relative Strength Index (RSI) remains on the rise beyond 67, the Average Directional Index (ADX) near 25 indicates a fairly decent strength of the trend.
Gold daily chart