The main category of Forex News.
You can use the search box below to find what you need.
[wd_asp id=1]
The main category of Forex News.
You can use the search box below to find what you need.
[wd_asp id=1]
Gold prices (XAU/USD) advanced for a third consecutive day on Thursday, soaring to all-time highs past the $2,980 mark per troy ounce and setting the stage for a potential test of the psychological $3,000 threshold.
The precious metal’s steady climb has entered its second straight week, with gold posting gains in the first three months of the new year. Looking at the bigger picture, the yellow metal has only recorded monthly losses four times since 2024.
Since President Trump’s inauguration on January 20, US trade policy has taken center stage. However, the lack of a clear direction—highlighted by announcements of new tariffs followed by abrupt reversals—has heightened uncertainty among market participants, who see the administration’s trade stance as anything but firm.
This ongoing back-and-forth in the tariff narrative has driven investors toward safe-haven assets, giving gold an extra push and bringing the $3,000 milestone into sight.
Meanwhile, US inflation gauges—both the Consumer Price Index (CPI) and Producer Price Index (PPI)—eased slightly in February, fueling speculation that the Federal Reserve (Fed) could resume its easing cycle in the near future. On the flip side, softening inflation also suggests a slowing economy, bolstering concerns about a possible recession in light of recent weakness in US fundamentals.
For now, negotiations aimed at ending the Russia-Ukraine conflict are ongoing, but no concrete outcome has emerged. Should a ceasefire scenario materialize, gold could face a setback as the removal of geopolitical risk might prompt a move back into riskier assets.
Gold’s next big target on the upside is its record high of $2,983 reached on March 13. Should these levels be breached, Fibonacci projections point to potential milestones at $3,254, $3,396, and $3,600.
On the downside, the first line of defense lies at the weekly low of $2,832 (February 28), followed by the interim 55-day and 100-day SMAs t $2,805 and $2,741, respectively. Down from here emerges the ky 200-day SMA at $2,610, which precedes the November’s low of $2,536 (November 14).
While the Relative Strength Index (RSI) remains on the rise beyond 67, the Average Directional Index (ADX) near 25 indicates a fairly decent strength of the trend.
Gold daily chart
March 13, 2025 – Written by Tim Boyer
STORY LINK GBP/USD Forecast: Pound Sterling Unable to Break 1.30 – Where Next?
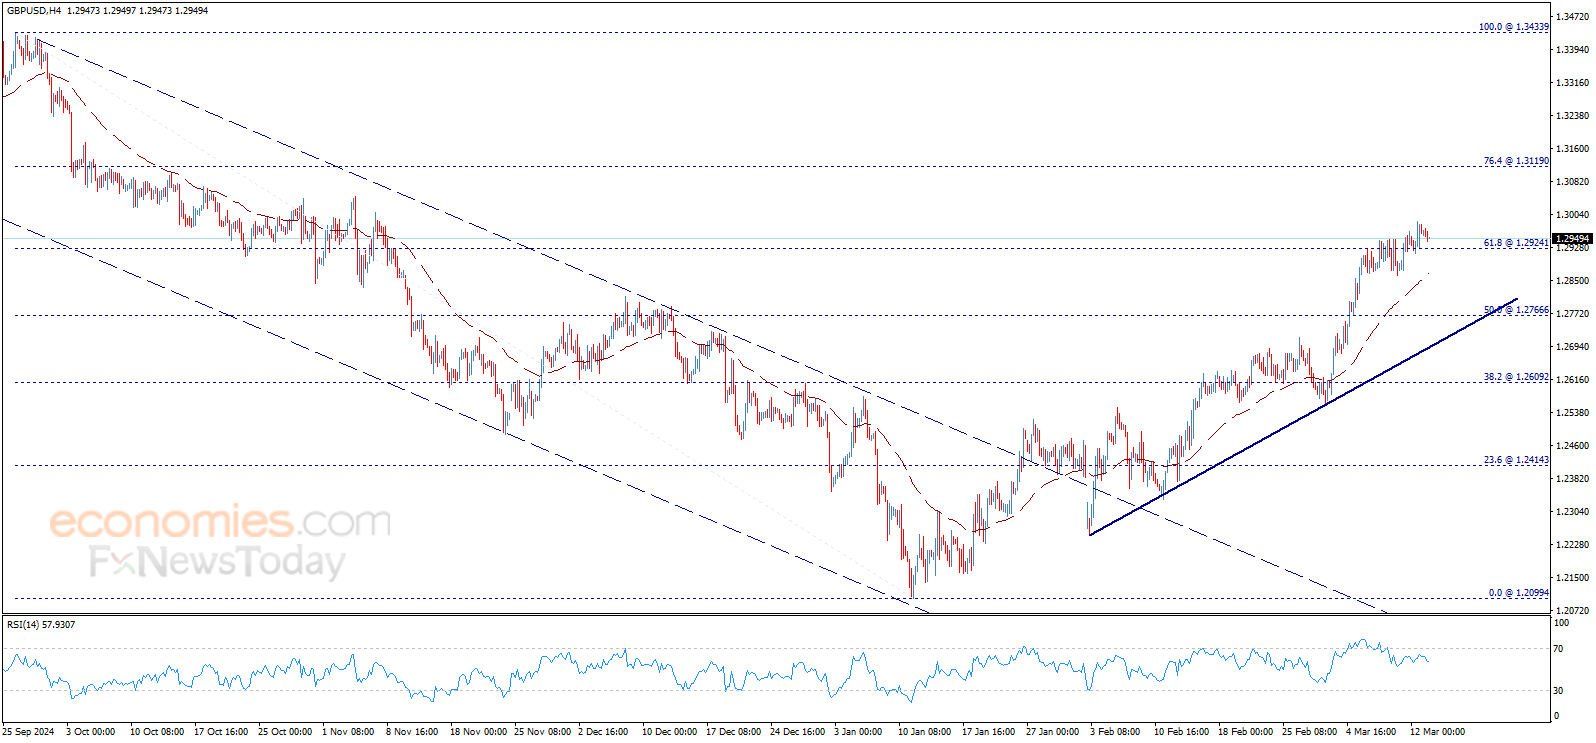
The Pound to Dollar exchange rate (GBP/USD) peaked at 4-month highs just below 1.2990 on Wednesday before a retreat to near 1.2950.
Huge global influences of trade wars and the Ukraine situation will remain crucial for markets with stock market trends also watched very closely.
Markets will also have to factor in the possibility of a US government shutdown given that Senate Democrats are threatening to block the Republican budget resolution.
According to ING; “we retain a bearish bias on GBP/USD, although near-term noise linked to the US macro outlook might still bring the pair temporarily above 1.3000.”
Domestic factors will come into greater focus, especially if there is greater evidence of vulnerability.
The RICS housing index dipped to 11 for February from a revised 21 previously, below consensus forecasts of 20 and a 4-month low.
The indicator of new buyer enquiries also slipped to the lowest level since November 2023.

RICS Chief Economist Simon Rubinson commented; “The UK housing market appears to be losing some momentum as the expiry of the temporary increase in stamp duty thresholds approaches. Some concerns are also being expressed by respondents about the re-emergence of inflationary pressures and the more uncertain geopolitical environment.”
He was still broadly optimistic over the outlook; “That said, looking beyond the next few months, sales activity is seen as likely to resume an upward trend with prices also moving higher.”
The latest UK GDP data will be released on Friday. Consensus forecasts are for 0.1% growth for January after a 0.4% increase previously.
Any monthly contraction in GDP for the month would trigger fresh selling pressure on the Pound.
Monetary and fiscal policy will come into greater focus with the latest Bank of England policy decision on March 20th and budget on March 26th.
The government is likely to announce medium-term departmental spending cuts given the erosion of fiscal headroom.
ING commented; “We still look with some concern at the upcoming 26 March Budget event in the UK, which runs the risk of unnerving a gilt market already hit by EU-bond spillover. We see downside risks for sterling ahead of the risk event.”
Globally, there has been some relief for equity markets with US markets able to secure tentative gains and the FTSE 100 index opening higher on Thursday.
Overall sentiment remains fragile, especially with unease over an escalation in trade wars.
If US markets decline and European markets are resilient, the dollar will tend to weaken. If all markets come under pressure, the US currency could benefit.
According to ING; “the key is whether more equity declines are a US-only matter or followed by European stocks. Futures point to the latter today, so the dollar may not face much idiosyncratic pressure.”
International Money Transfer? Ask our resident FX expert a money transfer question or try John’s new, free, no-obligation personal service! ,where he helps every step of the way,
ensuring you get the best exchange rates on your currency requirements.
TAGS: Pound Dollar Forecasts
Silver price faces negative pressure now to approach testing the key support base 32.86$, and as we mentioned this morning, the price needs to hold above this level to keep the positive scenario active, as breaking it will push the price to suffer more losses on the intraday basis, while the expected bullish wave targets start at 33.35$ and extend to 33.75$.
To review the full report, and to get our more detailed analysis and 100% accurate signals provided by Best Trading Signal, subscribe to Economies.com VIP Club through the link below!
This will be interesting to watch, because Bitcoin was built on the idea of the United States having lower rates in perpetuity. Most Bitcoin traders have no idea how to trade a market that is watching rates rise, and for that matter, I would suggest that most Bitcoin traders have no idea there is an interest rate market. This is where retail traders find trouble, when it becomes a little bit more of a complex game other than just simply “HODLing.”

” dir=”auto” id=”content-1686574122635″>
However, there is something to be said for those who simply hold on for dear life. After all, Bitcoin has rallied in the past, but the catch is you cannot be trying to trade it for short-term moves, looking at it as an investment. You of course have to ignore the fact that it’s not being used for anything at the moment, but it seems like there’s a lot of money on Wall Street willing to pump into this ETF, which of course is exactly what Bitcoin has become.
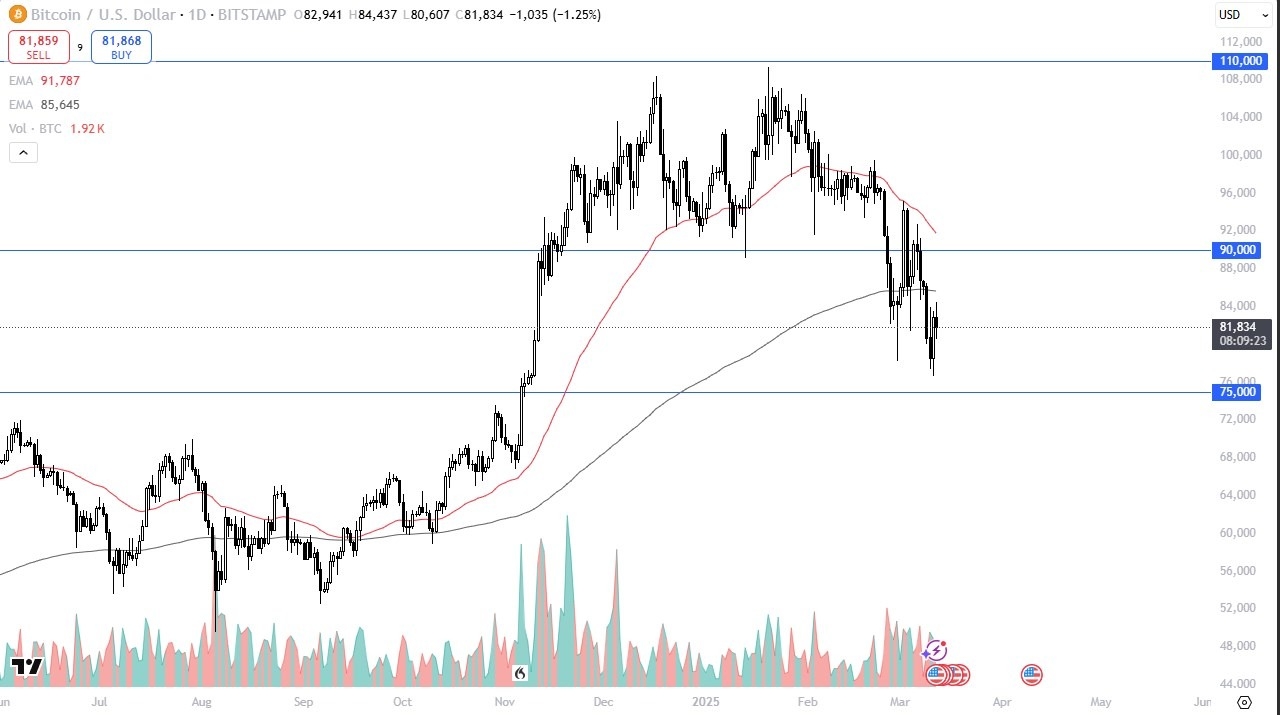
From a technical analysis standpoint, the Bitcoin market is hanging on by a thread, but I would also point out that the $75,000 level should be somewhat supported, as that area was significant resistance previously. As long as we can stay above there, I’m comfortable buying little dips, and building a bigger position. In fact, that’s what I’ve been doing despite the fact that I’m not necessarily a true believer. I’m fine with making money on a market that may or may not be a real thing in the real world.
Ready to trade Bitcoin forex forecast? Here’s a list of some of the best crypto brokers to check out.
Natural gas price surrendered to stochastic negativity by crawling below the additional support at 4.180$ yesterday, hinting postponing the bullish attack to notice suffering some losses by reaching 4.020$.
The temporary negative trades might extend towards 3.900$ to face the minor bullish channel’s support line that forms the key to detect the next main trend, as the stability of the support line will reinforce the chances of activating the bullish attempts to push it to target 4.350$ level, while breaking the support will confirm moving to the negative track, to suffer new losses by moving towards 3.750$ and 3.630$ levels.
The expected trading range for today is between 3.900$ and 4.250$
Trend forecast: Bullish
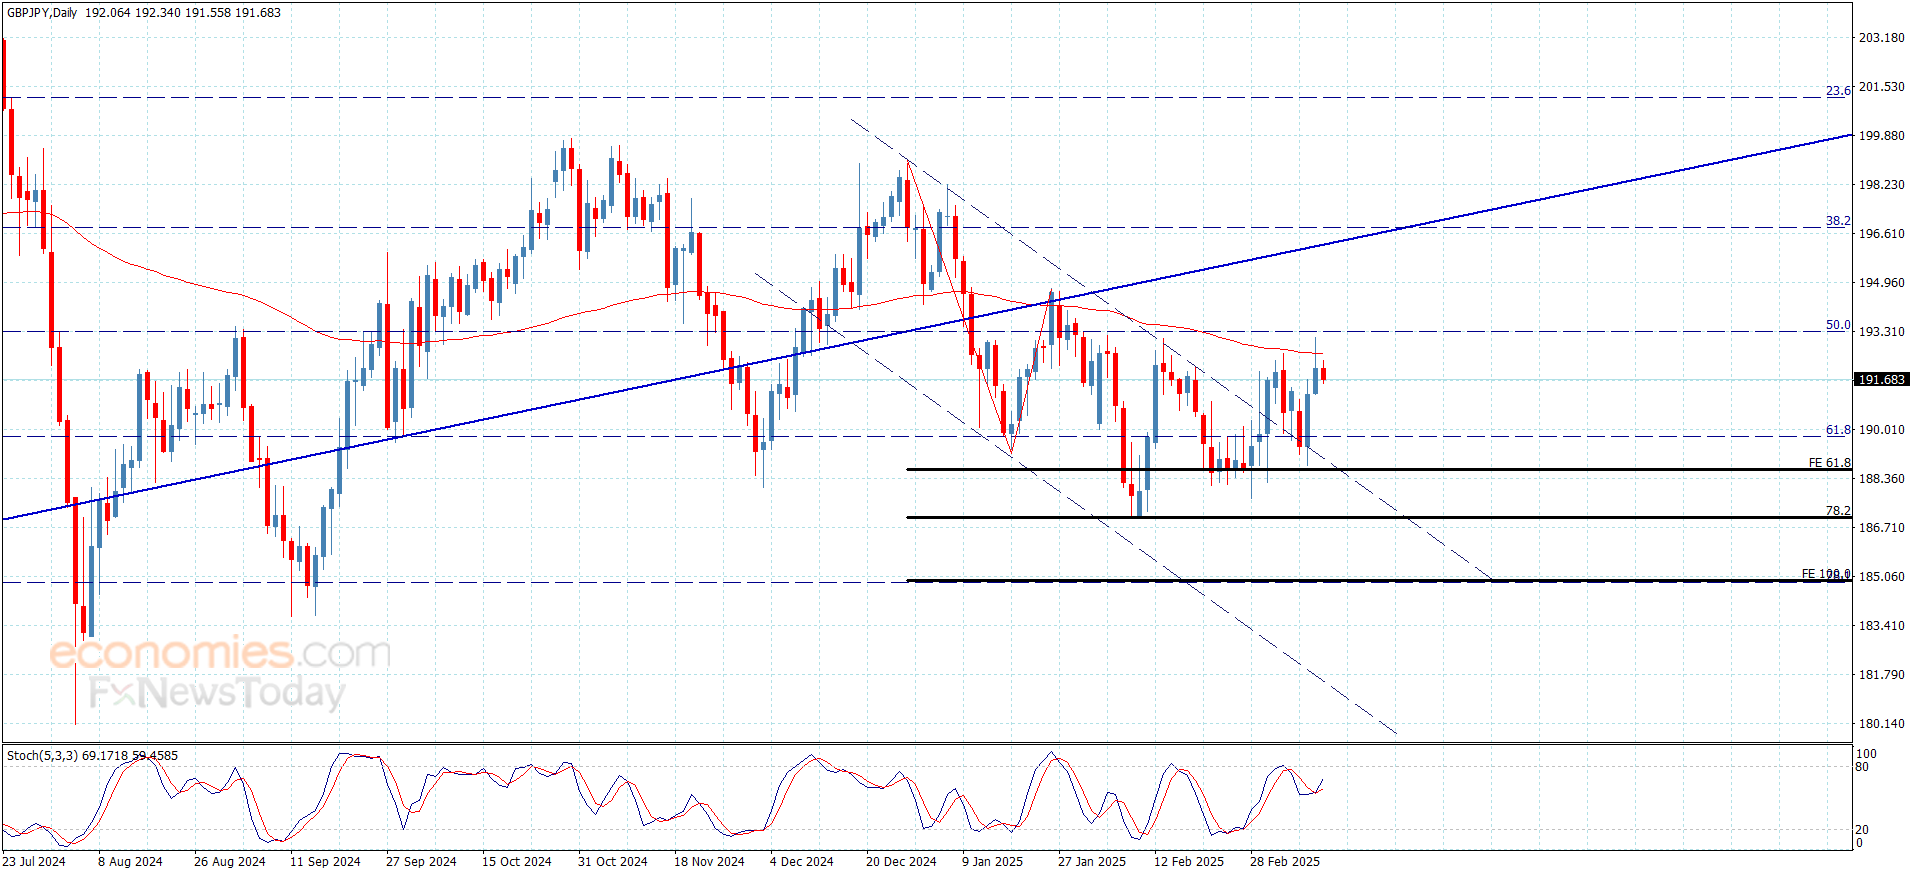
The GBPJPY pair formed strong bullish rally yesterday, to approach the previously targeted barrier at 193.25, forcing it to postpone the bullish attempts and form new negative rebound to settle near 191.60.
Note that the contradiction between the major indicators and the stability of the mentioned barrier might force the price to provide mixed trades, with chances to decline towards 190.60 soon, followed by attempting to renew the bullish attempts and repeat the pressure on the barrier in order to find a way to resume the bullish attack in the upcoming period to target 193.80 and 194.40 levels.
The expected trading range for today is between 190.60 and 192.70
Trend forecast: Bullish
Bitcoin price (BTCUSD) tested 80474.40$ level and kept its stability above it, to start rising and moving away from this level, to hint heading to build bullish wave on the intraday basis, and by taking a deeper look at the chart, we find that the price is forming inverted head and shoulders’ pattern that appears on the minor image.
To review the full report, and to get our more detailed analysis and 100% accurate signals provided by Best Trading Signal, subscribe to Economies.com VIP Club through the link below!
The GBPJPY pair formed strong bullish rally yesterday, to approach the previously targeted barrier at 193.25, forcing it to postpone the bullish attempts and form new negative rebound to settle near 191.60.
Note that the contradiction between the major indicators and the stability of the mentioned barrier might force the price to provide mixed trades, with chances to decline towards 190.60 soon, followed by attempting to renew the bullish attempts and repeat the pressure on the barrier in order to find a way to resume the bullish attack in the upcoming period to target 193.80 and 194.40 levels.
The expected trading range for today is between 190.60 and 192.70
Trend forecast: Bullish
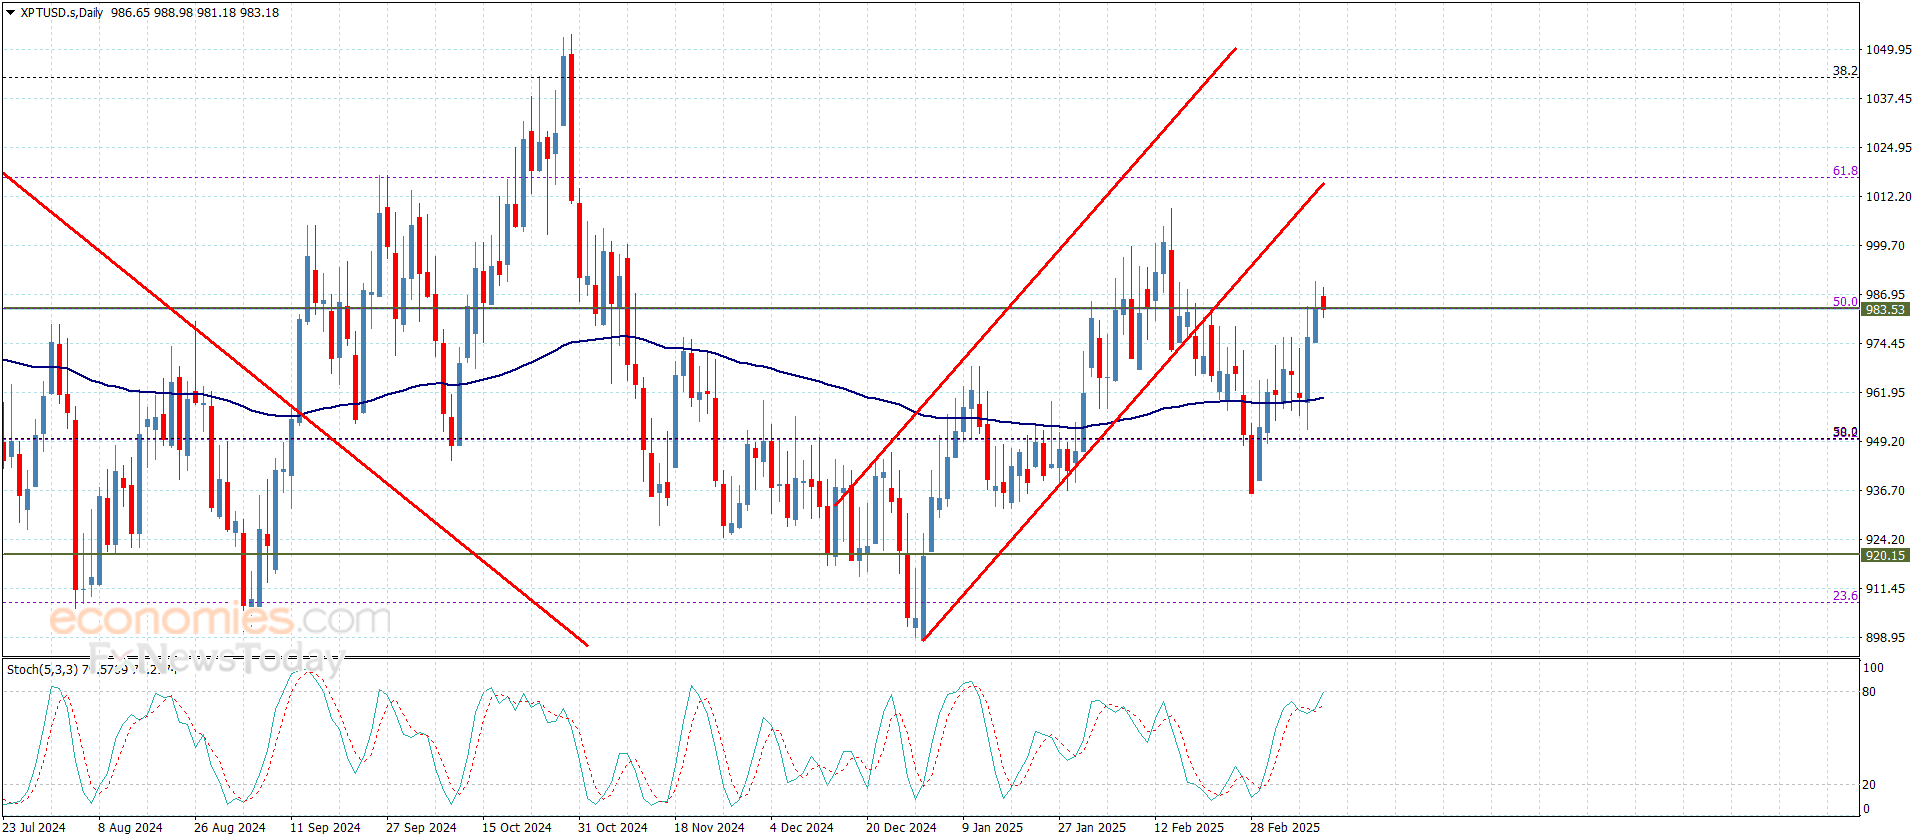
Platinum price touched 990.00$ level during the last bullish rally and formed some sideways trades by fluctuating near 983.00$ level that formed an obstacle against the bullish attempts recently.
We notice stochastic attempt to crawl towards the overbought areas to increase the chances of gaining the additional positive momentum to manage to resume the bullish attack, waiting to target 998.00$ level soon, followed by reaching the next target at 1012.00$, assuring the importance of holding above 968.00$ that forms additional support against the bullish attempts.
The expected trading range for today is between 974.00$ and 998.00$
Trend forecast: Bullish
On an annual basis, headline CPI declined to 2.8% from 3.0%, and core CPI dropped to 3.1% from 3.3%. The data reinforced expectations of a policy shift toward monetary easing, though Fed officials remain measured in their outlook.
Despite inflation cooling, the Federal Reserve has signaled no immediate changes to policy. Fed Chair Jerome Powell noted that rate cuts are not urgent given ongoing economic uncertainties.
San Francisco Fed President Mary Daly added that while slowing business activity is a factor, it is not yet enough to justify immediate adjustments. This cautious approach has tempered expectations for aggressive rate reductions.
Traders are closely watching key US economic data scheduled for release on Thursday, March 13, which could impact market sentiment and the Federal Reserve’s policy outlook.
The Producer Price Index (PPI) and Core PPI are expected to show 0.3% monthly growth, with a slight slowdown from the previous 0.4% PPI reading.
Additionally, weekly unemployment claims are forecast at 226K, up from 221K last week, signaling potential shifts in the labor market and broader economic trends.