The main category of Forex News.
You can use the search box below to find what you need.
[wd_asp id=1]
The main category of Forex News.
You can use the search box below to find what you need.
[wd_asp id=1]
The GBPCHF price formed minor bullish channel recently to settle above it support line at 1.1290 now, noticing recording some gains by rallying towards 1.1350.
The frequent stability within the bullish channel and stochastic attempt to gather the positive momentum will increase the chances of recording additional gains, to expect rallying towards 1.1390 followed by starting to renew the pressure on 1.1425 barrier.
The expected trading range for today is between 1.1320 and 1.1390
Trend forecast: Bullish
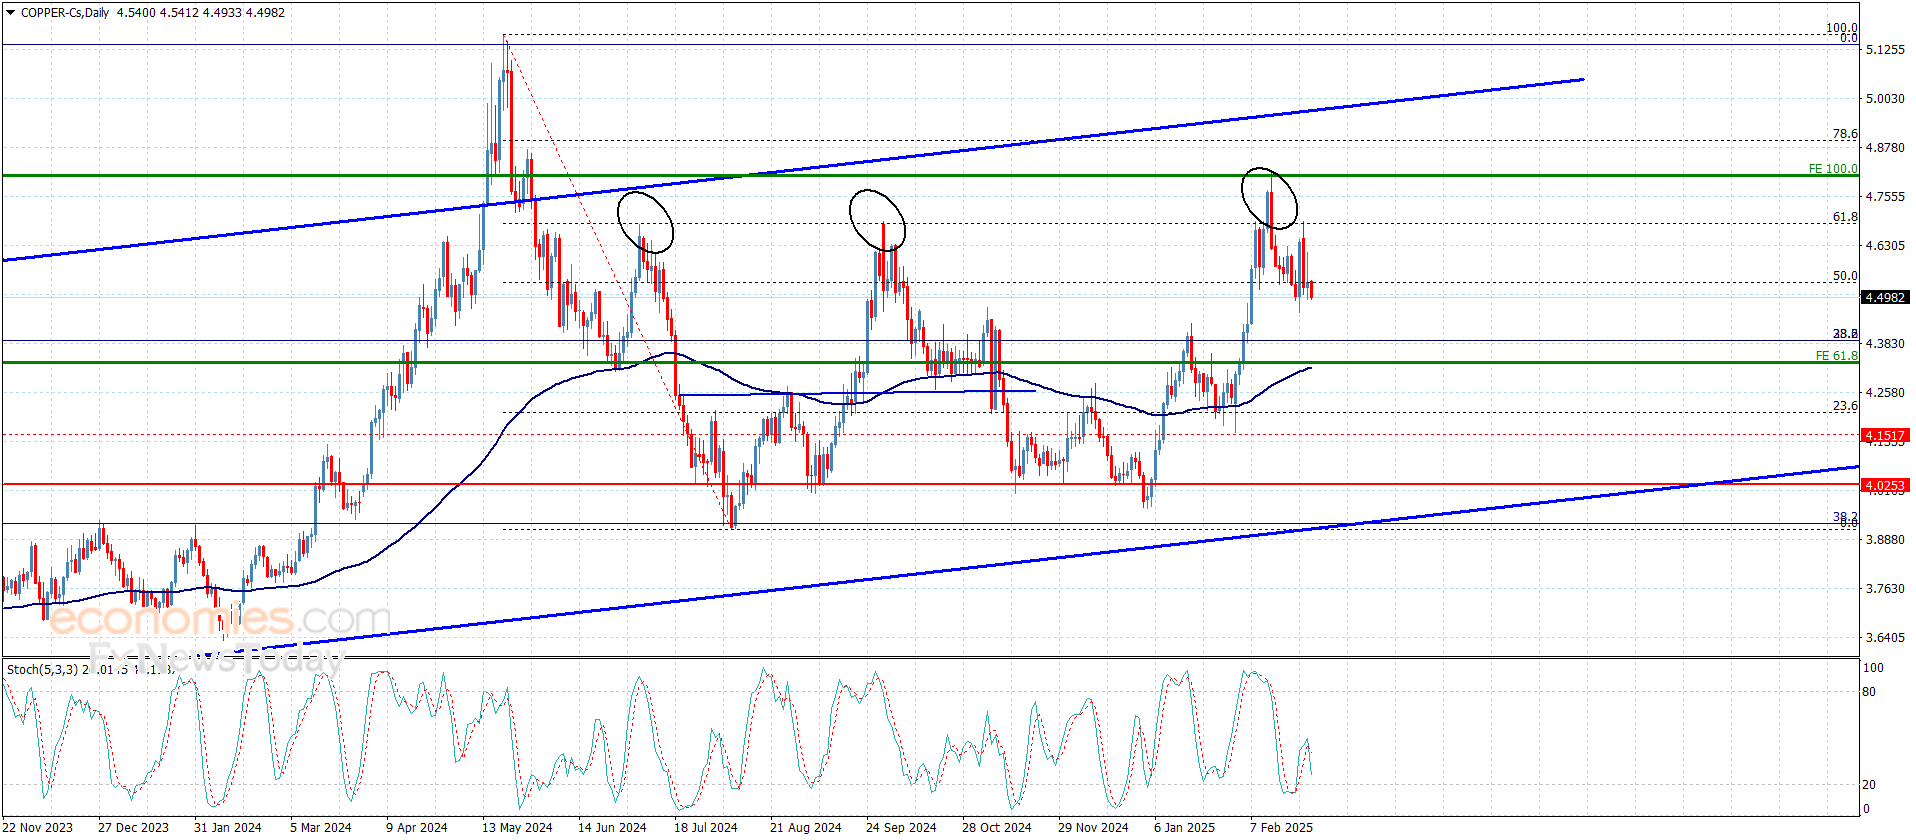
Copper price started today by providing new negative close below 50% Fibonacci correction level at 4.5400$, confirming its surrender to the previously suggested bareish scenario to repeat its fluctuation near 4.4900$ level.
We expect to get more negative momentum by stochastic to start targeting the negative stations, located near 4.4100$ and 4.3200$ now.
The expected trading range for today is between 4.4100$ and 4.5600$
Trend forecast: Bearish
EUR/USD struggles to stage a rebound and trades below 1.0400 in the European morning on Friday after posting large losses on Thursday. The pair’s technical outlook highlights a bearish shift in the short-term bias as market focus shifts to key inflation data releases from Germany and the US.
The table below shows the percentage change of Euro (EUR) against listed major currencies this week. Euro was the weakest against the US Dollar.
| USD | EUR | GBP | JPY | CAD | AUD | NZD | CHF | |
|---|---|---|---|---|---|---|---|---|
| USD | 0.58% | 0.30% | 0.80% | 1.52% | 2.27% | 2.46% | 0.33% | |
| EUR | -0.58% | -0.37% | 0.05% | 0.75% | 1.67% | 1.68% | -0.42% | |
| GBP | -0.30% | 0.37% | 0.45% | 1.12% | 2.04% | 2.05% | -0.06% | |
| JPY | -0.80% | -0.05% | -0.45% | 0.72% | 1.55% | 1.73% | -0.38% | |
| CAD | -1.52% | -0.75% | -1.12% | -0.72% | 0.69% | 0.93% | -1.16% | |
| AUD | -2.27% | -1.67% | -2.04% | -1.55% | -0.69% | 0.00% | -2.06% | |
| NZD | -2.46% | -1.68% | -2.05% | -1.73% | -0.93% | -0.01% | -2.06% | |
| CHF | -0.33% | 0.42% | 0.06% | 0.38% | 1.16% | 2.06% | 2.06% |
The heat map shows percentage changes of major currencies against each other. The base currency is picked from the left column, while the quote currency is picked from the top row. For example, if you pick the Euro from the left column and move along the horizontal line to the US Dollar, the percentage change displayed in the box will represent EUR (base)/USD (quote).
The US Dollar (USD) gathered strength in the American session on Thursday and triggered a leg lower in EUR/USD as safe-haven flows dominated the action in financial markets.
After suggesting on Wednesday that the 25% tariff package on Mexican and Canadian imports would go into effect on April 2nd, US President Donald Trump clarified on Thursday that they will be imposed on March 4th as initially planned. He further noted that China will also be charged an extra 10% tariff on that date. In response, major equity indexes in the US declined sharply, allowing the USD to outperform its risk-sensitive rivals.
The Consumer Price Index (CPI) in Germany is forecast to rise 2.3% on a yearly basis in February, matching January’s increase. A softer-than-forecast inflation reading could hurt the Euro with the immediate reaction.
Additionally, the US Bureau of Economic Analysis (BEA) will publish the Personal Consumption Expenditure (PCE) Price Index data for January. Although this report by itself is unlikely to alter the market pricing of the Federal Reserve’s rate outlook in a significant way, a monthly core PCE Price Index increase of 0.4%, or higher, could further boost the USD and weigh on EUR/USD.
The Relative Strength Index (RSI) indicator on the 4-hour chart stays well below 40 after EUR/USD closed below the 20-day Simple Moving Average (SMA) for the first time in over two weeks on Thursday, reflecting a bearish shift in the short-term outlook.
On the downside, 1.0350 (Fibonacci 38.2% retracement of the latest downtrend) aligns as next support before 1.0300-1.0290 (round level, Fibonacci 23.6% retracement) and 1.0250 (static level). In case EUR/USD stabilizes above 1.0390-1.0400 (Fibonacci 50% retracement, 200-period SMA) and confirms this level as support, 1.0440 (Fibonacci 61.8% retracement) and 1.0500-1.0510 (Fibonacci 78.6% retracement, static level) could be seen as next resistance levels.
Inflation measures the rise in the price of a representative basket of goods and services. Headline inflation is usually expressed as a percentage change on a month-on-month (MoM) and year-on-year (YoY) basis. Core inflation excludes more volatile elements such as food and fuel which can fluctuate because of geopolitical and seasonal factors. Core inflation is the figure economists focus on and is the level targeted by central banks, which are mandated to keep inflation at a manageable level, usually around 2%.
The Consumer Price Index (CPI) measures the change in prices of a basket of goods and services over a period of time. It is usually expressed as a percentage change on a month-on-month (MoM) and year-on-year (YoY) basis. Core CPI is the figure targeted by central banks as it excludes volatile food and fuel inputs. When Core CPI rises above 2% it usually results in higher interest rates and vice versa when it falls below 2%. Since higher interest rates are positive for a currency, higher inflation usually results in a stronger currency. The opposite is true when inflation falls.
Although it may seem counter-intuitive, high inflation in a country pushes up the value of its currency and vice versa for lower inflation. This is because the central bank will normally raise interest rates to combat the higher inflation, which attract more global capital inflows from investors looking for a lucrative place to park their money.
Formerly, Gold was the asset investors turned to in times of high inflation because it preserved its value, and whilst investors will often still buy Gold for its safe-haven properties in times of extreme market turmoil, this is not the case most of the time. This is because when inflation is high, central banks will put up interest rates to combat it. Higher interest rates are negative for Gold because they increase the opportunity-cost of holding Gold vis-a-vis an interest-bearing asset or placing the money in a cash deposit account. On the flipside, lower inflation tends to be positive for Gold as it brings interest rates down, making the bright metal a more viable investment alternative.
Platinum price resumed the negative attempts, surpassing the first target at 950.00$, confirming its preparation to provide more negative attempts on the near-term and medium-term basis.
Also, the EMA50 forms additional barrier now at 960.00$, and stochastic provides the negative momentum, to increase the chances of attacking 941.00$ level, while breaking it might extend losses towards 920.00$ on the near-term basis.
The expected trading range for today is between 941.00$ and 960.00$
Trend forecast: Bearish
Platinum price resumed the negative attempts, surpassing the first target at 950.00$, confirming its preparation to provide more negative attempts on the near-term and medium-term basis.
Also, the EMA50 forms additional barrier now at 960.00$, and stochastic provides the negative momentum, to increase the chances of attacking 941.00$ level, while breaking it might extend losses towards 920.00$ on the near-term basis.
The expected trading range for today is between 941.00$ and 960.00$
Trend forecast: Bearish
Silver price (XAG/USD) falls for a straight third trading day and declines to near $32.00 in European trading hours on Tuesday. The white metal weakens even though United States (US) President Donald Trump has confirmed that his plans of imposing 25% tariffs on Canada and Mexico on March 4, which were delayed by a month, are on.
“The tariffs are going forward on time, on schedule,” Trump said during a press conference on Monday.
President Trump postponed his tariffs plans after his North American peers agreed to criminal enforcement at borders to restrict the flow of fentanyl and illegal immigrants. Tariffs by the US on its close peers are expected to heighten political risks and weigh on the global economic outlook. Such a scenario remains favorable for precious metals, such as Silver.
Meanwhile, steadiness in the US Dollar (USD) after a recovery move from its fresh 11-week low has weighed on the Silver price to some extent. The US Dollar rebounds as investors digest weak flash US S&P Global PMI data for February, which was released on Friday. The PMI report showed that the Services PMI, which gauges activities in the services sector, contracted for the first time after expanding for 25 straight months.
Going forward, investors will focus on Russia-US peace talks to end the war in Ukraine, which has entered its fourth year. Geopolitical tensions increase the safe-haven demand of the Silver price.
On Monday, French President Emmanuel Macron met Donald Trump to avoid a quick ceasefire deal and discussed military guarantees to Ukraine, Reuters report.
Silver price retraces after failing to extend its upside above the February 14 high of $33.40 on Thursday. The outlook of the white metal remains bullish as the 50-day Exponential Moving Average (EMA) has been sloping higher, which trades around $31.40.
The 14-day Relative Strength Index (RSI) falls inside the 40.00-60.00 range, suggesting that the bullish momentum has faded. However, the bullish bias remains intact.
Looking down, the upward-sloping trendline from the August 8 low of $26.45 will act as key support for the Silver price around $30.00. While, the October 22 high of $34.87 will be the key barrier.
Silver is a precious metal highly traded among investors. It has been historically used as a store of value and a medium of exchange. Although less popular than Gold, traders may turn to Silver to diversify their investment portfolio, for its intrinsic value or as a potential hedge during high-inflation periods. Investors can buy physical Silver, in coins or in bars, or trade it through vehicles such as Exchange Traded Funds, which track its price on international markets.
Silver prices can move due to a wide range of factors. Geopolitical instability or fears of a deep recession can make Silver price escalate due to its safe-haven status, although to a lesser extent than Gold’s. As a yieldless asset, Silver tends to rise with lower interest rates. Its moves also depend on how the US Dollar (USD) behaves as the asset is priced in dollars (XAG/USD). A strong Dollar tends to keep the price of Silver at bay, whereas a weaker Dollar is likely to propel prices up. Other factors such as investment demand, mining supply – Silver is much more abundant than Gold – and recycling rates can also affect prices.
Silver is widely used in industry, particularly in sectors such as electronics or solar energy, as it has one of the highest electric conductivity of all metals – more than Copper and Gold. A surge in demand can increase prices, while a decline tends to lower them. Dynamics in the US, Chinese and Indian economies can also contribute to price swings: for the US and particularly China, their big industrial sectors use Silver in various processes; in India, consumers’ demand for the precious metal for jewellery also plays a key role in setting prices.
Silver prices tend to follow Gold’s moves. When Gold prices rise, Silver typically follows suit, as their status as safe-haven assets is similar. The Gold/Silver ratio, which shows the number of ounces of Silver needed to equal the value of one ounce of Gold, may help to determine the relative valuation between both metals. Some investors may consider a high ratio as an indicator that Silver is undervalued, or Gold is overvalued. On the contrary, a low ratio might suggest that Gold is undervalued relative to Silver.
Platinum price resumed the negative attempts, surpassing the first target at 950.00$, confirming its preparation to provide more negative attempts on the near-term and medium-term basis.
Also, the EMA50 forms additional barrier now at 960.00$, and stochastic provides the negative momentum, to increase the chances of attacking 941.00$ level, while breaking it might extend losses towards 920.00$ on the near-term basis.
The expected trading range for today is between 941.00$ and 960.00$
Trend forecast: Bearish
Brent oil price continued to rise to test 74.00$ level, noticing that the price consolidates below this level after attempting to breach it in the previous sessions, accompanied by witnessing clear negative signals through stochastic, which overlaps negatively now.
For more: please follow us on Telegram channel.
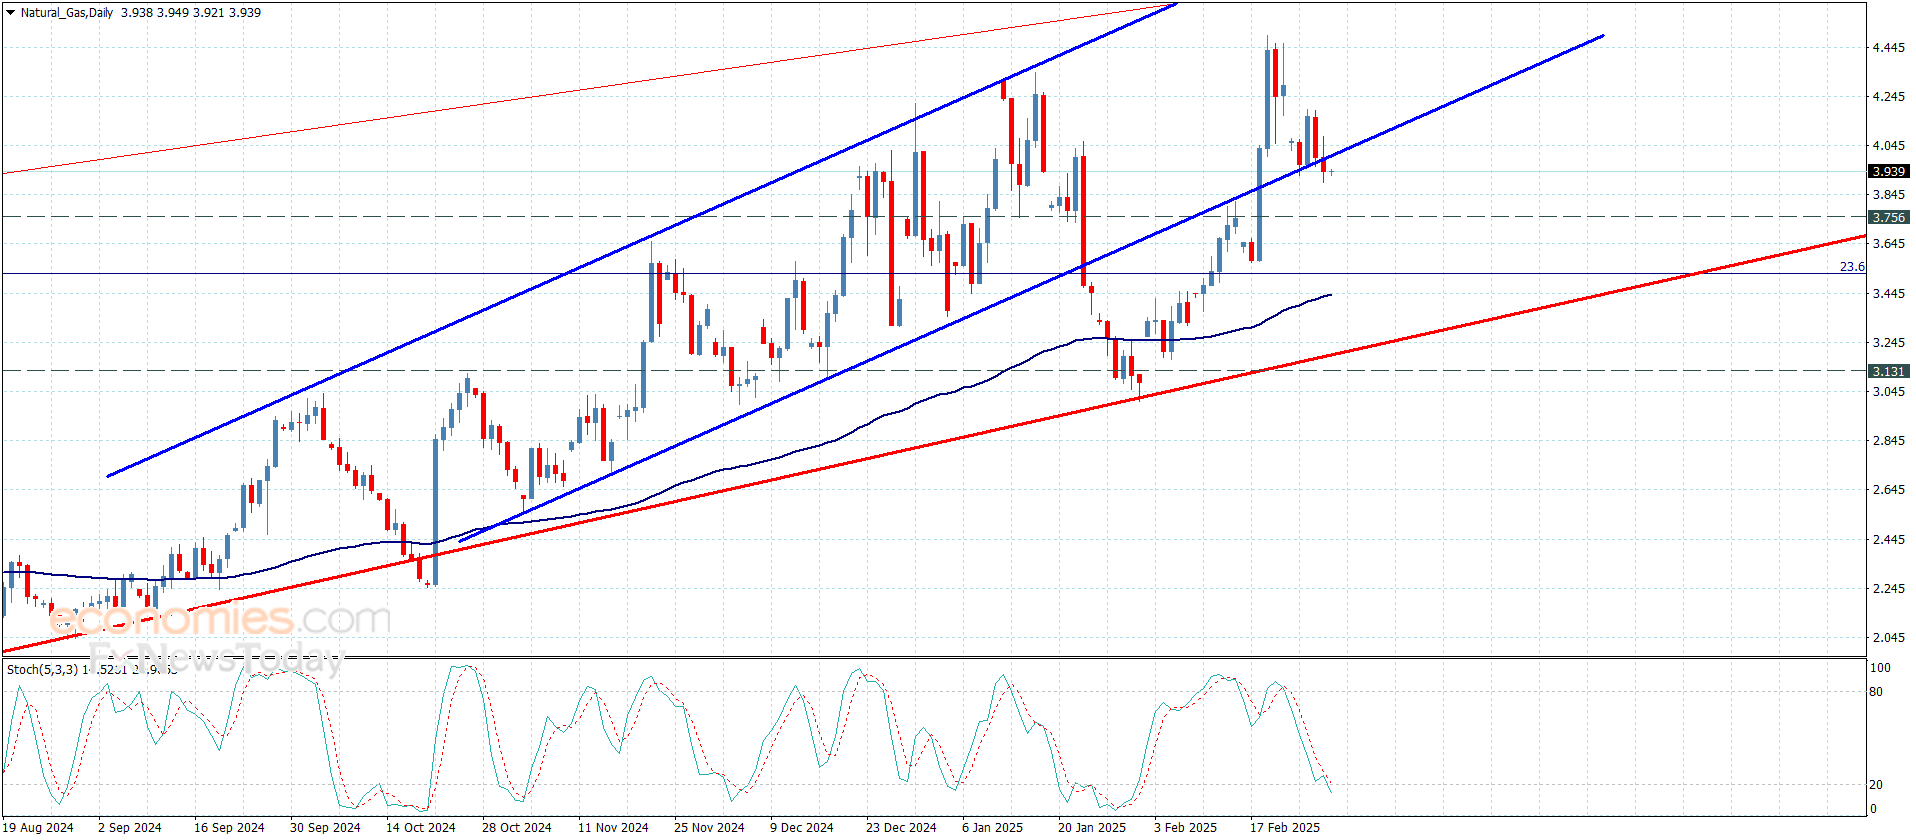
Natural gas price touched 4.186$ level yesterday followed by surrendering to stochastic intraday negativity, to notice retesting 3.950$ support line and settling above it to confirm keeping the previously suggested bullish bias.
Now, stochastic attempt to gather the positive momentum will increase the chances of rallying towards 4.240$ to form the first target for the current trades, while surpassing it might extend trades towards 4.500$ recorded high direct.
The expected trading range for today is between 3.900$ and 4.240$
Trend forecast: Bullish
Spot Gold trades near a fresh weekly low of $2,867.76 on Thursday as risk aversion fueled demand for the safe-haven US Dollar (USD) across the Forex board. The United States (US) released relevant macroeconomic data, which fell short of impressive.
On the one hand, the US confirmed the annualized Q4 Gross Domestic Product (GDP) at 2.3% in the second estimate of the figure, although quarterly Personal Consumption Expenditures Prices suffered an upward revision to 2.4% from the previous estimate of 2.3%, and the core PCE prices were even higher, hitting 2.7% from the previous 2.5%.
On the other hand, Initial Jobless Claims rose to 242K in the week ended February 22, much higher than the 221K anticipated by market players. Also, Durable Goods Orders were up 3.1% in January, beating expectations of 2%. Finally, Pending Home Sales fell by 4.6% in the same month, much worse than the -1.3% expected.
However, what actually triggered fears was US President Donald Trump. After suggesting tariffs on Canada and Mexico will start in April on Wednesday, Trump rectified himself and clarified levies will go into effect on March 4 as scheduled. He also added an additional 10% tariff on China on the same date and said that reciprocal tariffs would come into effect on April 2.
Other than that, the US will publish on Friday the January Personal Consumption Expenditures (PCE) Price Index, the Federal Reserve’s (Fed) favorite inflation gauge. The PCE Price Index is foreseen up 0.3% on a monthly basis and by 2.5% from a year earlier.
The daily chart for the XAU/USD pair shows an increased bearish potential, as it is breaking below a bullish 20 Simple Moving Average (SMA), the first time below it since January 7. The pair remains far above bullish 100 and 200 SMAs, yet technical indicators maintain their firmly bearish slopes, approaching their midlines from above.
In the near term and according to the 4-hour chart, XAU/USD extended its slide below the 20 and 100 SMAs, with the shorter gaining downward traction above the longer one. Technical indicators, in the meantime, have resumed their slides near oversold readings, maintaining a strong bearish momentum and anticipating lower lows ahead.
Support levels: 2,867.70 2,852.90 2,839.10
Resistance levels: 2,894.80 2,907.60 2,925.60