The main category of Forex News.
You can use the search box below to find what you need.
[wd_asp id=1]
The main category of Forex News.
You can use the search box below to find what you need.
[wd_asp id=1]
It is possible that today’s breakdown fails and instead support is retained, leading a rally. A decisive breakout above today’s high of $4.07 would provide a sign of strength that could lead to higher prices. Subsequently, Tuesday’s high at $4.19 would need to be exceeded for additional bullish confirmation. There is a price range of potentially significant resistance around the two most recent swing highs from $4.37 to $4.48.
Nonetheless, given today’s bearish signal, the more likely scenario to play out is a deeper bearish pullback. Although there is an interim potential support zone around the 50% retracement at $3.73, it also begins a range of potential support going down to a weekly low at $3.55. Both the 20-Day and 50-Day MAs are rising and may converge with the 50% zone prior to it being tested as support.
If that happens it may provide a more significant support area given the convergence of several indicators. Further, the 20-Day MA is poised to cross above the 50-Day line, providing another sign of strength. Since the 50-Day MA covers a larger trend than the 20-Day line, it is given priority.
It is also interesting to note that on the weekly chart (not shown) support for this week is around the 200-Week MA, now at $3.92. The low for the week is today’s low at $3.88.
For a look at all of today’s economic events, check out our economic calendar.
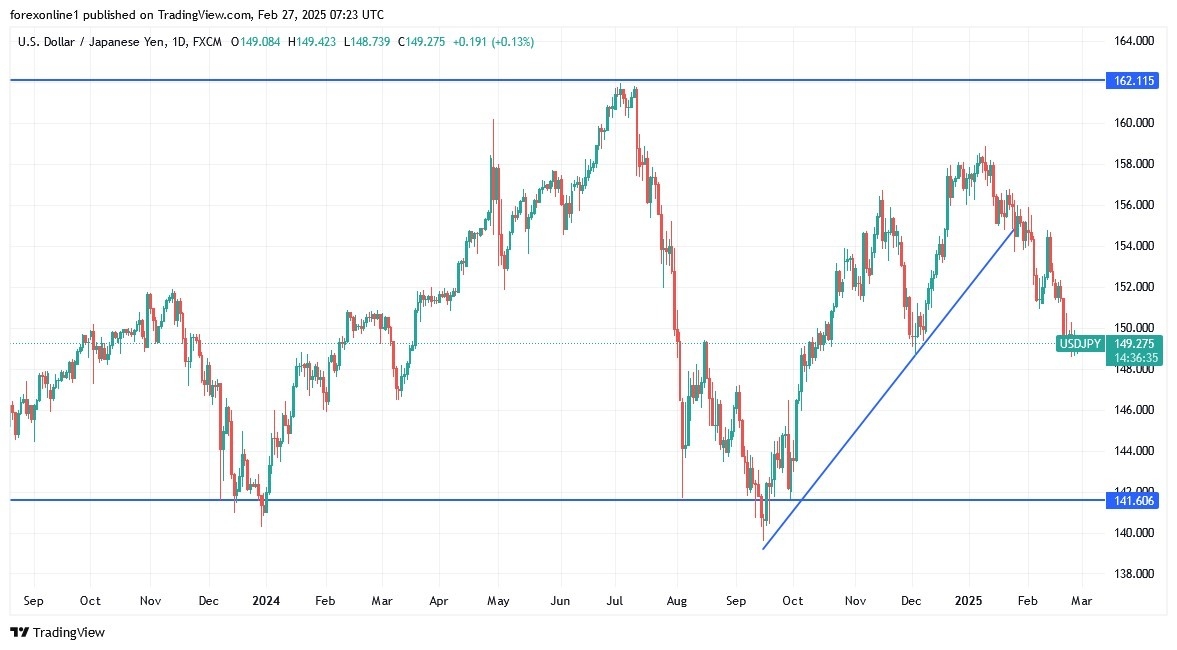
Despite the decline, according to licensed trading platforms, the Japanese Yen remained near its highest levels in several months, supported by strong expectations that the Bank of Japan will continue to raise interest rates this year after bullish inflation surprises in the fourth quarter. Investors are now focusing on a series of key economic reports due out on Friday, including industrial production, retail sales and inflation data in Tokyo, which may provide further clarity on the Bank of Japan’s monetary policy outlook.

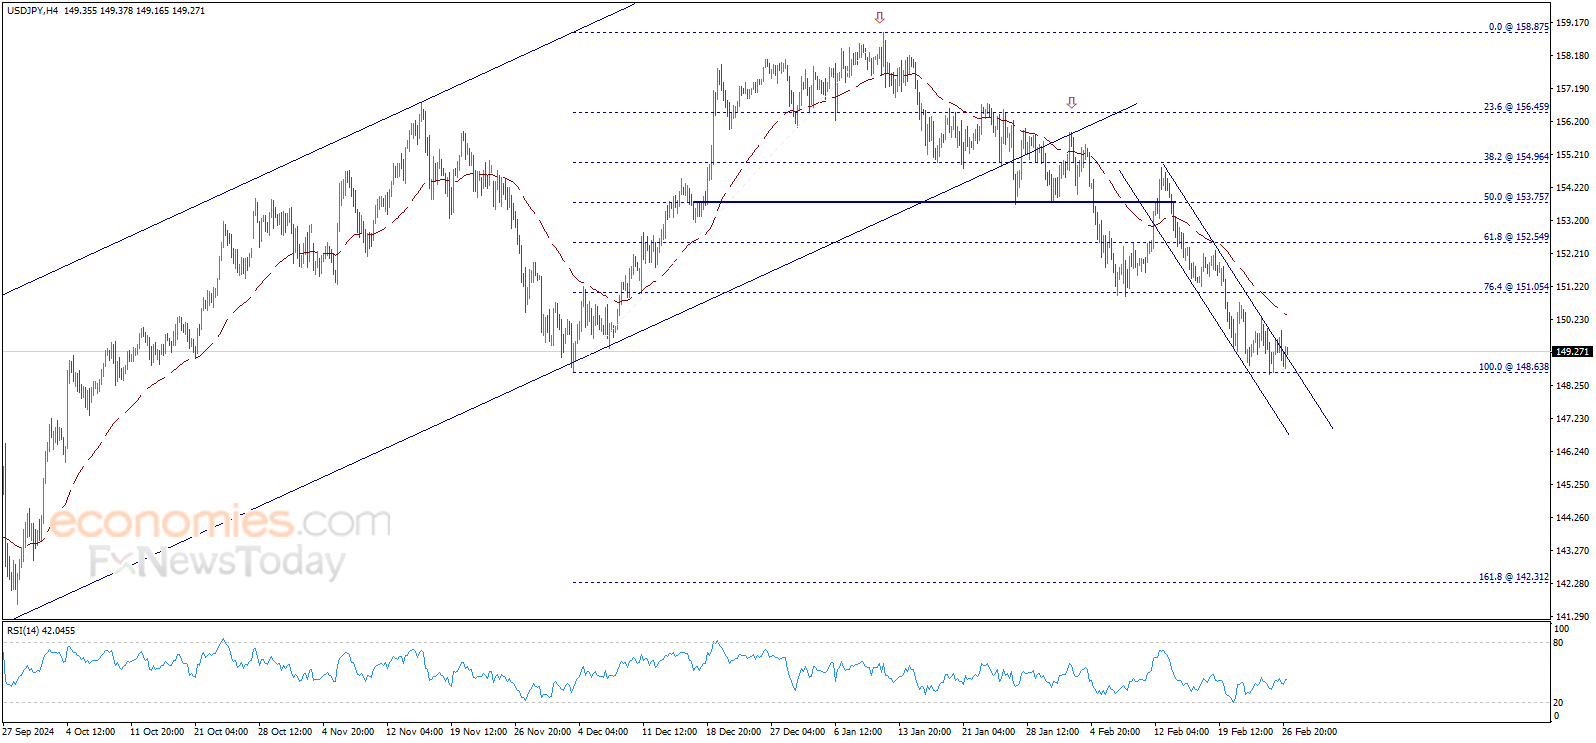
The dollar-yen pair breaks important support levels. So, be sure to exploit the performance to think about new buying opportunities, but without risk.
During today’s session, Thursday, and through stock trading platforms. Japan’s Nikkei 225 index rose 0.3% to close at 38,256, while the broader Topix index gained 0.73% to 2,736. Furthermore, the performance snapped a two-day losing streak and tracked gains in Wall Street’s main indexes. The moves came after US President Donald Trump raised hopes of another one-month pause in tariffs on imports from Mexico and Canada, while also proposing 25% tariffs on European cars and other goods.
Equity investors reacted to Nvidia’s earnings report, which highlighted strong demand for chips in the growing artificial intelligence sector. In Japan, shares of Seven & I Holdings plunged 11.7% after a proposed takeover by its founding family collapsed due to financing problems. Meanwhile, Itochu shares rose 4.3% after announcing that it decided not to continue participating in the Seven & I family purchase proposal.
According to recent trading, the general trend for the USD/JPY currency pair remains bearish. Stability below the 150.00 level will continue to motivate bears to control the trend and thus prepare for stronger losses, with the closest being 148.30 and 147.00, which in turn will move technical indicators towards strong oversold levels, and I see them as buying opportunities, but without risk. Conversely, and over the same time frame, a move above the resistance level of 152.60 will be important to break the current bearish outlook for the currency pair. The USD/JPY will be affected today by the announcement of a package of important US economic releases, led by the announcement of GDP growth and weekly jobless claims, along with the US durable goods orders reading.
Not to mention the signals that may come from global central bank officials about the future of tightening or not, and the path of US tariffs.
Want to trade our USD/JPY forex analysis and predictions? Here’s a list of forex brokers in Japan to check out.
Despite platinum price surrender to the domination of the sideways bias, providing new negative closings below 983.00$ barrier supports the domination of the previously suggested bearish bias, to notice facing the MA55 by settling at 960.00$.
The price needs new negative momentum to manage to decline below the current obstacle and start targeting the previously suggested negative stations, located at 950.00$ and 941.00$.
The expected trading range for today is between 950.00$ and 970.00$
Trend forecast: Bearish
EUR/USD lost its traction and posted losses on Wednesday. The pair stays on the back foot in the early European session on Thursday and trades below 1.0500.
The table below shows the percentage change of Euro (EUR) against listed major currencies this week. Euro was the weakest against the British Pound.
| USD | EUR | GBP | JPY | CAD | AUD | NZD | CHF | |
|---|---|---|---|---|---|---|---|---|
| USD | -0.14% | -0.28% | 0.01% | 0.78% | 0.84% | 0.91% | -0.18% | |
| EUR | 0.14% | -0.23% | -0.02% | 0.74% | 0.97% | 0.87% | -0.21% | |
| GBP | 0.28% | 0.23% | 0.30% | 0.97% | 1.21% | 1.10% | 0.03% | |
| JPY | -0.01% | 0.02% | -0.30% | 0.75% | 0.90% | 0.97% | -0.10% | |
| CAD | -0.78% | -0.74% | -0.97% | -0.75% | 0.01% | 0.13% | -0.94% | |
| AUD | -0.84% | -0.97% | -1.21% | -0.90% | -0.01% | -0.11% | -1.17% | |
| NZD | -0.91% | -0.87% | -1.10% | -0.97% | -0.13% | 0.11% | -1.06% | |
| CHF | 0.18% | 0.21% | -0.03% | 0.10% | 0.94% | 1.17% | 1.06% |
The heat map shows percentage changes of major currencies against each other. The base currency is picked from the left column, while the quote currency is picked from the top row. For example, if you pick the Euro from the left column and move along the horizontal line to the US Dollar, the percentage change displayed in the box will represent EUR (base)/USD (quote).
The negative shift seen in risk mood supported the US Dollar (USD) on Wednesday and caused EUR/USD to stretch lower. Additionally, US President Donald Trump said that they are planning to impose tariffs on European imports, further weighing on the pair. He noted that they will share details on EU tariffs soon, while adding that they are likely to be 25% on autos and some other goods.
In response, “the EU will react firmly and immediately against unjustified barriers to free and fair trade, including when tariffs are used to challenge legal and non-discriminatory policies,” the European Commission said.
In the second half of the day, the US Bureau of Economic Analysis will release the second estimate of the fourth-quarter Gross Domestic Product (GDP) data. A downward revision could limit the USD’s gains with the immediate reaction and help EUR/USD find support. The US economic calendar will also feature the weekly Initial Jobless Claims data, which is forecast to edge higher to 221,000 in the week ending February 22, from 219,000 in the previous week.
Later in the American session, Trump is scheduled to hold a press conference following his meeting with British Prime Minister Keir Starmer.
EUR/USD closed the last 4-hour candle below the 20-period and the 50-period Simple Moving Averages (SMA) and the Relative Strength Index (RSI) indicator declined slightly below 50, reflecting buyers’ reluctance.
On the downside, 1.0440 (Fibonacci 61.8% retracement of the latest downtrend) could be seen as first support before 1.0390-1.0400 (50-day SMA, Fibonacci 50% retracement) and 1.0350 (Fibonacci 38.2% retracement). Looking north, resistances could be spotted at 1.0500-1.0510 (round level, Fibonacci 78.6% retracement), 1.0535 (100-day SMA) and 1.0600 (beginning point of the downtrend).
Tariffs are customs duties levied on certain merchandise imports or a category of products. Tariffs are designed to help local producers and manufacturers be more competitive in the market by providing a price advantage over similar goods that can be imported. Tariffs are widely used as tools of protectionism, along with trade barriers and import quotas.
Although tariffs and taxes both generate government revenue to fund public goods and services, they have several distinctions. Tariffs are prepaid at the port of entry, while taxes are paid at the time of purchase. Taxes are imposed on individual taxpayers and businesses, while tariffs are paid by importers.
There are two schools of thought among economists regarding the usage of tariffs. While some argue that tariffs are necessary to protect domestic industries and address trade imbalances, others see them as a harmful tool that could potentially drive prices higher over the long term and lead to a damaging trade war by encouraging tit-for-tat tariffs.
During the run-up to the presidential election in November 2024, Donald Trump made it clear that he intends to use tariffs to support the US economy and American producers. In 2024, Mexico, China and Canada accounted for 42% of total US imports. In this period, Mexico stood out as the top exporter with $466.6 billion, according to the US Census Bureau. Hence, Trump wants to focus on these three nations when imposing tariffs. He also plans to use the revenue generated through tariffs to lower personal income taxes.
JM Smucker raised its annual profit forecast after higher product prices, especially for coffee, helped the Uncrustables sandwich maker beat market estimates for quarterly earnings.
Like other packaged food companies, JM Smucker has been raising prices to combat growing costs of raw materials such as coffee.
That boosted the company’s third-quarter gross margin to 40.2% from 36.9% last year.
It now expects annual adjusted earnings per share in the range of $9.85 to $10.15, compared with the prior forecast of $9.70 to $10.10.
The company’s net sales in the domestic retail coffee segment – its biggest revenue generator – rose 2% in the quarter, compared with a 1% decline last year. The increase was primarily driven by higher prices for its Folgers and Café Bustelo coffee brands.
Smucker reported quarterly adjusted profit of $2.61 per share for the three months ended 31 January, above estimates of $2.37, according to data compiled by LSEG.
However, certain supply chain disruptions pulled down net sales by 2% to $2.19 billion (€2.10 billion), below expectations of $2.23 billion (€2.14 billion).
JM Smucker also lowered its annual net sales forecast. It now expects an increase of 7.25%, compared with a rise of 7.50% to 8.50% expected earlier.
The company said the forecast reflects a loss of about $100 million in contract manufacturing sales related to its divested pet food brands, compared with the prior year.
Mark Smucker, chair of the board, president and chief executive officer, stated, “Our third quarter performance reflects the continued execution of our strategy and ability to deliver positive results in a dynamic operating and consumer environment.
“Our strategy and the prioritization of our key growth platforms has enabled us to deliver a strong fiscal year to date, and we are well-positioned to deliver both top- and bottom-line growth, while increasing shareholder value over time.”
News by Reuters, additional reporting by ESM.
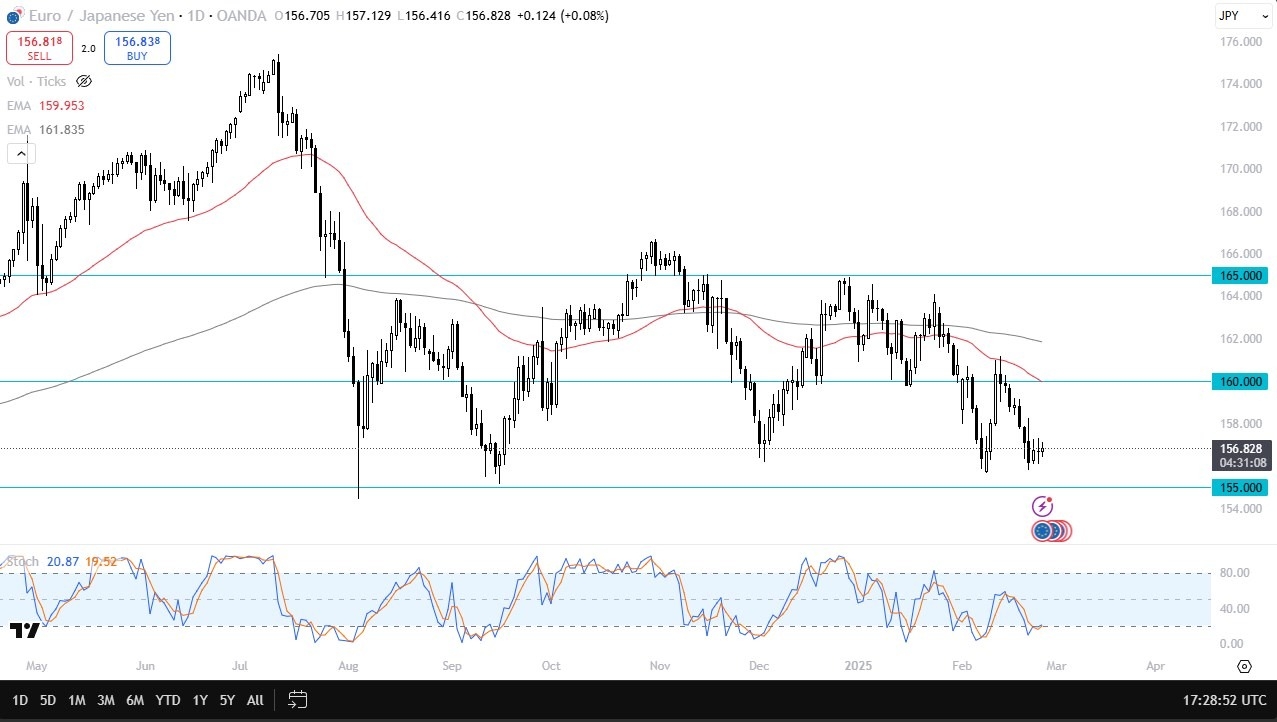
The 155 yen level underneath is a large round psychologically significant figure, and it is an area that has been very important for some time. The key question now is whether this support level will hold. Traders are likely viewing this area as a potential buying opportunity for value hunters, making a bounce possible.
However, if the price breaks below the 155 yen level, a significant decline could follow, as this area has historically provided strong support.On a move above the 158 Yen level, then I think the market goes looking at the 160 Yen level, which is where the 50 day EMA currently resides. And of course, it’s also an area where we have seen some significant action in the past.
Anything above that level then becomes really bullish. And I think you would probably see the Japanese yen struggling at that point due to the fact that the Bank of Japan, although more hawkish than they once were, the reality is that most central banks around the world still offer quite a bit more in the way of interest rates. Remember, you get paid to hang on to this EUR/JPY pair at the end of every day, although it’s not necessarily the greatest swap, but it is something and that is something that you need to pay attention to over the longer term.
In general, I think we are at a major point of inflection and that needs to be paid attention to as well. And therefore, I will be watching, but I also recognize that you do not want to jump the gun here. You want to have the market tell you which direction it’s going in before putting money into work.
Begin trading our daily forecasts and analysis. Here is a list of Forex brokers in Japan to work with.
Brent oil price provided new negative trades to approach our first waited target at 72.20$, and continues to move inside the main bearish channel that appears on the chart, which supports the chances of continuing the bearish trend on the intraday and short-term basis, supported by the EMA50.
For more: please follow us on Telegram channel
Recently, according to economic calendar data, new data from the Conference Board showed that US consumer confidence has declined significantly since Trump took office, amid a flurry of political announcements and restructuring. Data showed that confidence in January fell to its lowest level since June of last year, while the expectations index also fell to its lowest level since June. Commenting on this, HSBC analysts said: “The notable weakness in US consumer confidence data has added momentum to the idea that public sector job losses could create a turning point for the US labour market, pushing the economy into recession.”
The analysts added: “This is a very different tone from the generally upbeat nature of the US activity data, which saw the consensus GDP forecast for 2025 rise to an all-time high over the past year. The theme of American exceptionalism may have reached its peak.”
For its part, the Conference Board, commenting on its findings, said: “Pessimism about future employment prospects has deepened and reached a ten-month high.”
The deteriorating US employment outlook coincides with the job purge carried out by Elon Musk in federal institutions under the DOGE program, which seeks to cut spending and make the government more efficient. At the same time, the cost-cutting campaign raises expectations that the Trump administration will achieve its goal of curbing and then reducing the country’s growing debt burden. An early negative side effect of these efforts is weak growth and the end of the US exceptionalism trade, which is inherently deflationary.
” dir=”auto” id=”content-1686574122635″>
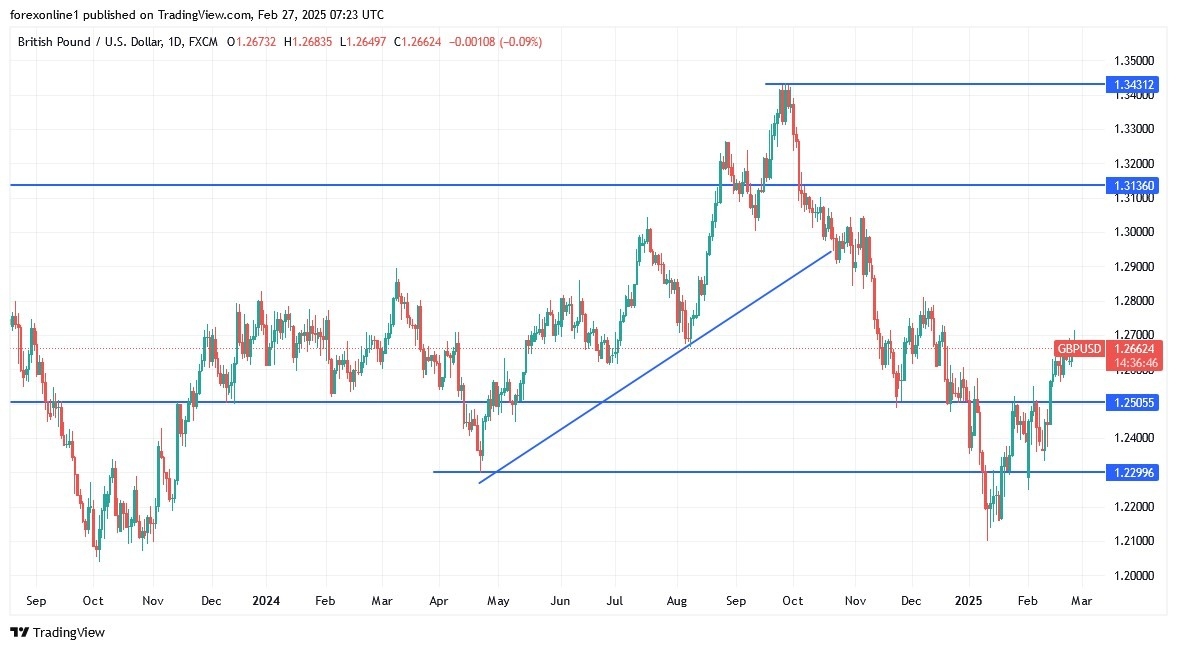
The GBP/USD pair rose 2.0% in February 2025 to reverse its trend and overcome the 1.0% decline recorded in January to end four consecutive months of declines and warn against profit-taking after its recent gains.
However, analysts at Berenberg warn that concerns about the US economy are overblown. “We do not believe that the recent negative surprise in macroeconomic data and DOGE-led job cuts justify concerns about US economic growth. We expect the economy to grow above trend in 2025, with the labour market remaining healthy despite slower employment growth,” they said in a special analysis.
They expect total layoffs led by the US Department of Government Efficiency to reach 300,000 by the end of the year, which would reduce non-farm payrolls by up to 30,000 jobs per month. Some experts believe that this should not significantly affect the US labour market. In general, if this is true, the wave of US dollar weakness will break in the coming weeks, suggesting that the GBP/USD rise has its limits.
According to recent trades and through the daily chart, the GBP/USD pair maintains positive momentum and there is now room to push towards the resistance levels of 1.2770 and 1.2820, which may be the final target for the current upward rebound. Meanwhile, the technical indicators will then move to strong overbought levels. On the other hand, and in the same time frame, the bears’ success in pushing the currency pair below the support level of 1.2580 is a strong and clear threat to the current upward correction.
The GBP/USD pair will be affected by the results of a package of US economic data, most notably the announcement of GDP growth, the number of weekly jobless claims, and US durable goods orders. Furthermore, this is in addition to investors’ sentiment regarding risk appetite or not.
Ready to trade our GBP/USD daily forecast? We’ve shortlisted the best regulated forex brokers UK in the industry for you.
Gold price is unable to hold on to the modest gains booked on Wednesday as buyers and sellers enter a tug-of-war situation early Thursday, courtesy of the uncertainty around US President Donald Trump’s tariff plans and lingering US economic concerns.
Following his Tuesday remarks that 25% tariffs on Canada and Mexico remain on track from March 4, Trump shifted his message in American trading on Wednesday, noting that steep 25% tariffs on Mexican and Canadian goods could take effect on April 2.
Trump’s conflicting messages keep the haven demand for the US Dollar (USD) alive and kicking at the expense of the Gold price. Further, the rebound in the US Treasury bond yields also check the Gold price upside.
Additionally, the end-of-the-month short-covering contributes to the recent USD upswing. The Greenback is down nearly 4% from a more than two-year high hit in January.
Upbeat results from the American artificial intelligence (AI) leader Nvidia, following Wednesday’s market close, seem to keep the broader market sentiment lifted, reflected by the 0.20% gain in the US S&P 500 futures.
The cautiously optimistic market mood reduces the demand for the US government bonds, fuelling a modest uptick in the US Treasury bond yields.
However, any downside in Gold price could be quickly bought into as markets continue to price in two interest rate cuts by the US Federal Reserve (Fed) this year in the face of mounting economic slowdown concerns. US Consumer Confidence Index declined 7 points on Tuesday, its most significant fall since August 2021, to 98.3, well below the Reuters estimate of 102.5.
Therefore, all eyes remain on the US Gross Domestic Product (GDP) second revision print for the fourth quarter of 2024 for fresh signs on the health of the economy, which could significantly impact the direction of the Fed interest rates and the US Dollar, eventually influencing the non-yielding Gold price.
The second estimate of the US GDP is expected to show a 2.3% annualized growth in Q4 2024, as seen in the advance release. Gold buyers will likely jump back in the game on a downward revision to the preliminary reading and vice-versa.
Also of note will be the US Durable Goods Orders, Pending Home Sales data and speeches from several Fed policymakers. However, US President Donald Trump’s media address later in the early American session could steal the show and reverse any Gold price reaction to the US data releases.
Gold price outlook appears more or less the same from a short-term technical perspective.
So long as the Gold price defends the 21-day Simple Moving Average (SMA) at $2,890 and the 14-day Relative Strength Index (RSI) sits above 50, the bullish potential will likely remain intact.
Gold buyers could retest the all-time highs at $2,956 on acceptance above the previous day’s high of $2,930. The next topside barriers are seen at the $2,970 resistance and the $3,000 threshold.
If sellers crack the 21-day SMA at $2,890 on a daily candlestick closing basis, the downside could open toward the February 14 low of $2,877.
The last line of defense for Gold buyers is at the $2,850 psychological barrier.
The real Gross Domestic Product (GDP) Annualized, released quarterly by the US Bureau of Economic Analysis, measures the value of the final goods and services produced in the United States in a given period of time. Changes in GDP are the most popular indicator of the nation’s overall economic health. The data is expressed at an annualized rate, which means that the rate has been adjusted to reflect the amount GDP would have changed over a year’s time, had it continued to grow at that specific rate. Generally speaking, a high reading is seen as bullish for the US Dollar (USD), while a low reading is seen as bearish.
Flow/USD currency price (FLOWUSDT) edged lower in the intraday levels, amid the dominance of the downward trend in the short term, with negative pressure due to trading below the 50-day SMA, coupled with negative signals from the RSI despite reaching oversold levels, with the price thus readying to pierce the pivotal support of $0.469.
Therefore we expect more losses for the price, provided the aforementioned support of $0.469 was breached, thus targeting the next one at $0.347.
Trend forecast today: Bearish