The main category of Forex News.
You can use the search box below to find what you need.
[wd_asp id=1]
The main category of Forex News.
You can use the search box below to find what you need.
[wd_asp id=1]
Natural gas price touched 4.186$ level yesterday followed by surrendering to stochastic intraday negativity, to notice retesting 3.950$ support line and settling above it to confirm keeping the previously suggested bullish bias.
Now, stochastic attempt to gather the positive momentum will increase the chances of rallying towards 4.240$ to form the first target for the current trades, while surpassing it might extend trades towards 4.500$ recorded high direct.
The expected trading range for today is between 3.900$ and 4.240$
Trend forecast: Bullish
Flow/USD currency price (FLOWUSDT) edged lower in the intraday levels, amid the dominance of the downward trend in the short term, with negative pressure due to trading below the 50-day SMA, coupled with negative signals from the RSI despite reaching oversold levels, with the price thus readying to pierce the pivotal support of $0.469.
Therefore we expect more losses for the price, provided the aforementioned support of $0.469 was breached, thus targeting the next one at $0.347.
Trend forecast today: Bearish
Copper price surrendered to the stability of 4.6800$ barrier to force it to activate the bearish track again by crawling below 50% Fibonacci correction level and settling near 4.4900$.
Stochastic attempt to provide the negative momentum increases the negative pressures, to expect suffering additional losses by moving towards 4.4100$ followed by reaching the MA55 at 4.3200$.
The expected trading range for today is between 4.4100$ and 4.5600$
Trend forecast: Bearish
Natural gas price touched 4.186$ level yesterday followed by surrendering to stochastic intraday negativity, to notice retesting 3.950$ support line and settling above it to confirm keeping the previously suggested bullish bias.
Now, stochastic attempt to gather the positive momentum will increase the chances of rallying towards 4.240$ to form the first target for the current trades, while surpassing it might extend trades towards 4.500$ recorded high direct.
The expected trading range for today is between 3.900$ and 4.240$
Trend forecast: Bullish
Silver (XAG/USD) struggles to capitalize on the previous day’s modest gains and oscillates in a narrow trading band, below the $32.00 round-figure mark during the Asian session on Thursday. The white metal, meanwhile, holds above the 100-day Simple Moving Average (SMA) pivotal support, currently pegged near the $31.30-$31.25 zone, or a two-week low touched on Tuesday.
From a technical perspective, the recent repeated failures to find acceptance above the $33.00 mark and the subsequent downfall favor bearish traders. Moreover, oscillators on the daily chart have just started gaining negative traction and support prospects for an extension of a one-week-old downtrend. The XAG/USD might then weaken further below the $31.00 round-figure mark, towards testing the next relevant support near the $30.25 region.
The downward trajectory could extend further towards the $30.00 psychological mark. A convincing break below the latter will suggest that the XAG/USD has topped out in the near term and pave the way for a further depreciating move towards the $29.55-$29.50 horizontal zone en route to the $29.00 round figure and December 2024 swing low, around the $28.80-$28.75 area.
On the flip side, any positive move beyond the $32.00 mark is likely to confront some resistance near the $32.40-$32.45 region. Some follow-through buying should allow the XAG/USD to make a fresh attempt toward conquering the $33.00 round figure. A sustained strength beyond the latter could lift the commodity towards the monthly swing high, around the $33.40 area touched on February 14, and aim towards reclaiming the $34.00 mark.
Silver is a precious metal highly traded among investors. It has been historically used as a store of value and a medium of exchange. Although less popular than Gold, traders may turn to Silver to diversify their investment portfolio, for its intrinsic value or as a potential hedge during high-inflation periods. Investors can buy physical Silver, in coins or in bars, or trade it through vehicles such as Exchange Traded Funds, which track its price on international markets.
Silver prices can move due to a wide range of factors. Geopolitical instability or fears of a deep recession can make Silver price escalate due to its safe-haven status, although to a lesser extent than Gold’s. As a yieldless asset, Silver tends to rise with lower interest rates. Its moves also depend on how the US Dollar (USD) behaves as the asset is priced in dollars (XAG/USD). A strong Dollar tends to keep the price of Silver at bay, whereas a weaker Dollar is likely to propel prices up. Other factors such as investment demand, mining supply – Silver is much more abundant than Gold – and recycling rates can also affect prices.
Silver is widely used in industry, particularly in sectors such as electronics or solar energy, as it has one of the highest electric conductivity of all metals – more than Copper and Gold. A surge in demand can increase prices, while a decline tends to lower them. Dynamics in the US, Chinese and Indian economies can also contribute to price swings: for the US and particularly China, their big industrial sectors use Silver in various processes; in India, consumers’ demand for the precious metal for jewellery also plays a key role in setting prices.
Silver prices tend to follow Gold’s moves. When Gold prices rise, Silver typically follows suit, as their status as safe-haven assets is similar. The Gold/Silver ratio, which shows the number of ounces of Silver needed to equal the value of one ounce of Gold, may help to determine the relative valuation between both metals. Some investors may consider a high ratio as an indicator that Silver is undervalued, or Gold is overvalued. On the contrary, a low ratio might suggest that Gold is undervalued relative to Silver.
The EURJPY pair continued to provide slow sideways trades by fluctuating near 156.20, attempting to gather the additional negative momentum to reinforce the domination of the previously suggested bearish bias.
We assure the importance of holding below 157.35 barrier, noting that succeeding to gather the negative momentum will push the price to decline towards 155.30 level, while breaking it will extend trades towards the next target at 153.90 direct.
The expected trading range for today is between 155.30 and 157.00
Trend forecast: Bearish
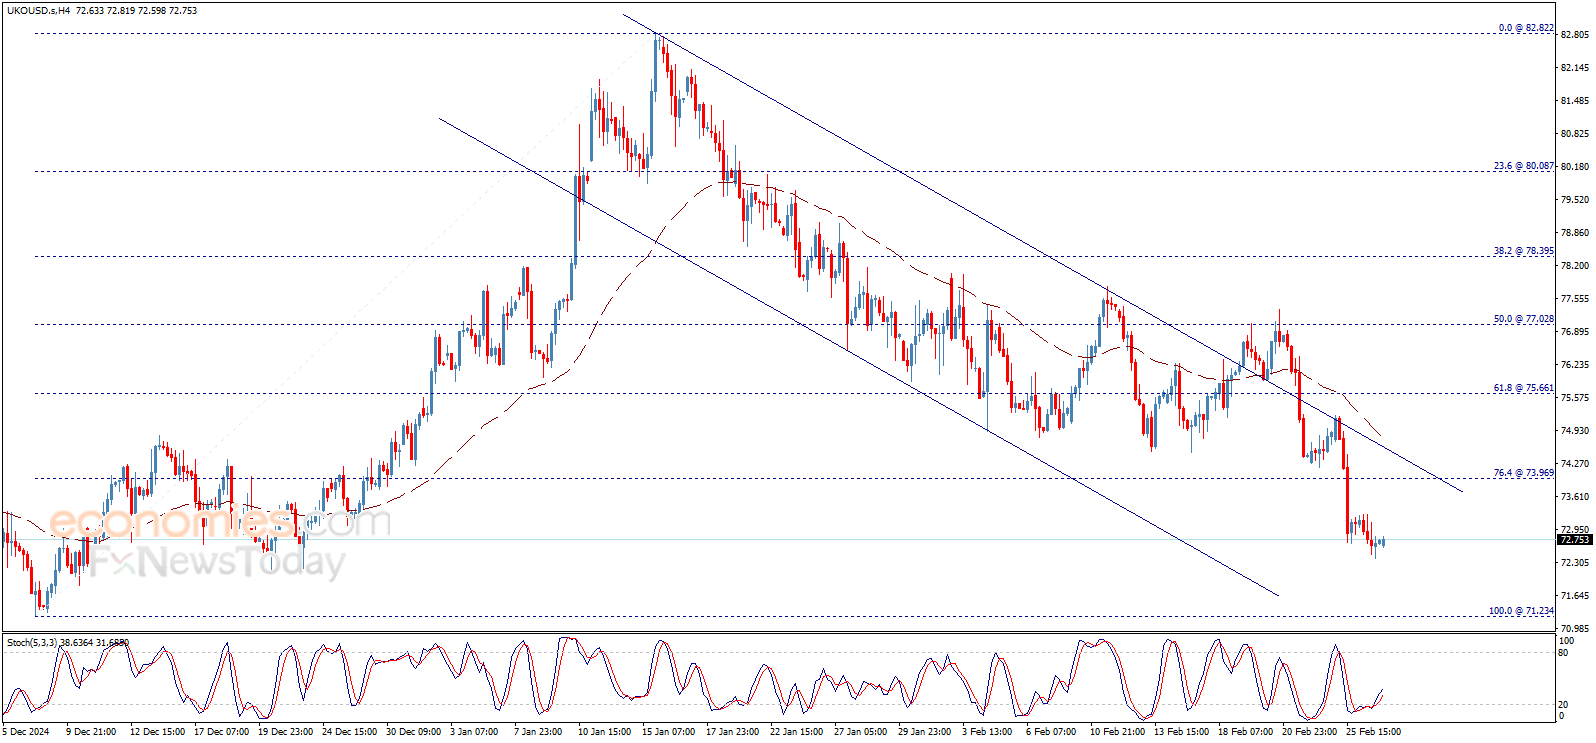
Brent oil price provided new negative trades to approach our first waited target at 72.20$, and continues to move inside the main bearish channel that appears on the chart, which supports the chances of continuing the bearish trend on the intraday and short-term basis, supported by the EMA50.
For more: please follow us on Telegram channel
Flow/USD currency price (FLOWUSDT) edged lower in the intraday levels, amid the dominance of the downward trend in the short term, with negative pressure due to trading below the 50-day SMA, coupled with negative signals from the RSI despite reaching oversold levels, with the price thus readying to pierce the pivotal support of $0.469.
Therefore we expect more losses for the price, provided the aforementioned support of $0.469 was breached, thus targeting the next one at $0.347.
Trend forecast today: Bearish
Gold price (XAU/USD) trades with mild gains around $2,920 during the early Asian session on Thursday. Trade tensions and economic uncertainty continue to drive demand for safe-haven assets like Gold.
Late Wednesday, US President Donald Trump reiterated his insistence on 25% tariffs on Canada and Mexico, as well as adding the European Union (EU) to the mixed list of countries from which he will penalize US consumers for importing. Trump added that tariffs on Canada and Mexico will go into effect on April 2.
Market players will closely watch the developments surrounding further Trump’s tariff policies. The tariff uncertainty could boost the safe-haven flows, benefiting the precious metal.
On the other hand, Trump’s plans for higher tariffs have raised inflation worries at the US Federal Reserve (Fed), which might convince the US central bank to keep interest rates higher for longer. This, in turn, might cap the upside for the precious metal as higher interest rates tarnish non-yielding gold’s appeal.
Additionally, analysts suggest that the pullback is part of a normal profit-taking cycle, with long-term bullish remains in place. “We continue to see an overall upward trend,” said David Meger, director of metals trading at High Ridge Futures. “This appears to be routine profit-booking rather than a shift in sentiment,” Meger added.
Gold has played a key role in human’s history as it has been widely used as a store of value and medium of exchange. Currently, apart from its shine and usage for jewelry, the precious metal is widely seen as a safe-haven asset, meaning that it is considered a good investment during turbulent times. Gold is also widely seen as a hedge against inflation and against depreciating currencies as it doesn’t rely on any specific issuer or government.
Central banks are the biggest Gold holders. In their aim to support their currencies in turbulent times, central banks tend to diversify their reserves and buy Gold to improve the perceived strength of the economy and the currency. High Gold reserves can be a source of trust for a country’s solvency. Central banks added 1,136 tonnes of Gold worth around $70 billion to their reserves in 2022, according to data from the World Gold Council. This is the highest yearly purchase since records began. Central banks from emerging economies such as China, India and Turkey are quickly increasing their Gold reserves.
Gold has an inverse correlation with the US Dollar and US Treasuries, which are both major reserve and safe-haven assets. When the Dollar depreciates, Gold tends to rise, enabling investors and central banks to diversify their assets in turbulent times. Gold is also inversely correlated with risk assets. A rally in the stock market tends to weaken Gold price, while sell-offs in riskier markets tend to favor the precious metal.
The price can move due to a wide range of factors. Geopolitical instability or fears of a deep recession can quickly make Gold price escalate due to its safe-haven status. As a yield-less asset, Gold tends to rise with lower interest rates, while higher cost of money usually weighs down on the yellow metal. Still, most moves depend on how the US Dollar (USD) behaves as the asset is priced in dollars (XAU/USD). A strong Dollar tends to keep the price of Gold controlled, whereas a weaker Dollar is likely to push Gold prices up.
If support remains above $3.91, natural gas may rise. Although a breakout above today’s high will show strength, an advance above Tuesday’s high at $4.19 would be a clearer bullish sign. Nonetheless, natural gas would be rising into a potential resistance zone that stopped the last two advances at $4.37 and $4.48, respectively. The rising internal trendline marks dynamic support for the uptrend and a bearish signal would be indicated on a decisive drop below that line.
Moreover, it would increase the risk that this week’s low of $3.91 fails as support and the price of natural gas goes down further. Since resistance was seen at the top of a large rising trend channel in the current advance and for the prior swing high, there is the possibility that the next lower trendline is eventually tested as support.
Either way, that possibility could lead to a notable bearish correction towards lower potential support levels. It is notable that since the 50-Day MA was reclaimed two weeks ago and there has not yet been a pullback to test the 50-Day line as support. That makes the 50-Day MA around $4.69 a potential target. But there are other price levels near the 50-Day line, which can be considered as well.
Although the 50% retracement at $3.73 is the next lower target if natural gas falls below $3.91, lower price levels converge between the 50% retracement and the 61.8% Fibonacci retracement level at $3.56. The 50-Day MA is included within that price area, as well as the 20-Day MA at $3.33, plus a weekly low at $3.55.
For a look at all of today’s economic events, check out our economic calendar.