The main category of Forex News.
You can use the search box below to find what you need.
[wd_asp id=1]
The main category of Forex News.
You can use the search box below to find what you need.
[wd_asp id=1]
If support remains above $3.91, natural gas may rise. Although a breakout above today’s high will show strength, an advance above Tuesday’s high at $4.19 would be a clearer bullish sign. Nonetheless, natural gas would be rising into a potential resistance zone that stopped the last two advances at $4.37 and $4.48, respectively. The rising internal trendline marks dynamic support for the uptrend and a bearish signal would be indicated on a decisive drop below that line.
Moreover, it would increase the risk that this week’s low of $3.91 fails as support and the price of natural gas goes down further. Since resistance was seen at the top of a large rising trend channel in the current advance and for the prior swing high, there is the possibility that the next lower trendline is eventually tested as support.
Either way, that possibility could lead to a notable bearish correction towards lower potential support levels. It is notable that since the 50-Day MA was reclaimed two weeks ago and there has not yet been a pullback to test the 50-Day line as support. That makes the 50-Day MA around $4.69 a potential target. But there are other price levels near the 50-Day line, which can be considered as well.
Although the 50% retracement at $3.73 is the next lower target if natural gas falls below $3.91, lower price levels converge between the 50% retracement and the 61.8% Fibonacci retracement level at $3.56. The 50-Day MA is included within that price area, as well as the 20-Day MA at $3.33, plus a weekly low at $3.55.
For a look at all of today’s economic events, check out our economic calendar.
Following a slide towards $2,891 right after Wall Street’s opening, Gold price regained the $2,900 mark and trades around $2,910 as the United States (US) President Donald Trump offers a press conference.
The US Dollar (USD) spent the day within familiar levels, seesawing between gains and losses, slightly firmer across the FX board throughout the first half of the day amid a risk-averse environment. An improved mood, however, is weighing on the American currency, as the rally in government bonds stalled and yields recovered some of yesterday’s losses. The 10-year Treasury note currently offers 4.30%, up 2 basis points (bps) in the day.
Market players shrugged off discouraging US macroeconomic data released on Tuesday, as Consumer Confidence plummeted according to the CB monthly survey. Yet, at the same time, investors stand on their toes ahead of trade-related headlines. The US government is not only working with tariffs but also with potential rate mineral deals with Russia and Ukraine.
Looking ahead, the US will publish next Friday the January Personal Consumption Expenditures (PCE) Price Index, the Federal Reserve’s (Fed) favorite inflation gauge. Annual inflation, as measured by the PCE index, is foreseen at 2.5%, down from the 2.6% posted in December, while the core reading is also seen declining, from 2.8% to 2.6%. Such figures should be seen as good news and revive speculation the Fed could deliver a rate cut in the first semester of the year.
From a technical point of view, the XAU/USD pair’s daily chart shows buyers are still taking their chances on dips. The pair bounced from around a firmly bullish 20 Simple Moving Average (SMA) which extends its advance beyond also bullish 100 and 200 SMAs. At the same time, technical indicators have pared their corrective slides from overbought levels and stabilized above their midlines, supporting the dominant bullish trend.
The near-term picture, however, shows a limited bullish potential. In the 4-hour chart, XAU/USD recovered twice from intraday dips below a bullish 100 SMA but remains below a mildly bearish 20 SMA. Finally, technical indicators remain below their midlines, although recovering modestly, not enough to anticipate additional gains. Gold needs to run past 2,936.20 to recover its near-term bullish poise.
Support levels: 2,903.80 2,879.95 2,863.60
Resistance levels: 2,921.50 2,636.20 2,949.45
USD to YEN forecast: the outlook for the USD to JPY currency pair is influenced by various economic factors, technical indicators, and market sentiment.
The USD/JPY currency pair is one of the most traded pairs in the foreign exchange market, reflecting the economic dynamics between the United States and Japan. As investors seek to understand the future trajectory of this pair, several factors come into play, including economic indicators, monetary policies, and geopolitical developments. This analysis provides a comprehensive outlook on the USD vs. Yen.
In recent months, the USD/JPY pair has exhibited significant volatility, largely driven by shifts in economic data and central bank policies. The pair has approached critical levels, notably the psychological barrier of 150.00, which has proven challenging to maintain. Recent movements indicate a rebound toward 149.50, primarily influenced by the strengthening US Dollar and rising US Treasury yields.
Resistance Levels: The 150.00 mark remains a key resistance level. A sustained breach above this level could signal further strength for the Dollar.
Support Levels: On the downside, support is seen around the 148.65 level. A break below this could trigger further declines, potentially targeting 147.20.
Economic Influences
US Economic Indicators
The performance of the USD is heavily influenced by various economic indicators. Recent data points, such as employment numbers, inflation rates, and consumer spending, play a crucial role in shaping market sentiment.
Inflation and Interest Rates: The Federal Reserve’s monetary policy decisions are closely tied to inflation data. If inflation remains high, the Fed may continue to implement interest rate hikes, which typically bolster the Dollar. Conversely, signs of weakening inflation could lead to a more dovish stance, weakening the USD.
Service Sector Activity: Recent declines in service sector activity have raised concerns about the overall strength of the US economy. If the trend continues, it may prompt the Fed to reconsider its tightening measures, impacting the Dollar’s strength against the Yen.
Japan’s economy also plays a vital role in the USD/JPY outlook. The Bank of Japan (BoJ) has historically maintained a loose monetary policy, but recent shifts in inflation dynamics are prompting discussions about potential policy adjustments.
Inflation Trends: Japan has been experiencing rising inflation, prompting speculation about a possible tightening of monetary policy by the BoJ. If the central bank decides to raise interest rates, it could enhance the Yen’s attractiveness to investors, leading to a stronger Yen against the Dollar.
Economic Growth: Japan’s GDP growth rates and industrial production figures are critical indicators. Strong economic performance could support the Yen, while any signs of weakness may lead to further Yen depreciation.
Technical Analysis
Technical indicators provide valuable insights into potential price movements for the USD/JPY pair. Traders often look at patterns, trends, and key indicators to make informed decisions.
Moving Averages: The 50-day and 200-day moving averages are commonly used to identify trends. A crossover of these averages may indicate a change in momentum. Currently, if the price remains below these averages, it could signal a bearish outlook.
Relative Strength Index (RSI): The RSI is a momentum oscillator that measures the speed and change of price movements. An RSI above 70 indicates overbought conditions, while below 30 indicates oversold conditions. A high RSI could suggest a potential pullback in the USD/JPY pair.
Price Patterns
Patterns such as head and shoulders, flags, and triangles can indicate potential reversals or continuations. Traders should monitor these patterns for clues on future price movements.
Geopolitical Factors
Geopolitical developments can significantly impact currency pairs, including USD/JPY. Factors such as trade tensions, military conflicts, and diplomatic relations can create volatility and influence investor sentiment.
US-China Relations
The relationship between the US and China remains tense, with trade wars and tariffs impacting global markets. Any significant developments in this area could influence the USD’s performance, as economic uncertainties often lead investors to seek safe-haven currencies like the Yen.
Regional Stability
Japan’s geopolitical landscape, including its relationship with neighboring countries and its role in regional security, can also affect the Yen’s value. Increased tensions in the Asia-Pacific region may lead to a stronger Yen as investors seek safety.
Future Outlook
The future outlook for the USD/JPY pair is shaped by a combination of economic indicators, technical analysis, and geopolitical factors. Here are some key considerations:
Short-Term Projections
In the short term, the USD/JPY pair may experience continued volatility as market participants react to upcoming economic data releases and central bank announcements. If the Fed signals a more hawkish stance, the Dollar could strengthen, pushing the pair higher. Conversely, any dovish signals may lead to a pullback.
Long-Term Projections
Looking further ahead, the trajectory of the USD/JPY pair will depend on the relative strength of the US and Japanese economies. If the US economy demonstrates resilience and inflation remains elevated, the Dollar may maintain its strength. However, if Japan’s economy shows signs of recovery and the BoJ shifts toward tightening, the Yen could appreciate against the Dollar.
In conclusion, the outlook for the USD/JPY currency pair is multifaceted, influenced by economic indicators, technical analysis, and geopolitical developments. As the market navigates these variables, investors should stay informed and monitor key levels, economic data, and central bank policies to make well-informed trading decisions. The interplay between the US and Japanese economies will continue to shape the future of this vital currency pair.
When considering shares, indices, forex (foreign exchange) and commodities for trading and price predictions, remember that trading CFDs involves a significant degree of risk and could result in capital loss.
Past performance is not indicative of any future results. This information is provided for informative purposes only and should not be construed to be investment advice.
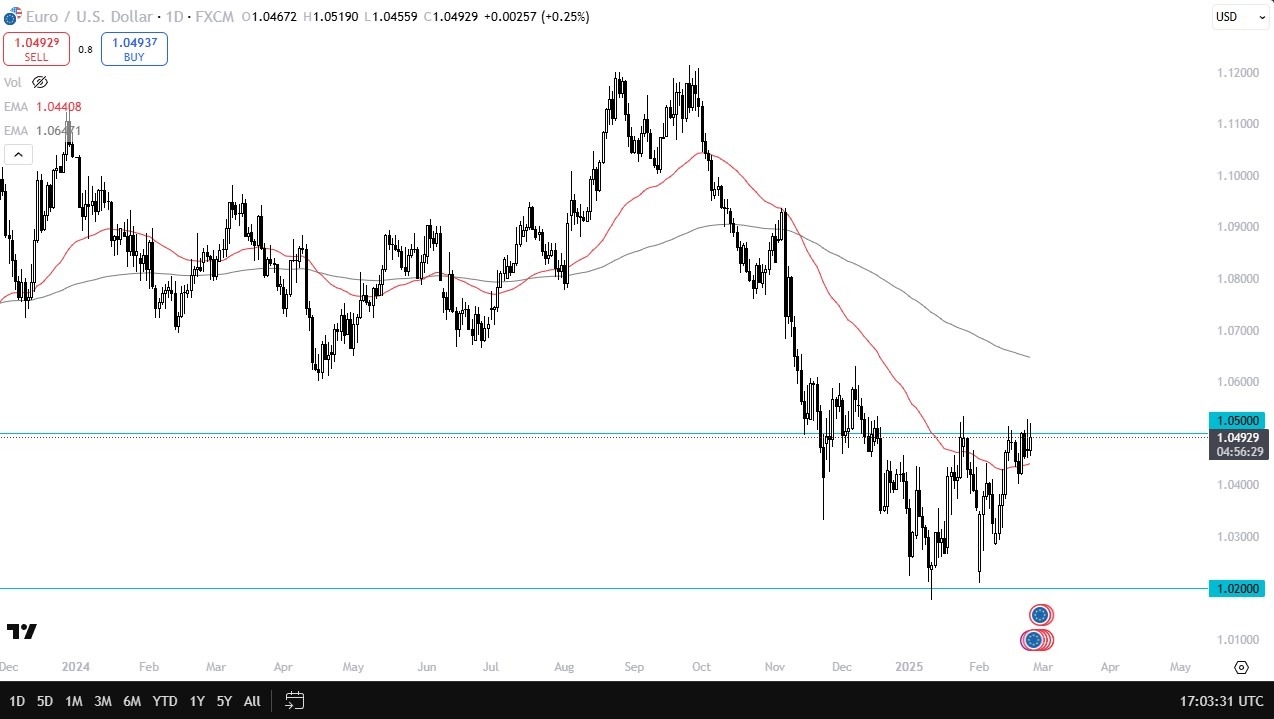
The technical analysis for the pair EUR/USD continues to look sideways, but short term bullish. The area that we are testing has been important more than once, as the barrier could very well stretch all the way to the 1.06 level above. The 200 Day EMA is roughly in that area as well, as this is a situation that would cause a lot of attention in the markets and the financial websites.

On the other hand, if the market were to break below the 50 Day EMA, then the market could drop to the 1.03 level, possibility even the 1.02 level. This is an area that will continue to be an area where a lot of people are watching, as a break below there would be a sign that the euro could very well drop to the parity level.
In that situation, the US dollar would probably be getting stronger against almost everything as far as the currencies are concerned. This would be a market wide phenomenon, and you would obviously be aware of this.
On the other hand, if we were to break above that crucial 1.06 level, and the 200 Day EMA, I would be looking at the EUR/USD pair travelling all the way to the 1.10 level, an area that has been important more than once as well. Ultiamtely, I think this isn’t likely, but it is a potential possibility if things line up correctly.
Ready to trade our daily Forex forecast? Here’s a list of some of the top forex brokers in Europe to check out.
Boeing’s company’s stock price (BA) fell in the intraday levels while trying to gather positive momentum to rise anew, amid the dominance of the upward correctional trend in the short term, while leaning on the support of the 50-day SMA, as the RSI reached oversold levels compared to the stock’s movements, hinting at positive divergence.
Therefore we expect the stock to return higher, targeting the pivotal resistance of $192.63, provided the support of $173.13 holds on.
Trend forecast today: Likely Bullish
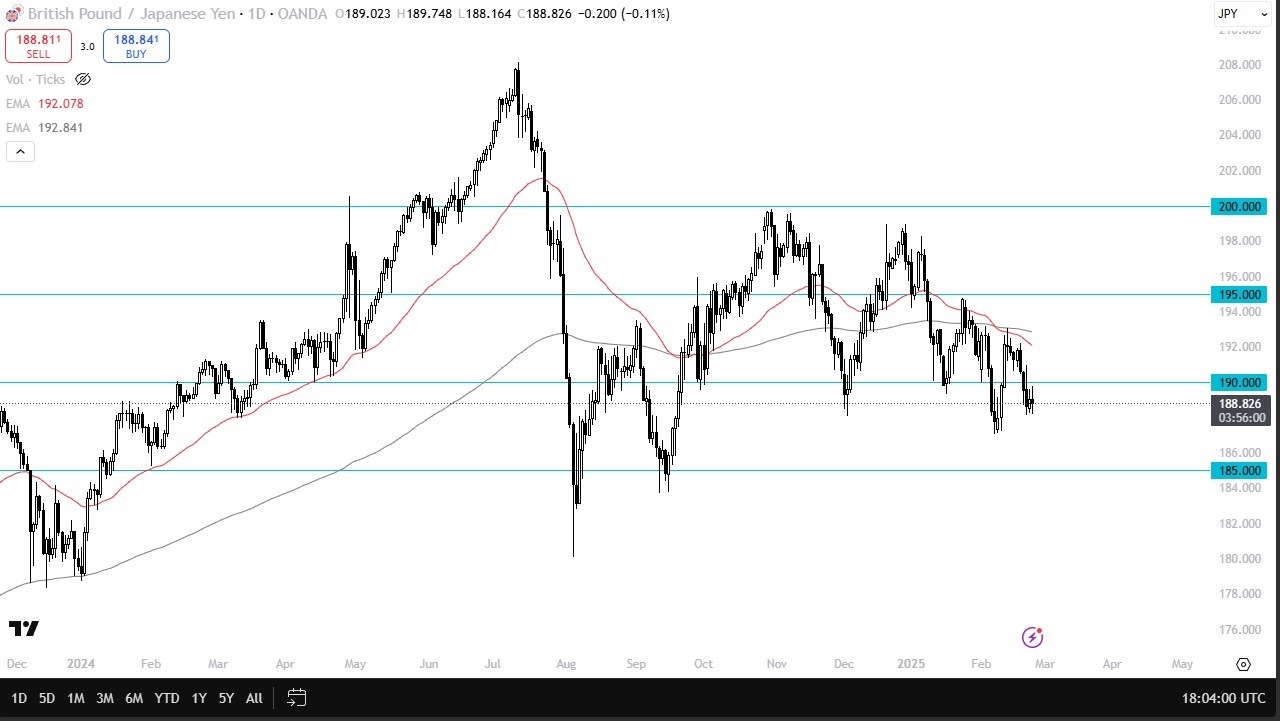
The question of course is going to be where does the market go from here? What is that bigger move going to look like? If we can break above the 190 yen level, then I become bullish, at least for the time being, and the market could go looking at the 50 day EMA right around the 192 yen level. On the other hand, if we break down below the lows of the last couple of days, basically 188 yen, we could go down to the 185 yen level as well.
This is a market that I think is going to be very sensitive to everything else that’s going on around the world right now, which is basically chaos. So, I think you continue to see a lot of volatility, but what you need to see is some type of impulsive candlestick that you can follow. For example, a nice big positive candlestick that closes above 190 yen would do wonders for my confidence of the market recapturing the upside. Of course, I can say the same thing if we break down and get a significantly negative candlestick that breaks the 188 yen level. Short-term traders will probably look at this through a range-bound lens, but those of us who are a little bit more like swing traders it’s a market that’s building up inertia. You just want to follow whatever direction it breaks.
Begin trading our daily forecasts and analysis. Here is a list of Forex brokers in Japan to work with.
Silver price (XAG/USD) halts its three-day losing streak, trading near $31.80 per troy ounce during the European session on Wednesday. Technical analysis on the daily chart indicates a developing bearish outlook, with the metal trading below the lower boundary of its ascending channel pattern.
Silver price also trades below the nine-day and 14-day Exponential Moving Averages (EMAs), signaling weakened short-term momentum. However, the 14-day Relative Strength Index (RSI) has bounced back above the 50 mark, indicating that bullish sentiment remains intact. Upcoming price action will provide clearer insight into the price’s directional trend.
To the downside, the XAG/USD pair may find initial support at the psychological level of $31.00. A decisive break below this mark could strengthen the bearish outlook, potentially pushing Silver’s price toward the five-month low of $28.74, last seen on December 19.
Silver price could encounter initial resistance at the 14-day EMA around $32.12, followed by the nine-day EMA near $32.19. A move back into the ascending channel pattern would restore the bullish outlook, potentially pushing the pair toward the four-month high of $33.40. A breakout above this level would strengthen the bullish bias, opening the door for the metal price to test the ascending channel’s upper boundary near $35.00.
Silver is a precious metal highly traded among investors. It has been historically used as a store of value and a medium of exchange. Although less popular than Gold, traders may turn to Silver to diversify their investment portfolio, for its intrinsic value or as a potential hedge during high-inflation periods. Investors can buy physical Silver, in coins or in bars, or trade it through vehicles such as Exchange Traded Funds, which track its price on international markets.
Silver prices can move due to a wide range of factors. Geopolitical instability or fears of a deep recession can make Silver price escalate due to its safe-haven status, although to a lesser extent than Gold’s. As a yieldless asset, Silver tends to rise with lower interest rates. Its moves also depend on how the US Dollar (USD) behaves as the asset is priced in dollars (XAG/USD). A strong Dollar tends to keep the price of Silver at bay, whereas a weaker Dollar is likely to propel prices up. Other factors such as investment demand, mining supply – Silver is much more abundant than Gold – and recycling rates can also affect prices.
Silver is widely used in industry, particularly in sectors such as electronics or solar energy, as it has one of the highest electric conductivity of all metals – more than Copper and Gold. A surge in demand can increase prices, while a decline tends to lower them. Dynamics in the US, Chinese and Indian economies can also contribute to price swings: for the US and particularly China, their big industrial sectors use Silver in various processes; in India, consumers’ demand for the precious metal for jewellery also plays a key role in setting prices.
Silver prices tend to follow Gold’s moves. When Gold prices rise, Silver typically follows suit, as their status as safe-haven assets is similar. The Gold/Silver ratio, which shows the number of ounces of Silver needed to equal the value of one ounce of Gold, may help to determine the relative valuation between both metals. Some investors may consider a high ratio as an indicator that Silver is undervalued, or Gold is overvalued. On the contrary, a low ratio might suggest that Gold is undervalued relative to Silver.
GBP/USD benefited from the selling pressure surrounding the US Dollar (USD) on Tuesday and ended the day in the positive territory. The pair stays in a consolidation phase near 1.2650 in the European session on Wednesday.
The table below shows the percentage change of British Pound (GBP) against listed major currencies this week. British Pound was the strongest against the Canadian Dollar.
| USD | EUR | GBP | JPY | CAD | AUD | NZD | CHF | |
|---|---|---|---|---|---|---|---|---|
| USD | -0.33% | -0.20% | 0.07% | 0.79% | 0.48% | 0.60% | -0.34% | |
| EUR | 0.33% | 0.04% | 0.22% | 0.93% | 0.80% | 0.74% | -0.21% | |
| GBP | 0.20% | -0.04% | 0.25% | 0.89% | 0.76% | 0.70% | -0.25% | |
| JPY | -0.07% | -0.22% | -0.25% | 0.72% | 0.49% | 0.61% | -0.34% | |
| CAD | -0.79% | -0.93% | -0.89% | -0.72% | -0.36% | -0.19% | -1.13% | |
| AUD | -0.48% | -0.80% | -0.76% | -0.49% | 0.36% | -0.06% | -1.00% | |
| NZD | -0.60% | -0.74% | -0.70% | -0.61% | 0.19% | 0.06% | -0.94% | |
| CHF | 0.34% | 0.21% | 0.25% | 0.34% | 1.13% | 1.00% | 0.94% |
The heat map shows percentage changes of major currencies against each other. The base currency is picked from the left column, while the quote currency is picked from the top row. For example, if you pick the British Pound from the left column and move along the horizontal line to the US Dollar, the percentage change displayed in the box will represent GBP (base)/USD (quote).
The USD weakened against its major rivals in the American session on Tuesday as the benchmark 10-year US Treasury bond yield dropped to its lowest level in over two months below 4.3%. US Treasury Secretary Scott Bessent reiterated that US President Donald Trump’s administration aims to reduce spending, while easing monetary policy and lowering Treasury yields at the same time.
Meanwhile, Trump’s trade adviser, Peter Navarro, told CNBC on Tuesday that tariff negotiations with Canada and Mexico were ongoing and added that they are planning to set a reciprocal tariff for digital services tax.
In the early American session, Trump is scheduled to hold a press conference. In the absence of high-impact data releases, market participants will pay close attention to the action in the US bond and stock markets. At the time of press, US stock index futures were up between 0.3% and 0.8%, while the 10-year US T-bond yield was holding steady slightly above 4.3%.
In case Wall Street’s main indexes keep the bullish tone after the opening bell, GBP/USD could gain traction. If, however, US yields extend the rebound, the pair’s upside could remain capped.
The Relative Strength Index (RSI) indicator on the 4-hour chart holds above 50, suggesting that sellers struggle to take control of the pair’s action.
The 100-day Simple Moving Average (SMA) aligns as a pivot level at 1.2650. Once GBP/USD makes a daily close above this level and starts using it as support, technical buyers could remain interested. In this scenario, 1.2700-1.2710 (round level, static level) and 1.2750 (static level) could be seen as next resistance levels.
On the downside, supports could be spotted at 1.2600 (static level, round level), 1.2540 (100-period SMA on the 4-hour chart, Fibonacci 61.8% retracement of the latest downtrend) and 1.2500 (round level, static level).
The Pound Sterling (GBP) is the oldest currency in the world (886 AD) and the official currency of the United Kingdom. It is the fourth most traded unit for foreign exchange (FX) in the world, accounting for 12% of all transactions, averaging $630 billion a day, according to 2022 data. Its key trading pairs are GBP/USD, also known as ‘Cable’, which accounts for 11% of FX, GBP/JPY, or the ‘Dragon’ as it is known by traders (3%), and EUR/GBP (2%). The Pound Sterling is issued by the Bank of England (BoE).
The single most important factor influencing the value of the Pound Sterling is monetary policy decided by the Bank of England. The BoE bases its decisions on whether it has achieved its primary goal of “price stability” – a steady inflation rate of around 2%. Its primary tool for achieving this is the adjustment of interest rates. When inflation is too high, the BoE will try to rein it in by raising interest rates, making it more expensive for people and businesses to access credit. This is generally positive for GBP, as higher interest rates make the UK a more attractive place for global investors to park their money. When inflation falls too low it is a sign economic growth is slowing. In this scenario, the BoE will consider lowering interest rates to cheapen credit so businesses will borrow more to invest in growth-generating projects.
Data releases gauge the health of the economy and can impact the value of the Pound Sterling. Indicators such as GDP, Manufacturing and Services PMIs, and employment can all influence the direction of the GBP. A strong economy is good for Sterling. Not only does it attract more foreign investment but it may encourage the BoE to put up interest rates, which will directly strengthen GBP. Otherwise, if economic data is weak, the Pound Sterling is likely to fall.
Another significant data release for the Pound Sterling is the Trade Balance. This indicator measures the difference between what a country earns from its exports and what it spends on imports over a given period. If a country produces highly sought-after exports, its currency will benefit purely from the extra demand created from foreign buyers seeking to purchase these goods. Therefore, a positive net Trade Balance strengthens a currency and vice versa for a negative balance.
Oil Price Forecast Turns Bullish Amid U.S. Inventory Surprise
Oil markets got a jolt this week as prices ticked up in Asian trading on Wednesday, February 25, 2025. The rally came after a surprise drop in U.S. oil inventories, offering a glimmer of hope to traders who’ve been watching prices slide to two-month lows. Brent oil futures climbed 0.3% to $73.27 a barrel, while West Texas Intermediate (WTI) crude futures gained 0.4% to $69.17 a barrel. This uptick follows a rough patch—both contracts shed about $2 on Tuesday alone, rattled by shaky economic signals from the U.S. and Germany.
But don’t pop the champagne just yet. The oil price forecast remains clouded by bigger worries. A cooling global economy and threats of Trump tariffs are keeping traders on edge. Could this inventory draw signal tighter supplies ahead, or will demand fears and trade tensions drag prices back down? Let’s unpack what’s driving the oil price forecast today and what it means for markets.
The American Petroleum Institute (API) dropped a bombshell Tuesday evening: U.S. oil inventories shrank by 0.6 million barrels for the week ending February 21. Analysts had braced for a 2.3-million-barrel build, so this unexpected draw flipped the script. It’s a small shift, sure, but in a market nursing losses, it’s enough to spark chatter about a tighter supply outlook.
Official data from the U.S. Energy Information Administration (EIA), due later today, will either confirm or contradict the API’s findings. Historically, API numbers often foreshadow EIA reports, so traders are cautiously optimistic. If the trend holds, the oil price forecast could see a short-term lift as supply concerns ease. Still, with 2024 marked by oversupply fears, this lone data point isn’t enough to rewrite the broader narrative—yet.
Zoom out, and the picture gets murkier. The oil price forecast isn’t just about barrels in storage—it’s about demand, and that’s where the trouble brews. Tuesday’s $2 price drop wasn’t random; it followed weak economic data from two heavyweights: the U.S. and Germany. In the U.S., consumer confidence took a hit in February, hinting at slower spending in a nation that drives global growth. Across the Atlantic, Germany’s GDP contracted again, signaling trouble for Europe’s biggest economy.
Why does this matter? When wallets tighten, oil demand softens. Cars stay parked, factories slow, and shipping stalls. The oil price forecast hinges on economic health, and right now, the pulse is weak. Add in Trump tariffs, and you’ve got a recipe for uncertainty that’s tough to swallow. Prices might be up today, but the market’s jittery, and for good reason.
Speaking of Trump tariffs, they’re the elephant in the room. President Donald Trump has been rattling sabers, threatening new trade barriers that could shake up global commerce. This week, he floated tariffs on copper and confirmed duties on Mexico and Canada will kick in next week. China, a massive oil importer, remains a prime target too. If Trump tariffs hit hard, they could choke China’s economy—and its thirst for crude.
The oil price forecast doesn’t like unpredictability, and Trump tariffs bring plenty of it. A trade war could slow global growth, shrink demand, and send oil prices tumbling. Tuesday’s two-month low reflects that fear. Yet, Wednesday’s rebound shows markets are still digesting the news, balancing tariff threats against supply-side surprises like the inventory draw. Traders are stuck in a tug-of-war, and the outcome’s anyone’s guess.
Let’s zoom in on the trading action. Brent oil futures expiring in April nudged up to $73.27 a barrel—a modest 0.3% gain. Meanwhile, WTI crude futures hit $69.17 a barrel, up 0.4%. These are the benchmarks investors watch, and their moves shape the oil price forecast daily. Tuesday’s $2 plunge stung, but Wednesday’s recovery suggests some resilience.
For context, Brent reflects global oil dynamics, sourced from the North Sea, while WTI tracks U.S.-centric trends. Both are futures contracts, meaning traders bet on where prices are headed—say, Brent Oil Futures’s price in April. The inventory draw boosted both, but economic headwinds and Trump tariffs could cap gains. The oil price forecast here is a tightrope walk between supply hope and demand dread.
Alt Text: A chart showing the latest oil price forecast with Brent and WTI futures rising after a U.S. inventory draw.
This week’s a big one for data nerds. Thursday brings U.S. fourth-quarter GDP numbers, a snapshot of how the world’s biggest economy fared late last year. Friday ups the ante with the PCE price index—the Federal Reserve’s go-to inflation gauge—plus German inflation figures. These releases will either fuel or douse the oil price forecast.
If GDP disappoints, expect demand worries to deepen, dragging oil prices lower. A hot PCE reading could stoke fears of tighter Fed policy, another blow to growth. German inflation, meanwhile, hints at Europe’s trajectory. The oil price forecast thrives on clarity, but these reports might just muddy the waters further. Traders are glued to their screens, and for good reason.
China’s a linchpin in this story. As the world’s top oil importer, its demand swings markets. Trump tariffs targeting Beijing could kneecap its economy, curbing crude purchases. The news of potential copper tariffs this week only amps up the pressure. If China stumbles, the oil price forecast takes a hit—fewer barrels shipped means lower prices.
But it’s not all doom. China’s been diversifying supply chains and boosting domestic production. Still, Trump tariffs loom large, and any slowdown there ripples globally. The oil price forecast can’t ignore this giant, especially with trade tensions heating up.
Step back to 2024, and oil’s had a tough go. Prices started the year with promise but slumped as supply piled up and demand softened. The API’s latest draw is a blip against that backdrop—0.6 million barrels shaved off a glut doesn’t erase months of oversupply angst. The oil price forecast for 2025 hinges on whether this week’s uptick is a turning point or a false dawn.
Trump tariffs didn’t help last year either. Threats turned into action, rattling markets and fueling economic unease. Pair that with a global growth slowdown, and you see why oil’s nursing losses. The question now: can a tighter U.S. supply outlook shift the oil price forecast, or are we stuck in a rut?
For Markets.com readers, the oil price forecast isn’t just news—it’s opportunity. Brent and WTI futures are tradable instruments, and every tick matters. A bullish forecast might mean buying in, betting on tighter supplies. A bearish one, driven by Trump tariffs or weak GDP, could signal a sell-off. Timing’s everything, and this week’s data dump will test traders’ nerves.
Oil’s volatility draws a crowd. It’s tied to inflation, currencies, and equities—when oil moves, markets feel it. The oil price forecast gives you the edge, whether you’re hedging or speculating. With Trump tariffs in play, that edge feels sharper than ever.
Beyond the U.S. and China, demand’s faltering elsewhere. Germany’s GDP woes signal a European slowdown, a red flag for oil consumption. Emerging markets, too, face headwinds as Trump tariffs threaten trade flows. The oil price forecast doesn’t live in a vacuum—global growth sets the tone.
Yet, there’s nuance. Warmer weather could cut heating oil use, while a manufacturing rebound might lift diesel demand. The oil price forecast weighs these variables, but right now, the scale tips toward caution. Economic jitters and trade friction aren’t fading anytime soon.
The U.S. inventory drop stole headlines, but supply’s a global game. OPEC’s sitting tight, with no big cuts announced. Non-OPEC producers like Canada and Brazil keep pumping, adding barrels to the mix. The oil price forecast can’t ignore this flood, even if U.S. stocks dip.
Wednesday’s API data sparked hope, but it’s a drop in the bucket—literally. A 0.6-million-barrel draw pales against yearly trends. The oil price forecast needs more than one-off surprises to turn bullish long-term. Trump tariffs could shift supply chains, too, but that’s a slow burn.
Markets run on emotion as much as data. Right now, sentiment’s split. The inventory draw offers hope—maybe supplies won’t drown prices after all. But Trump tariffs and economic gloom fuel fear, keeping bulls in check. The oil price forecast reflects this push-pull, with Wednesday’s gains a tentative step forward.
Social media’s buzzing too. Posts on X show traders debating: “Is this a dead cat bounce, or the start of something?” Sentiment’s fragile, and the oil price forecast hangs in the balance. One bad GDP print could tip it.
Let’s double-click on Trump tariffs. Copper’s in the crosshairs now, but oil’s not immune. Tariffs on Mexico and Canada, set for next week, could hike transport costs—think higher gasoline prices at the pump. China’s the big domino, though. If Trump tariffs slam its factories, crude demand drops fast.
The oil price forecast has to factor this in. Trade wars don’t just hit GDP—they hit oil directly. Look at 2018: tariffs sparked volatility, and prices yo-yoed. History says Trump tariffs mean turbulence, and 2025’s shaping up the same.
Experts are split. Some see the inventory draw as a lifeline, nudging the oil price forecast up short-term. Others warn Trump tariffs and economic data could swamp any gains. “We’re in wait-and-see mode,” one analyst told Markets.com. “Friday’s PCE could be the decider.”
Data backs both sides. Brent’s $73.27 and WTI’s $69.17 show resilience, but Tuesday’s $2 drop screams caution. The oil price forecast isn’t crystal clear—it’s a puzzle, and this week’s pieces are still falling into place.
So, where do you stand? If you’re trading Brent or WTI on Markets.com, this week’s a rollercoaster. The oil price forecast suggests upside if EIA confirms the draw and GDP holds steady. But Trump tariffs and inflation data could flip the script. Stay nimble—oil’s never dull.
Check the Brent and WTI futures pages on Markets.com for live updates. The oil price forecast evolves daily, and timing’s your edge. Whether you’re in for the long haul or a quick scalp, this market’s got room to run—or stumble.
Oil’s at a crossroads. Wednesday’s rally off a two-month low feels good, but the oil price forecast isn’t set in stone. A U.S. inventory draw offers a lifeline, yet Trump tariffs and economic jitters loom large. With GDP, PCE, and German inflation data dropping soon, clarity’s coming—fast.
For now, Brent and WTI futures are holding firm, but the oil price forecast teeters. Will supply tighten enough to lift prices, or will demand fears and trade tensions win out? Stick with Markets.com’s News section—we’ll keep you posted as the oil price forecast unfolds.
When considering shares, indices, forex (foreign exchange) and commodities for trading and price predictions, remember that trading CFDs involves a significant degree of risk and could result in capital loss.
Past performance is not indicative of any future results. This information is provided for informative purposes only and should not be construed to be investment advice.
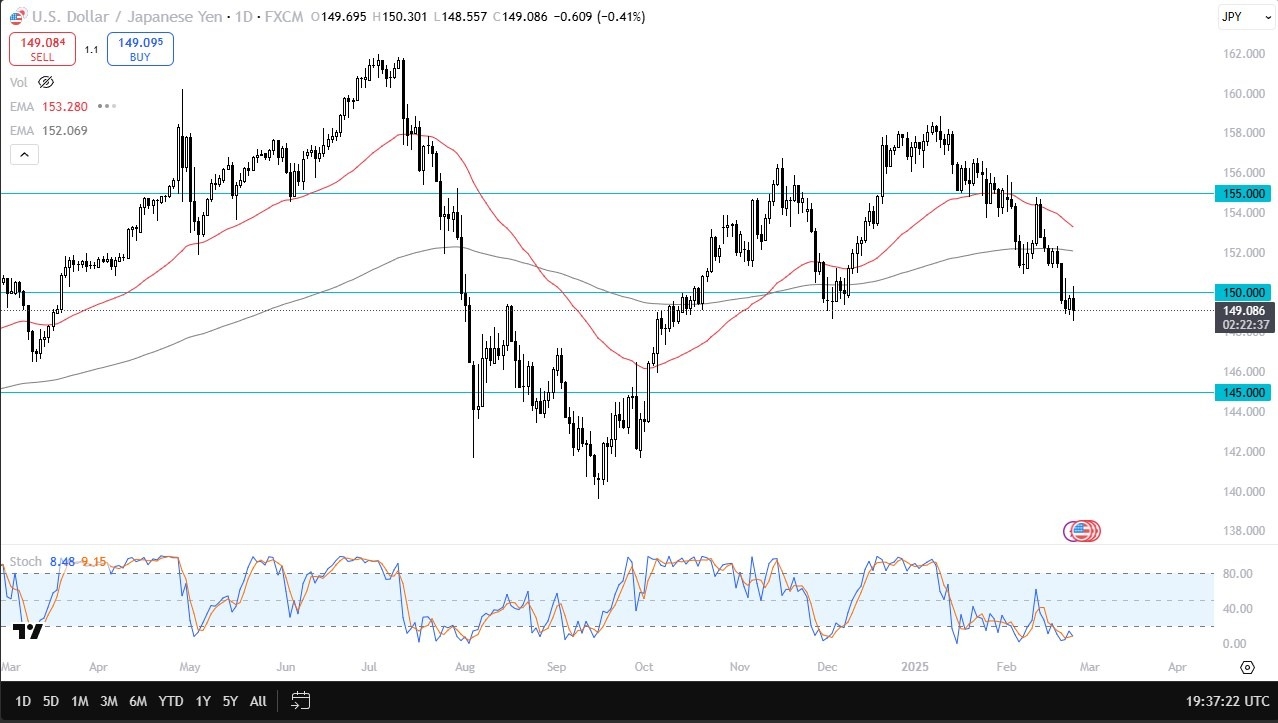
At this point, it certainly looks as if we are asking questions of the downside, but keep in mind that the interest rate differential continues to favor the US dollars. It’ll be interesting to see how this plays out. I think you’ve got a situation here where perhaps traders are looking through the prism of whether or not things can turn in the right direction as far as the interest rate differential is concerned, and we can break above the inverted hammer from Friday. I don’t know yet. This is a market that certainly looks like it is trying to find its bottom. But right now, we’re just bumping along. And I think the interest rate differential itself isn’t enough to get the market moving because everybody is freaking out about the idea of the carry trade unwinding.
That being said, if we could break above the Friday inverted hammer from last week, it opens up a move to the 152 yen level, which is where the 200 day EMA currently resides. If we break down from here, perhaps below the 148 yen level, then it opens up a move down to the 145 yen level rather quickly. That goes against the interest rate swap and of course, you have to pay at the end of every day to do that. So that’s why I’m always a little bit leery of doing this, because it does add up over time. A short-term trade works out quite nicely, but if you end up in a trend trade, it gets expensive over the longer term. As things stand right now, the Japanese are likely to be at 0.75% by the end of the year, but the Americans are probably still going to be at 4%, or perhaps even 4.25% which is part of why I’m waiting to see if we can break to the upside.
Want to trade our USD/JPY forex analysis and predictions? Here’s a list of forex brokers in Japan to check out.