The main category of Forex News.
You can use the search box below to find what you need.
[wd_asp id=1]
The main category of Forex News.
You can use the search box below to find what you need.
[wd_asp id=1]
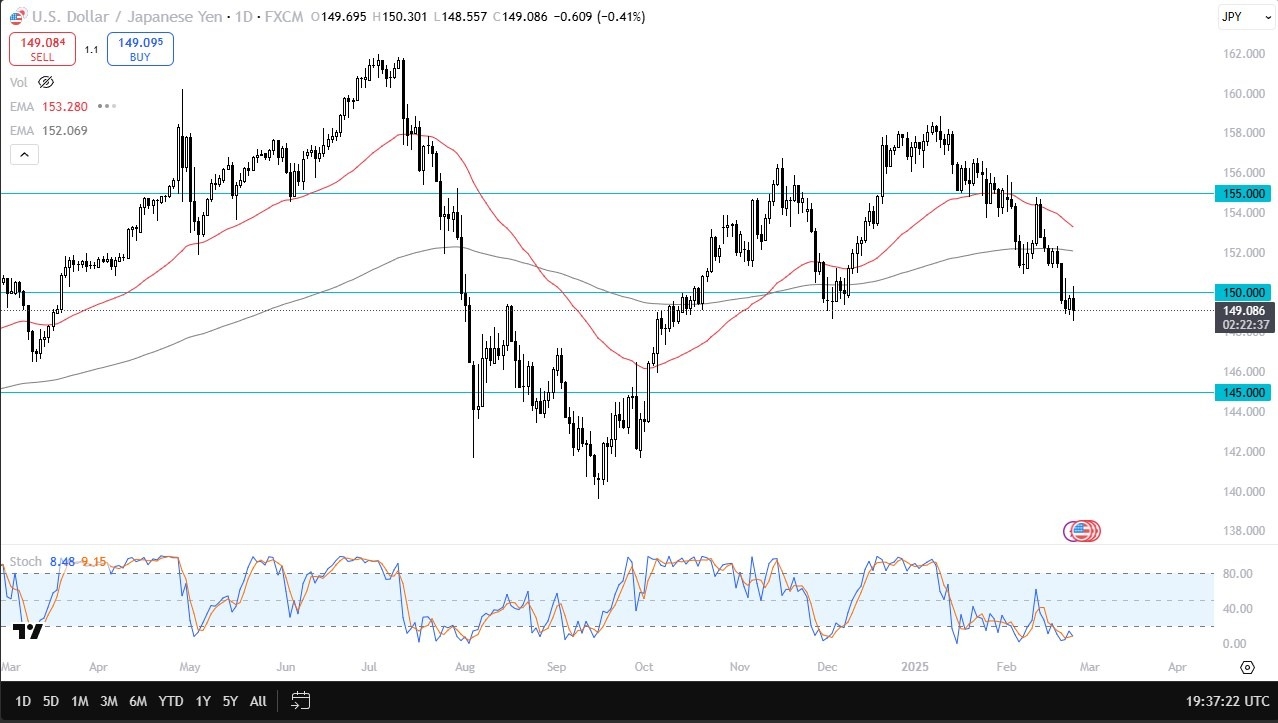
At this point, it certainly looks as if we are asking questions of the downside, but keep in mind that the interest rate differential continues to favor the US dollars. It’ll be interesting to see how this plays out. I think you’ve got a situation here where perhaps traders are looking through the prism of whether or not things can turn in the right direction as far as the interest rate differential is concerned, and we can break above the inverted hammer from Friday. I don’t know yet. This is a market that certainly looks like it is trying to find its bottom. But right now, we’re just bumping along. And I think the interest rate differential itself isn’t enough to get the market moving because everybody is freaking out about the idea of the carry trade unwinding.
That being said, if we could break above the Friday inverted hammer from last week, it opens up a move to the 152 yen level, which is where the 200 day EMA currently resides. If we break down from here, perhaps below the 148 yen level, then it opens up a move down to the 145 yen level rather quickly. That goes against the interest rate swap and of course, you have to pay at the end of every day to do that. So that’s why I’m always a little bit leery of doing this, because it does add up over time. A short-term trade works out quite nicely, but if you end up in a trend trade, it gets expensive over the longer term. As things stand right now, the Japanese are likely to be at 0.75% by the end of the year, but the Americans are probably still going to be at 4%, or perhaps even 4.25% which is part of why I’m waiting to see if we can break to the upside.
Want to trade our USD/JPY forex analysis and predictions? Here’s a list of forex brokers in Japan to check out.
Gold price struggles to build on Tuesday’s rebound in the Asian session on Wednesday. Gold buyers try their luck as safe-haven flows return on US President Donald Trump’s tariff uncertainty and weak US economic prospects.
It was a classic case of profit-taking in Gold price on Tuesday, following a fresh record high of $2,956 set on Monday. Further, Gold price lost ground after the Hong Kong Census and Statistics Department showed that China’s total Gold imports via Hong Kong in January fell 44.8% from December to their lowest point since April 2022.
However, Gold buyers managed to stage a decent comeback in the mid-American session, courtesy of the weak US Conference Board (CB) Consumer Confidence data that sparked US economic concerns and weighed heavily on the US Dollar (USD) alongside the US Treasury bond yields.
US Consumer Confidence Index declined 7 points, its largest fall since August 2021, to 98.3, well below the Reuters estimate of 102.5.
Early Wednesday, Gold price sustains Tuesday’s late rebound as the tariff deadline on Canada and Mexico draws close. Meanwhile, underlying fears over a potential trade war continue to underpin the haven demand for the traditional store of value – Gold, keeping the downside short-lived.
Markets also weigh Trump’s ordering a new probe into possible new tariffs on copper imports to rebuild US production of the red metal.
US President signed an order on Tuesday, directing Commerce Secretary Howard Lutnick to start a new national security probe under Section 232 of the Trade Expansion Act of 1962, the same law that Trump used in his first term to impose 25% global tariffs on steel and aluminium.
The Gold price upswing, however, could face headwinds from a modest rebound in the Greenback and the US Treasury bond yields following the US House approval of the Republican Budget plan, which will likely advance Trump’s tax plans
Additionally, the optimism over the US-Sino meeting on tariffs also thwart the Gold price uptick but trade war concerns could continue to fuel dip-buying in the metal. Speeches from Fed policymakers could also provide some impetus to the non-interest-bearing Gold price due to a lack of top-tier US economic data releases on Wednesday.
Despite the previous corrective decline, Gold price defended the 21-day Simple Moving Average (SMA) at $2,883.
The 14-day Relative Strength Index (RSI) has stalled its descent to turn higher, currently near 64, pointing to the additional upside.
Gold buyers could retest the all-time highs at $2,956 if the rebound gathers steam. The next topside barriers are seen at the $2,970 resistance and the $3,000 threshold.
On the flip side, the immediate support is seen at the $2,900 round level, below which the 21-day SMA at $2,883 will be challenged again.
Further south, the February 14 low of $2,877 will be tested.
Gold has played a key role in human’s history as it has been widely used as a store of value and medium of exchange. Currently, apart from its shine and usage for jewelry, the precious metal is widely seen as a safe-haven asset, meaning that it is considered a good investment during turbulent times. Gold is also widely seen as a hedge against inflation and against depreciating currencies as it doesn’t rely on any specific issuer or government.
Central banks are the biggest Gold holders. In their aim to support their currencies in turbulent times, central banks tend to diversify their reserves and buy Gold to improve the perceived strength of the economy and the currency. High Gold reserves can be a source of trust for a country’s solvency. Central banks added 1,136 tonnes of Gold worth around $70 billion to their reserves in 2022, according to data from the World Gold Council. This is the highest yearly purchase since records began. Central banks from emerging economies such as China, India and Turkey are quickly increasing their Gold reserves.
Gold has an inverse correlation with the US Dollar and US Treasuries, which are both major reserve and safe-haven assets. When the Dollar depreciates, Gold tends to rise, enabling investors and central banks to diversify their assets in turbulent times. Gold is also inversely correlated with risk assets. A rally in the stock market tends to weaken Gold price, while sell-offs in riskier markets tend to favor the precious metal.
The price can move due to a wide range of factors. Geopolitical instability or fears of a deep recession can quickly make Gold price escalate due to its safe-haven status. As a yield-less asset, Gold tends to rise with lower interest rates, while higher cost of money usually weighs down on the yellow metal. Still, most moves depend on how the US Dollar (USD) behaves as the asset is priced in dollars (XAU/USD). A strong Dollar tends to keep the price of Gold controlled, whereas a weaker Dollar is likely to push Gold prices up.
Generac Holdings’ stock price (GNRC) gained ground in the intraday levels, while trying to recoup some recent losses, amid the dominance of the downward correctional trend in the short term, while trading alongside a steel trend line, reflecting the negative pressure, with negative signals from the RSI after reaching overbought levels, and ongoing negative pressure as well due to trading below the 50-day SMA.
Therefore we expect the stock to return lower, targeting the support of $131.66, provided the resistance of $151.60 holds on.
Trend forecast for today: Bearish
Silver price (XAG/USD) attracts some buyers to around $31.75, snapping the three-day losing streak during the Asian trading hours on Wednesday. The uncertainty and worries about US President Donald Trump’s tariffs boost the Silver price, a safe-haven asset.
Technically, the bullish trend of Silver remains in place as the commodity is well-supported above the key 100-day Exponential Moving Average (EMA) on the daily chart. However, further consolidation cannot be ruled out as the 14-day Relative Strength Index (RSI) hovers around the midline near 50.0, displaying a neutral momentum in the near term.
The first upside target for white metal emerges at $33.00, representing the psychological level and the upper boundary of the Bollinger Band. Any follow-through buying above this level could pave the way to $33.40, the high of February 14. Further north, the next hurdle to watch is 34.55, the high of October 29, 2024.
On the flip side, the initial support level for Silver price is seen at 31.25, the lower limit of the Bollinger Band. Sustained trading below the mentioned level could see a drop to the key contention level at $31.00, the round mark and the 100-day EMA. The additional downside filter to watch is $29.70, the low of January 27.
Silver is a precious metal highly traded among investors. It has been historically used as a store of value and a medium of exchange. Although less popular than Gold, traders may turn to Silver to diversify their investment portfolio, for its intrinsic value or as a potential hedge during high-inflation periods. Investors can buy physical Silver, in coins or in bars, or trade it through vehicles such as Exchange Traded Funds, which track its price on international markets.
Silver prices can move due to a wide range of factors. Geopolitical instability or fears of a deep recession can make Silver price escalate due to its safe-haven status, although to a lesser extent than Gold’s. As a yieldless asset, Silver tends to rise with lower interest rates. Its moves also depend on how the US Dollar (USD) behaves as the asset is priced in dollars (XAG/USD). A strong Dollar tends to keep the price of Silver at bay, whereas a weaker Dollar is likely to propel prices up. Other factors such as investment demand, mining supply – Silver is much more abundant than Gold – and recycling rates can also affect prices.
Silver is widely used in industry, particularly in sectors such as electronics or solar energy, as it has one of the highest electric conductivity of all metals – more than Copper and Gold. A surge in demand can increase prices, while a decline tends to lower them. Dynamics in the US, Chinese and Indian economies can also contribute to price swings: for the US and particularly China, their big industrial sectors use Silver in various processes; in India, consumers’ demand for the precious metal for jewellery also plays a key role in setting prices.
Silver prices tend to follow Gold’s moves. When Gold prices rise, Silver typically follows suit, as their status as safe-haven assets is similar. The Gold/Silver ratio, which shows the number of ounces of Silver needed to equal the value of one ounce of Gold, may help to determine the relative valuation between both metals. Some investors may consider a high ratio as an indicator that Silver is undervalued, or Gold is overvalued. On the contrary, a low ratio might suggest that Gold is undervalued relative to Silver.
Platinum price didn’t move since yesterday, to keep its fluctuation between 983.00$ barrier, while the MA55 keeps forming intraday obstacle against the negative attempts by consolidating near 959.00$.
The price might provide more sideways trades until gathering the additional negative momentum to ease the mission of reaching the negative stations near 950.00$ followed by reaching the next target at 941.00$.
The expected trading range for today is between 950.00$ and 980.00$
Trend forecast: Bearish
Gold price faced additional negative pressures to confirm breaking the bullish channel’s support line, to head towards achieving bearish correction on the intraday basis, targeting testing 2868.80$ as a next negative station, which represents 23.6% Fibonacci correction level for the rise measured from 2583.75$ to 2956.90$.
For more: please follow us on Telegram channel.
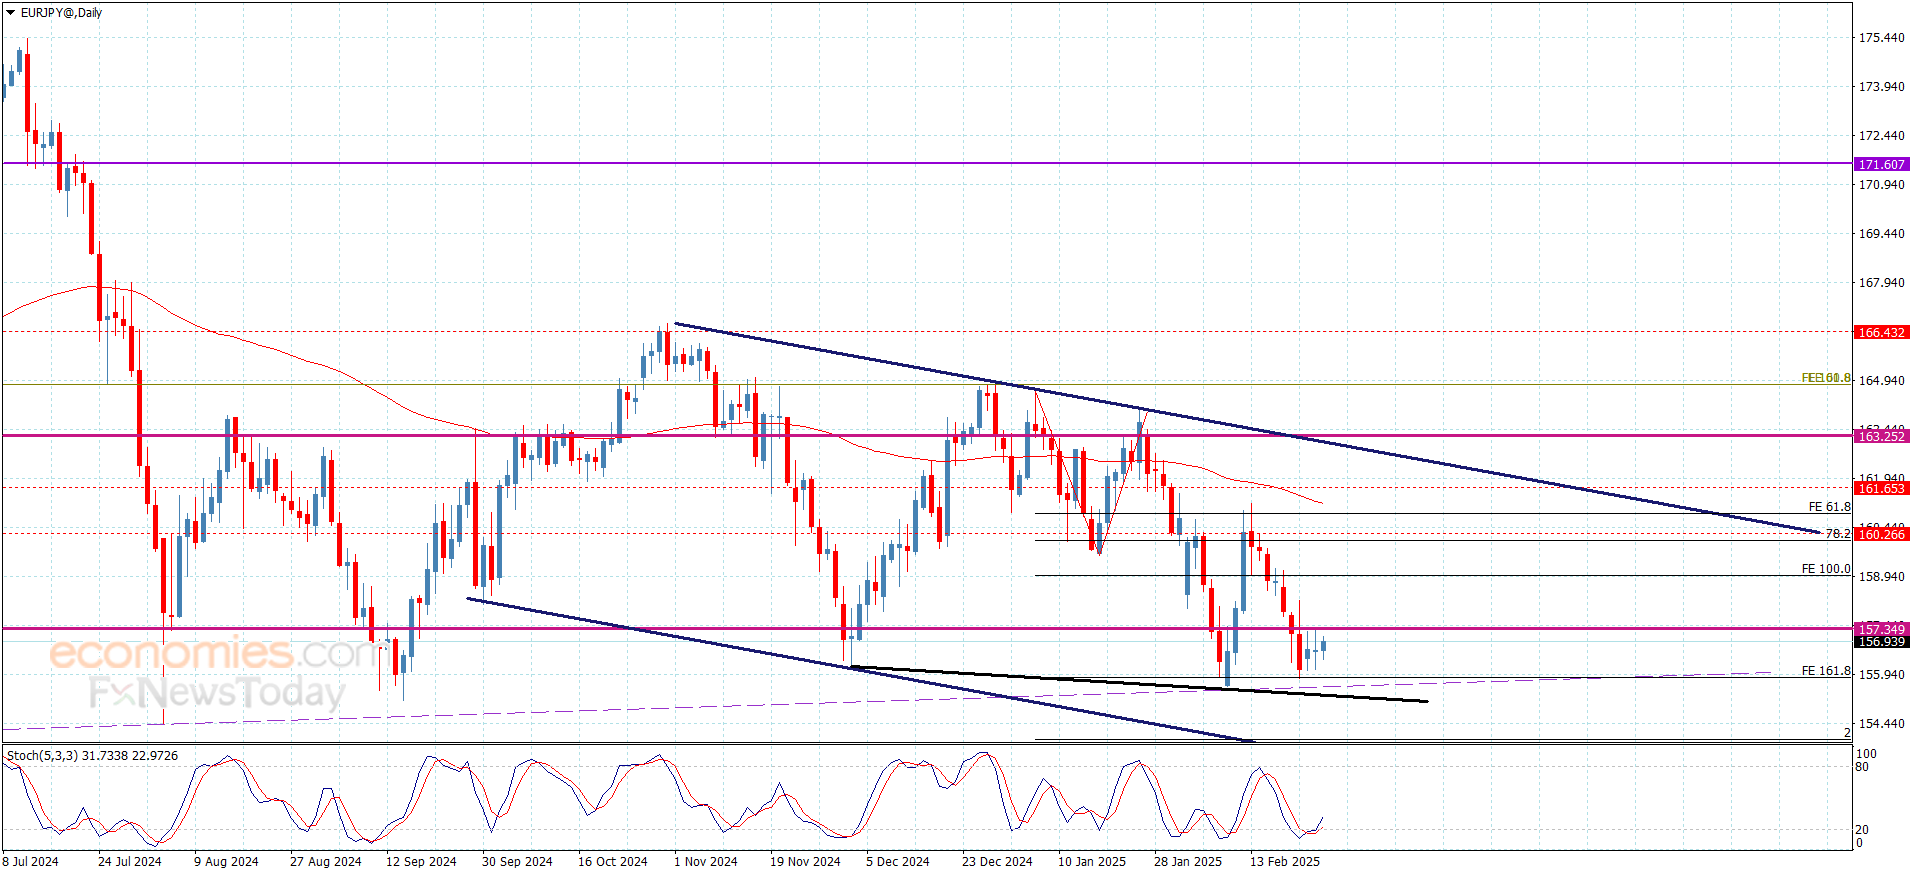
The EURJPY pair lost the negative momentum to provide sideways fluctuation by settling near 156.85.
We remind you that the negative scenario will remain valid due to the consolidation within the bearish channel, in addition to 158.90 level that forms major barrier, which allow us to wait to gather the negative momentum again to ease the mission of targeting the negative stations by moving towards 155.30 level first, while breaking this obstacle might extend losses towards 153.90 to form the next main target for the negative trades.
The expected trading range for today is between 155.30 and 157.60
Trend forecast: Bearish
Natural gas price took advantage of the minor bullish channel’s support line stability at 3.950$ to start forming new bullish waves and achieve some gains by reaching 4.190$, to close the recent gap.
The contradiction between the major indicators might push the price to form some sideways trades until gathering the required positive momentum to record more gains by rallying towards 4.300$ first, followed by repeating the pressure on 4.500$ high.
The expected trading range for today is between 4.050$ and 4.300$
Trend forecast: Bullish
Dell Technologies’ stock price (DELL) fell in the intraday levels, while hurt by exiting a descending price channel that guided recent short-term trading, as it also leaned on the support of the 50-day SMA, while trying to gather positive momentum to rise anew, as it also tries to vent off overbought saturation in the RSI with negative signals coming out of it.
Therefore we expect the stock to return higher, targeting the first resistance at $127.00, provided the support of $104.66 holds on.
Trend forecast for today: Likely Bullish
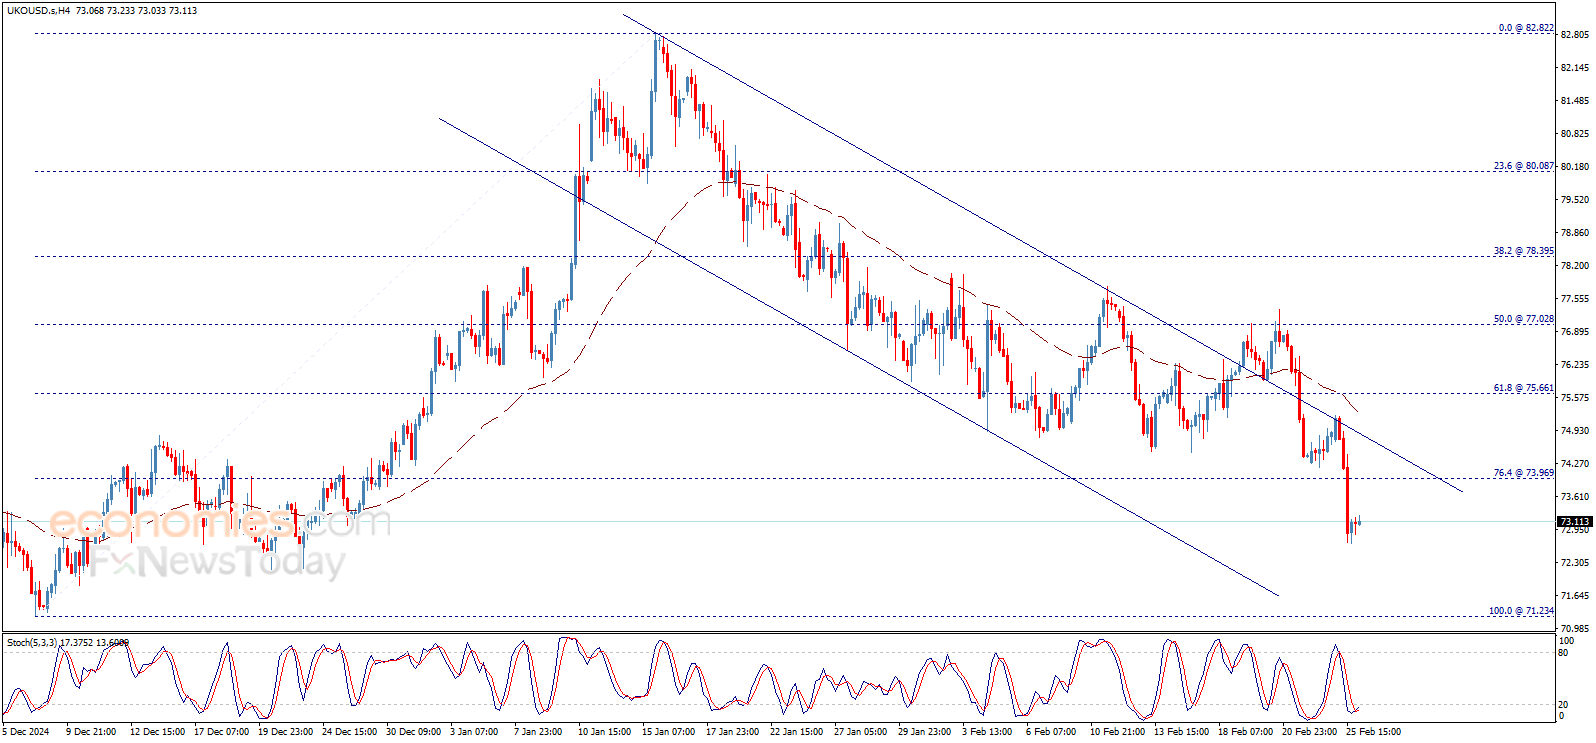
Crude oil price settles at 69.00$ after the strong decline that it witnessed in the previous sessions, noticing that the price resumes the main bearish track within the bearish channel that appears on the chart, which supports the chances of continuing the decline on the intraday and short term basis and head to achieve more negative targets.
For more: please follow us on Telegram channel.