The main category of Forex News.
You can use the search box below to find what you need.
[wd_asp id=1]
The main category of Forex News.
You can use the search box below to find what you need.
[wd_asp id=1]
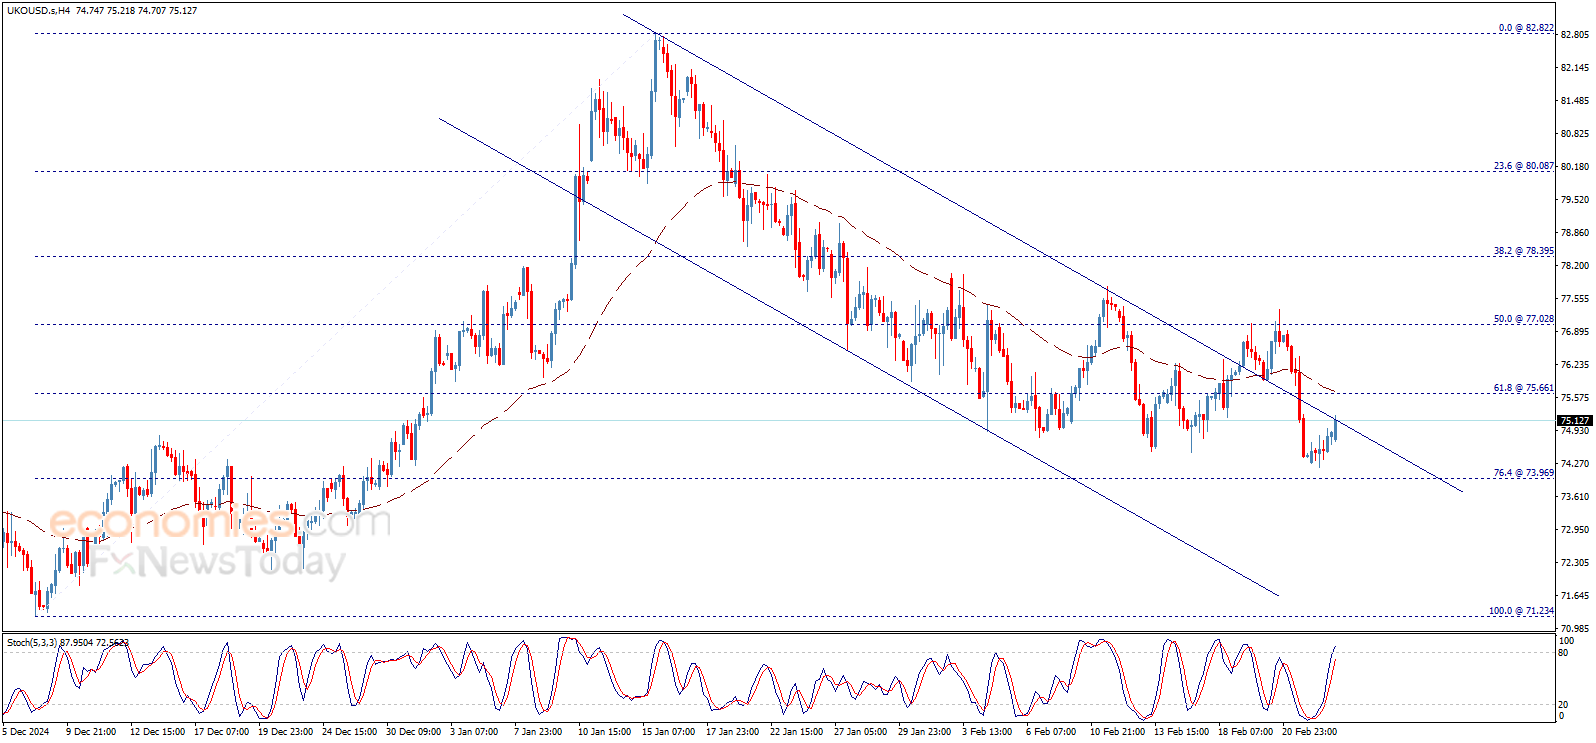
At today’s low, the price of crude oil had decreased by $11.80 or 14.6% from the recent swing high at $80.76. On a relative basis, that put it at the low end of bearish corrections that have occurred since the April 2024 peak. There were four corrections identified since then that ranged from a decline of 14.7% to 18.3%. These measured moves indicate that the current correction may be close to completing and that crude oil may have a little more to fall before the correction is complete.
Crude oil triggered a monthly bearish reversal earlier this month (not shown) and it continues to trade near the lows of the month. This shows aggressive selling with lower monthly support in a range from around $67.11 to $66.65. Given the decisiveness of the bearish retracement, these lower price levels may yet be tested before a notable bounce. There are three more trading days before the end of February, which means that crude is at risk of ending the month in a bearish position, near the lows of the month.
Although the lower trendline provides a potential support line, the next lower support zone is from $67.11 to $66.86. That range is determined by two previous interim swing lows that were established late last year. They represent a more significant support area since a drop below that price range more clearly indicates a possible continuation of the larger bear trend.
Since the $131.31 swing high in March 2022 crude oil has been in a downtrend with a series of lower swing highs and lower swing lows. However, a new lower swing low for the downtrend was attempted in September with a decline to $65.65. But that decline failed to fall below the earlier swing low at $63.67 from May 2023. The September support zone could be challenged if the $66.86 price area fails to hold as support.
For a look at all of today’s economic events, check out our economic calendar.
Silver prices plunged on Tuesday more than 1.80%, which witnessed the grey metal printing a daily peak of $32.48, before sliding below the $32.00 figure due to risk aversion and traders booking profits amidst uncertainty about US trade policies. The XAG/USD trades at $31.73 unchanged as Wednesday’s Asian session commences.
Despite printing a two-week low of $31.29, XAG/USD bounced near the 100-day Simple Moving Average (SMA) of $31.20, which if broken, would clear the path for bears to drive Silver prices toward the $30 handle. However, bulls emerged and drove the precious metal above $31.50, keeping them hopeful of re-testing the $32.00 figure.
Momentum shifted bearish as depicted by the Relative Strength Index (RSI) standing below 50, an indication that sellers are in charge. Therefore, further downside is seen.
On the other hand, if Silver climbs above $32.00, bulls can push prices towards February 25 high of $32.48. If cleared, they would remain in charge, poised to challenge $33.00.
Silver is a precious metal highly traded among investors. It has been historically used as a store of value and a medium of exchange. Although less popular than Gold, traders may turn to Silver to diversify their investment portfolio, for its intrinsic value or as a potential hedge during high-inflation periods. Investors can buy physical Silver, in coins or in bars, or trade it through vehicles such as Exchange Traded Funds, which track its price on international markets.
Silver prices can move due to a wide range of factors. Geopolitical instability or fears of a deep recession can make Silver price escalate due to its safe-haven status, although to a lesser extent than Gold’s. As a yieldless asset, Silver tends to rise with lower interest rates. Its moves also depend on how the US Dollar (USD) behaves as the asset is priced in dollars (XAG/USD). A strong Dollar tends to keep the price of Silver at bay, whereas a weaker Dollar is likely to propel prices up. Other factors such as investment demand, mining supply – Silver is much more abundant than Gold – and recycling rates can also affect prices.
Silver is widely used in industry, particularly in sectors such as electronics or solar energy, as it has one of the highest electric conductivity of all metals – more than Copper and Gold. A surge in demand can increase prices, while a decline tends to lower them. Dynamics in the US, Chinese and Indian economies can also contribute to price swings: for the US and particularly China, their big industrial sectors use Silver in various processes; in India, consumers’ demand for the precious metal for jewellery also plays a key role in setting prices.
Silver prices tend to follow Gold’s moves. When Gold prices rise, Silver typically follows suit, as their status as safe-haven assets is similar. The Gold/Silver ratio, which shows the number of ounces of Silver needed to equal the value of one ounce of Gold, may help to determine the relative valuation between both metals. Some investors may consider a high ratio as an indicator that Silver is undervalued, or Gold is overvalued. On the contrary, a low ratio might suggest that Gold is undervalued relative to Silver.
Gold price resumed its positive trading, and continues to fluctuate around the bullish channel’s support line that appears on the chart, facing negative pressures affected by the negative momentum that appears through stochastic, while the EMA50 provides continuous positive support to the price.
For more: please follow us on Telegram channel.
USD/JPY daily
BofA remains structurally bearish on JPY, raising their USD/JPY forecast to 165 (previously 160) and expecting the 10-year JGB yield to reach 1.65%. They see continued JPY weakness driven by accelerating Japanese outward investment, as households shift wealth away from yen deposits into foreign assets amid persistent inflation.
Key Points:
1️⃣ Higher USD/JPY Forecast 📈
2️⃣ BoJ Terminal Rate Revised Upwards 🏦
3️⃣ Accelerating Outward Investment 🌏
Conclusion:
BofA reinforces its structurally bearish JPY stance, forecasting USD/JPY at 165 by year-end. Japanese households’ portfolio rebalancing and lack of positive real rates will likely drive continued JPY weakness.
For bank trade ideas, check out eFX Plus. For a limited time, get a 7 day free trial, basic for $79 per month and premium at $109 per month. Get it here.
Spot Gold is on the back foot in the second half of Tuesday, trading below the $2,900 mark and trimming early weekly gains. The US Dollar (USD) gathered upward momentum after Wall Street’s opening, trading firmly, particularly against commodities and commodity-linked rivals. On the contrary, the USD is mildly weak against European rivals amid falling US Treasury yields. In the case of XAU/USD, the lack of upward progress towards fresh record highs triggered profit-taking.
Concerns gyrate around the United States (US) government’s planned tariffs. President Donald Trump brought back to the table levies on Canada, Mexico and China, saying that he plans to “move forward” after the announced one-month delay, adding that additional tariffs could soon reach Chinese products.
Trump Trade Adviser Peter Navarro, however, clarified that US authorities are negotiating with Mexico and Canada, adding that levies will depend on the progress of such negotiations.
Stock markets suffered since early Asia amid Trump hitting the tech sector, with menaces on imposing restrictions to Chinese semiconductors. As a result, the tech sector is the worst performer, with the Nasdaq Composite down roughly 330 points.
Further fueling the dismal mood, the US CB Consumer Confidence report showed consumers turned more pessimistic, as the index fell to 98.3 in February from 104.1 in January. It also missed expectations of 102.7 while showing Expectations plunged to 72.9, below the 80 mark that separates growth from recession.
The daily chart for the XAU/USD pair shows the bearish corrective decline could continue, particularly if the pair breaks below a bullish 20 Simple Moving Average (SMA), providing dynamic support at around $2,879.95. The 100 and 200 SMAs keep heading north far below the shorter one, limiting the potential of a sustained bearish move. Finally, technical indicators head south almost vertically, reflecting sellers’ strength yet holding above their midlines, which is not enough to confirm a steeper decline.
In the near term, and according to the 4-hour chart, the bearish case is firmer. XAU/USD plunged below a mildly bearish 20 SMA, now acting as dynamic resistance at around $2,936.20. At the same time, the pair is battling a bullish 100 SMA while technical indicators head firmly south near oversold readings. Should the pair clear the area around the mentioned 100 SMA, the slide could extend towards the next relevant level, January’s monthly high at $2,817.04.
Support levels: 2,879.95 2,863.60 2,855.45
Resistance levels: 2,908. 2,921.50 2,636.20
Important DisclaimersThe content provided on the website includes general news and publications, our personal analysis and opinions, and contents provided by third parties, which are intended for educational and research purposes only. It does not constitute, and should not be read as, any recommendation or advice to take any action whatsoever, including to make any investment or buy any product. When making any financial decision, you should perform your own due diligence checks, apply your own discretion and consult your competent advisors. The content of the website is not personally directed to you, and we does not take into account your financial situation or needs.The information contained in this website is not necessarily provided in real-time nor is it necessarily accurate. Prices provided herein may be provided by market makers and not by exchanges.Any trading or other financial decision you make shall be at your full responsibility, and you must not rely on any information provided through the website. FX Empire does not provide any warranty regarding any of the information contained in the website, and shall bear no responsibility for any trading losses you might incur as a result of using any information contained in the website.The website may include advertisements and other promotional contents, and FX Empire may receive compensation from third parties in connection with the content. FX Empire does not endorse any third party or recommends using any third party’s services, and does not assume responsibility for your use of any such third party’s website or services.FX Empire and its employees, officers, subsidiaries and associates, are not liable nor shall they be held liable for any loss or damage resulting from your use of the website or reliance on the information provided on this website.Risk DisclaimersThis website includes information about cryptocurrencies, contracts for difference (CFDs) and other financial instruments, and about brokers, exchanges and other entities trading in such instruments. Both cryptocurrencies and CFDs are complex instruments and come with a high risk of losing money. You should carefully consider whether you understand how these instruments work and whether you can afford to take the high risk of losing your money.FX Empire encourages you to perform your own research before making any investment decision, and to avoid investing in any financial instrument which you do not fully understand how it works and what are the risks involved.
GBP/USD turned south after advancing to a multi-month high at the weekly opening and closed marginally lower on Monday. The pair stays relatively quiet below 1.2650, while the technical outlook points to a loss of bullish momentum.
The table below shows the percentage change of British Pound (GBP) against listed major currencies last 7 days. British Pound was the strongest against the Canadian Dollar.
| USD | EUR | GBP | JPY | CAD | AUD | NZD | CHF | |
|---|---|---|---|---|---|---|---|---|
| USD | 0.13% | 0.05% | -1.29% | 0.53% | 0.35% | 0.24% | -0.48% | |
| EUR | -0.13% | -0.09% | -1.42% | 0.40% | 0.22% | 0.11% | -0.61% | |
| GBP | -0.05% | 0.09% | -1.32% | 0.49% | 0.31% | 0.19% | -0.53% | |
| JPY | 1.29% | 1.42% | 1.32% | 1.85% | 1.66% | 1.54% | 0.81% | |
| CAD | -0.53% | -0.40% | -0.49% | -1.85% | -0.19% | -0.29% | -1.01% | |
| AUD | -0.35% | -0.22% | -0.31% | -1.66% | 0.19% | -0.11% | -0.82% | |
| NZD | -0.24% | -0.11% | -0.19% | -1.54% | 0.29% | 0.11% | -0.71% | |
| CHF | 0.48% | 0.61% | 0.53% | -0.81% | 1.01% | 0.82% | 0.71% |
The heat map shows percentage changes of major currencies against each other. The base currency is picked from the left column, while the quote currency is picked from the top row. For example, if you pick the British Pound from the left column and move along the horizontal line to the US Dollar, the percentage change displayed in the box will represent GBP (base)/USD (quote).
The upbeat market mood made it difficult for the US Dollar (USD) to find demand early Monday and helped GBP/USD push higher. In the second half of the day, the negative shift seen in risk sentiment supported the USD and weighed on the pair.
Meanwhile, Bank of England (BoE) Monetary Policy Committee (MPC) external member Swati Dhingra, who voted in favor of a 50 basis points (bps) rate cut at the February meeting, said on Monday that the monetary policy restrictiveness is still at a high level. “If you can cut rates by 25 bps at a quarterly pace, you’ll still be in restrictive territory all this year,” she added.
On Tuesday, the US economic calendar will feature regional manufacturing surveys and the Conference Board’s (CB) Consumer Confidence Index data for February. Additionally, US President Donald Trump is expected to sign executive orders later in the American session.
In case safe-haven flows dominate the action in the financial markets later in the day, the USD could hold its ground and cause GBP/USD to extend its correction. As of writing, US stock index futures were trading mixed, pointing to a cautious stance.
GBP/USD faces interim support at 1.2600 (static level, round level). If the pair drops below this level and confirms it as resistance, additional losses toward 1.2530 (100-period Simple Moving Average (SMA) on the 4-hour chart, Fibonacci 61.8% retracement of the latest downtrend) and 1.2500 (round level, static level) could be seen.
On the upside, resistances are located at 1.2650 (Fibonacci 78.6% retracement, 100-day SMA), 1.2700-1.2710 (round level, static level) and 1.2750 (static level).
The Pound Sterling (GBP) is the oldest currency in the world (886 AD) and the official currency of the United Kingdom. It is the fourth most traded unit for foreign exchange (FX) in the world, accounting for 12% of all transactions, averaging $630 billion a day, according to 2022 data. Its key trading pairs are GBP/USD, also known as ‘Cable’, which accounts for 11% of FX, GBP/JPY, or the ‘Dragon’ as it is known by traders (3%), and EUR/GBP (2%). The Pound Sterling is issued by the Bank of England (BoE).
The single most important factor influencing the value of the Pound Sterling is monetary policy decided by the Bank of England. The BoE bases its decisions on whether it has achieved its primary goal of “price stability” – a steady inflation rate of around 2%. Its primary tool for achieving this is the adjustment of interest rates. When inflation is too high, the BoE will try to rein it in by raising interest rates, making it more expensive for people and businesses to access credit. This is generally positive for GBP, as higher interest rates make the UK a more attractive place for global investors to park their money. When inflation falls too low it is a sign economic growth is slowing. In this scenario, the BoE will consider lowering interest rates to cheapen credit so businesses will borrow more to invest in growth-generating projects.
Data releases gauge the health of the economy and can impact the value of the Pound Sterling. Indicators such as GDP, Manufacturing and Services PMIs, and employment can all influence the direction of the GBP. A strong economy is good for Sterling. Not only does it attract more foreign investment but it may encourage the BoE to put up interest rates, which will directly strengthen GBP. Otherwise, if economic data is weak, the Pound Sterling is likely to fall.
Another significant data release for the Pound Sterling is the Trade Balance. This indicator measures the difference between what a country earns from its exports and what it spends on imports over a given period. If a country produces highly sought-after exports, its currency will benefit purely from the extra demand created from foreign buyers seeking to purchase these goods. Therefore, a positive net Trade Balance strengthens a currency and vice versa for a negative balance.
Generac Holdings’ stock price (GNRC) gained ground in the intraday levels, while trying to recoup some recent losses, amid the dominance of the downward correctional trend in the short term, while trading alongside a steel trend line, reflecting the negative pressure, with negative signals from the RSI after reaching overbought levels, and ongoing negative pressure as well due to trading below the 50-day SMA.
Therefore we expect the stock to return lower, targeting the support of $131.66, provided the resistance of $151.60 holds on.
Trend forecast for today: Bearish
The USD/JPY price analysis reveals a vulnerable setup, retreating to the 149.50 region on Tuesday as the greenback stays weak while the yen soars on potential rate hike speculations. Sellers are gathering energy to break the 149.0 level.
–Are you interested to learn more about day trading brokers? Check our detailed guide-
The US10Y dipped to 4.375%, which could further boost the yen and weigh on the USD/JPY pair. On the other hand, Japanese yields have also eased on BoJ Governor Ueda’s comments that the bank will intervene if yields spike. While JGB yields are off the highs, markets anticipate BoJ’s further tightening.
On the data front, Japan’s Services PPI figures went to 3.1% y/y in January. Hence, rising wages could strengthen the odds of another BoJ hike. Tokyo inflation also soared to a 21-month top, reinforcing the monetary tightening. According to Bloomberg estimates, there is an 83% probability of two rate hikes in 2025.
The US dollar stays volatile as the Fed’s expectations shift. Mixed US PMI and consumer sentiment data have raised concerns about slowed growth. Traders anxiously await further guidance from the Core PCE Index and Q4 GDP data.
Broader risk sentiment is now playing a role in driving USD/JPY prices. Nvidia’s earnings reports and end-of-month flows could also stimulate the market.
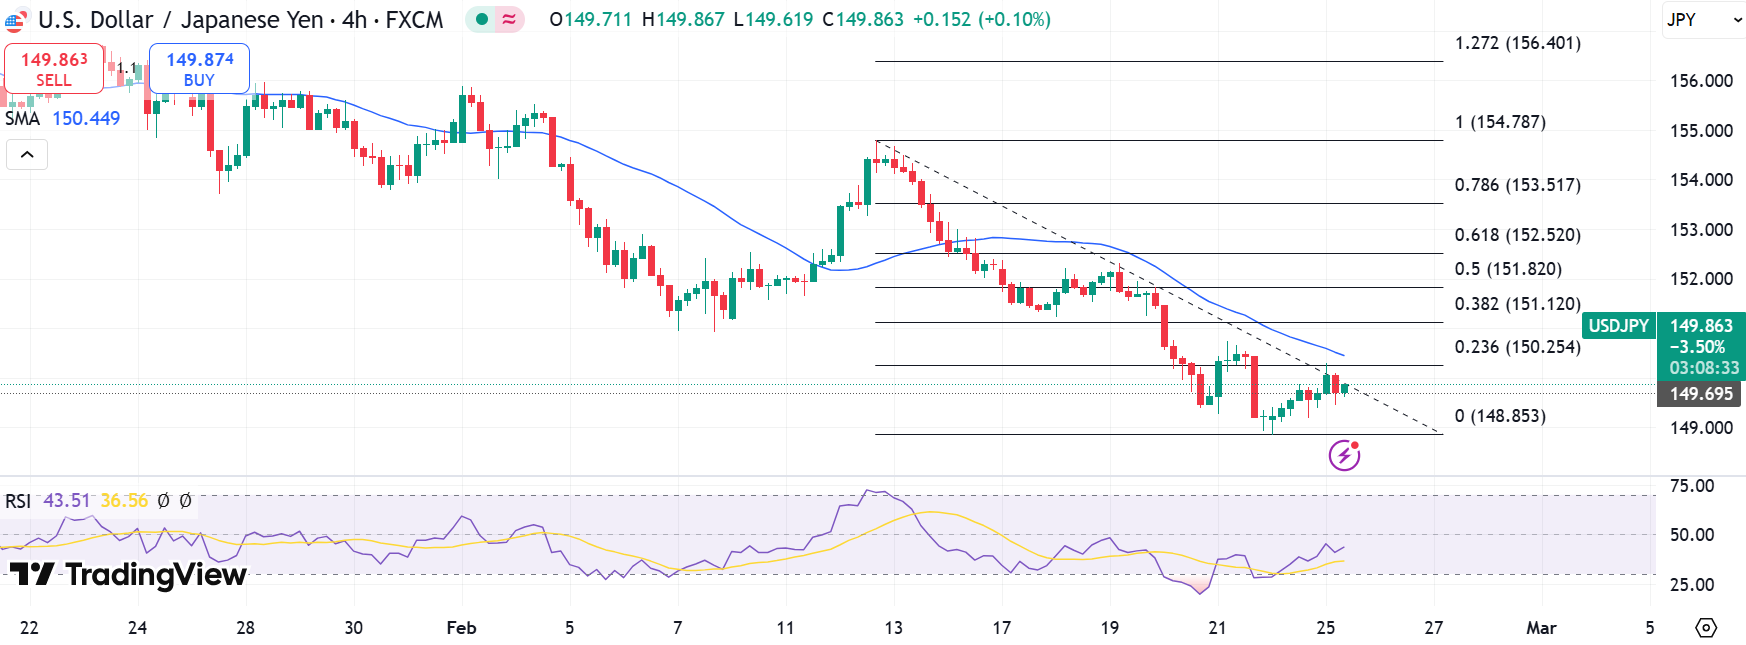
The USD/JPY has formed a temporary bottom at 148.88 with a corrective bounce above 150.0 that couldn’t be sustained. The current price level of around 149.50 is vulnerable, and the odds of breaking the bottom are high. The 4-hour chart shows that the price has stayed below the 30-period SMA since 14th Feb. Meanwhile, RSI is well above the oversold region, which indicates that the potential for a deeper downside persists.
-Are you looking for the best CFD broker? Check our detailed guide-
On the flip side, a corrective upside could bounce to 38.2 Fib level at 151.12 ahead of 50.0 Fib at 151.82. However, the pair has to find acceptance above the 30-period SMA first.
Looking to trade forex now? Invest at eToro!
67% of retail investor accounts lose money when trading CFDs with this provider. You should consider whether you can afford to take the high risk of losing your money.
The GBPJPY pair failed to resume the negative attack despite the consolidation within the bearish channel, affected by the additional support at 188.10, to start forming sideways trades by fluctuating near 189.00.
We expect to witness more sideways trades until gathering the additional negative momentum to manage to break the current support and open the way to target the additional negative stations that might start at 186.90, while rallying above 189.75 will force it to postpone the decline until testing the bearish channel’s resistance line at 191.10.
The expected trading range for today is between 187.00 and 189.70
Trend forecast: Bearish