The main category of Forex News.
You can use the search box below to find what you need.
[wd_asp id=1]
The main category of Forex News.
You can use the search box below to find what you need.
[wd_asp id=1]
Polygon’s currency price (MATICUSDT) fell in the intraday levels, while hurt by a negative divergence in the RSI after it reached overbought levels compared to the price’s movements, thus sending out negative signals, while readying to breach the pivotal support of $0.286, amid the dominance of the main downward trend, as it traded alongside the secondary short-term trend line, with negative pressure due to trading below the 50-day SMA.
Therefore we expect more losses for the price, provided the support of $0.286 was breached, thus targeting the next one at $0.149.
Trend forecast for today: Bearish
Coffee price activated the correctional bearish track by providing new negative close below the additional barrier 413.10, to notice suffering big losses by reaching 381.00 to attack 100% expansion level as appears on the chart.
Note that stochastic attempt to settle within the oversold areas increases the negative pressures, allowing us to suggest more negative trades for now, to target 374.00$ as an additional station, followed by reaching the next support at 363.00.
The expected trading range for today is between 363.00 and 390.00
Trend forecast: Bearish
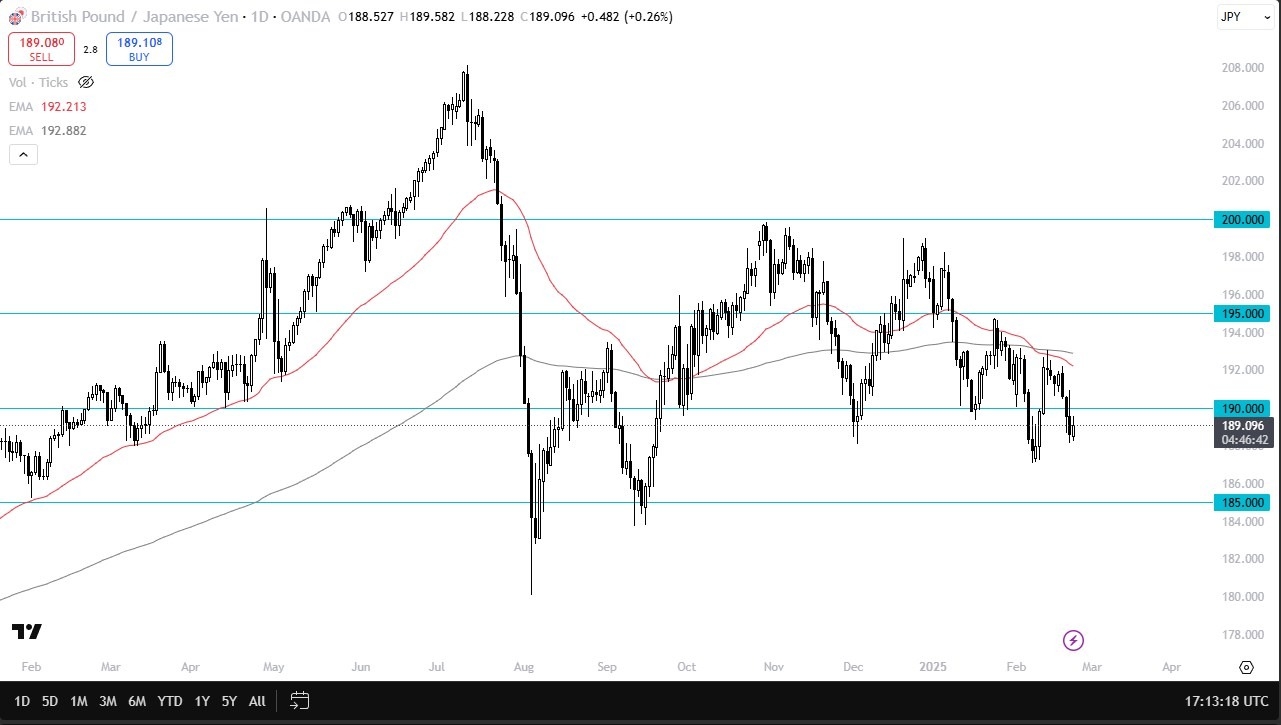
If we can break above the 190 yen level, then it opens up the possibility of a move to the 192 yen level. On the other hand, if we break down from here, it’s the 188 yen level that I will be watching very closely because it opens up the possibility of a move down to the 185 yen level. It’s worth noting that pretty much all of the yen related pairs all look the same. So I think that tells us that the Japanese yen is the main driver that’s going on overall. This chart looks quite a bit different than the British pound does against the Swiss franc, which is the other carry trade currency, mainly because the Swiss have been cutting rather aggressively. As long as Japan is not cutting, then it makes a lot of sense that we will continue to see more choppy volatility. That being said, I’m comfortable going long, not so much shorting, at least not until we break down below the latest swing below. Expect a lot of noise but expect a lot of volatility due to the shifting expectations of the carry trade in general.
Begin trading our daily forecasts and analysis. Here is a list of Forex brokers in Japan to work with.
Silver price tested the bullish channel’s support lien that appears on the chart, noticing that the price begins to rebound bullishly from there, motivated by stochastic positivity, to hint heading to recover in the upcoming sessions and achieve gains on the intrada basis.
For more: please follow us on Telegram channel.
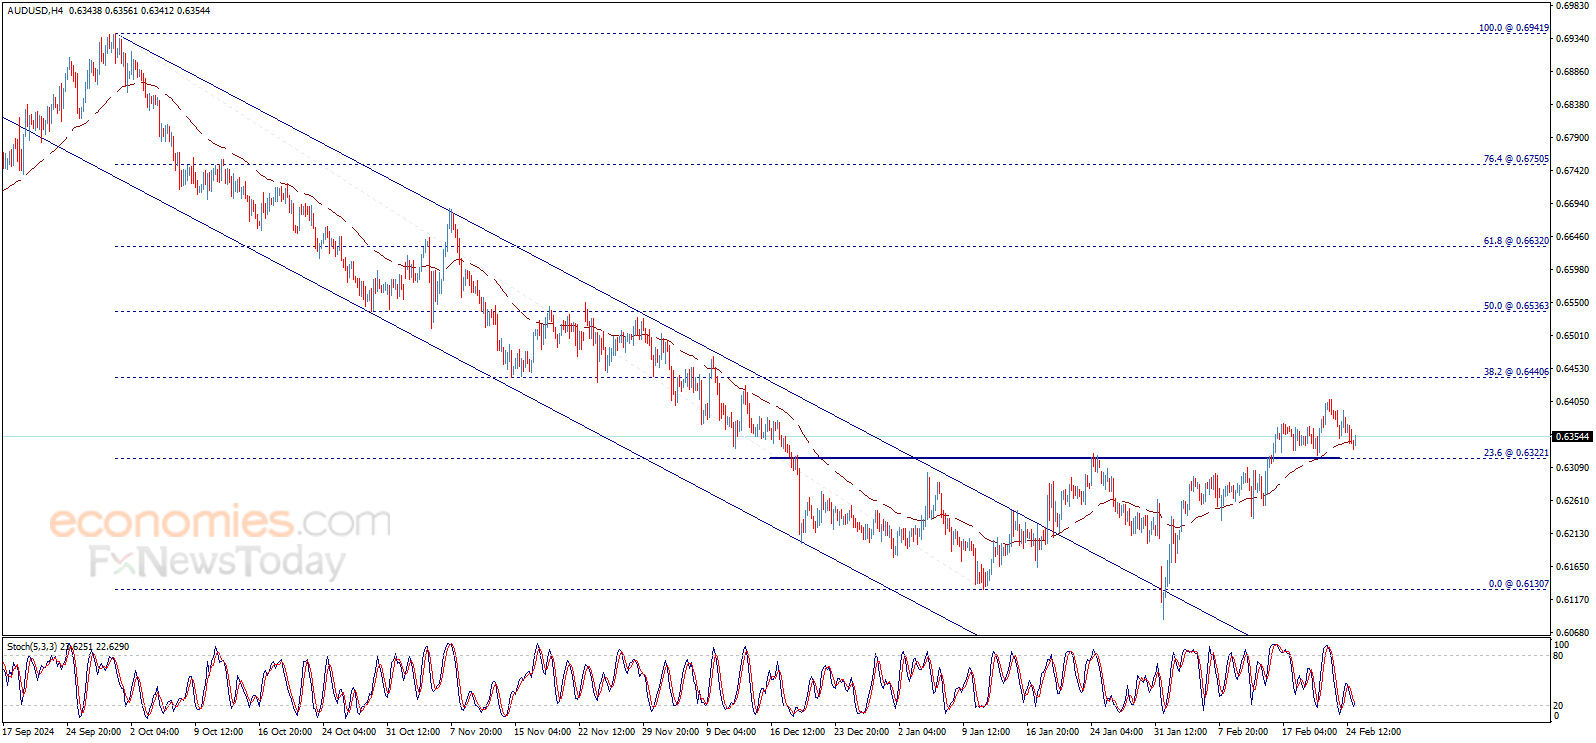
The GBPJPY pair failed to resume the negative attack despite the consolidation within the bearish channel, affected by the additional support at 188.10, to start forming sideways trades by fluctuating near 189.00.
We expect to witness more sideways trades until gathering the additional negative momentum to manage to break the current support and open the way to target the additional negative stations that might start at 186.90, while rallying above 189.75 will force it to postpone the decline until testing the bearish channel’s resistance line at 191.10.
The expected trading range for today is between 187.00 and 189.70
Trend forecast: Bearish
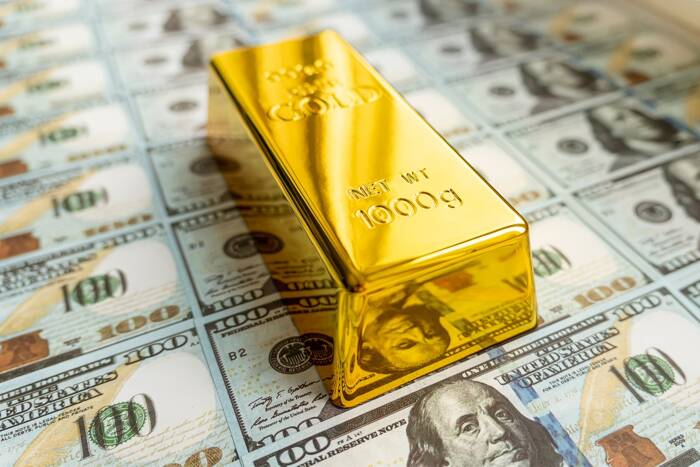
Gold price consolidates the previous rebound to fresh record highs of $2,956 in Tuesday’s Asian trading hours. Gold buyers take a breather before resuming the uptrend as trade war fears rekindle on fresh protectionism talks from US President Donald Trump and his team.
Risk sentiment remains in a weak spot so far this Tuesday, with the re-emergence of Trump’s tariff talks sagging investors’ confidence amid the market’s nervousness heading into the American artificial intelligence (AI) leader Nvidia earnings report on Wednesday.
Broad risk aversion is helping the safe haven US Dollar (USD) sustain the previous rebound, capping the Gold price upside. However, the corrective decline appears restricted by the recent decline in the US Treasury bond yields and mounting trade war fears.
The US Treasury bond yields extended their bearish momentum across the curve on Monday, courtesy of a strong auction for two-year US government bonds. Additionally, the recent release of the US S&P Global business PMI data raised concerns over the economy’s health, ramping up the odds for two interest rate cuts by the Federal Reserve (Fed) this year.
The dovish sentiment surrounding the Fed expectations remains a drag on the US Treasury bond yields. This has helped Gold price build on its ongoing upsurge.
Furthermore, lingering trade war risks continue to support the traditional store of value – Gold. US President Donald Trump said Monday that sweeping US tariffs on imports from Canada and Mexico “will go forward” when a month-long delay on their implementation expires next week.
Early Tuesday, Bloomberg reported that Trump’s administration is seeking to tighten chip controls on China. Bloomberg added that the 47th US President’s team is considering stricter controls on Nvidia chip exports to China, urging Japan and the Netherlands to harmonize on China limitations.
Meanwhile, a lack of progressive developments on the second round of US-Russia peace talks to end the Ukraine conflict also underpins the bright metal.
In the day ahead, Gold price will remain at the mercy of the Trump tariff talks as the mid-tier US Consumer Confidence data will likely play second fiddle. A generalized profit-taking across the markets cannot be ruled ahead of Nvidia earning results.
The daily chart shows that Gold price is retreating from record highs of $2,956, having found acceptance above the key $2,950 psychological barrier on a closing basis on Monday.
The 14-day Relative Strength Index (RSI) is easing off the overbought territory to enter within the bullish zone, currently near 70, suggesting that Gold price will likely catch a fresh bid on dips.
The immediate support is seen at the previous day’s low of $2,921, below which a test of the $2,900 round level will be inevitable. Further south, the February 14 low of $2,877 will be the line in the sand for Gold optimists.
However, Gold buyers could retest the all-time highs at $2,956 if the uptrend regains traction. The next topside barriers are seen at the $2,970 resistance and the $3,000 threshold.
Tariffs are customs duties levied on certain merchandise imports or a category of products. Tariffs are designed to help local producers and manufacturers be more competitive in the market by providing a price advantage over similar goods that can be imported. Tariffs are widely used as tools of protectionism, along with trade barriers and import quotas.
Although tariffs and taxes both generate government revenue to fund public goods and services, they have several distinctions. Tariffs are prepaid at the port of entry, while taxes are paid at the time of purchase. Taxes are imposed on individual taxpayers and businesses, while tariffs are paid by importers.
There are two schools of thought among economists regarding the usage of tariffs. While some argue that tariffs are necessary to protect domestic industries and address trade imbalances, others see them as a harmful tool that could potentially drive prices higher over the long term and lead to a damaging trade war by encouraging tit-for-tat tariffs.
During the run-up to the presidential election in November 2024, Donald Trump made it clear that he intends to use tariffs to support the US economy and American producers. In 2024, Mexico, China and Canada accounted for 42% of total US imports. In this period, Mexico stood out as the top exporter with $466.6 billion, according to the US Census Bureau. Hence, Trump wants to focus on these three nations when imposing tariffs. He also plans to use the revenue generated through tariffs to lower personal income taxes.
KILT/USD kept falling in the intraday levels, amid the dominance of the main downward trend in the medium term, while trading alongside the secondary short-term trend line, with negative pressure due to trading below the 50-day SMA, coupled with negative signals from the RSI despite settling at oversold levels.
Therefore we expect more losses for the price, targeting the support of $0.034, provided the resistance of $0.121 holds on.
Trend forecast for today: Bearish
Gold markets initially pulled back just a bit in the early hours on Monday, only to turn around and show signs of strength again. By doing so, it shows just how bullish and positive this market is overall, and I do think it’s probably going to break out to the upside. If and when it does, I see nothing stopping gold from reaching the $3,000 level eventually, but I’m also the first person to say that it will probably be quite noisy on the way up. With that being the case, I am pretty bullish, and I look at dips as potential buying opportunities.
The $2,900 level should continue to be important, just as the $2,800 level should be as well. The $2,800 level, I believe, is the floor in the market, if you will, with the 50-day EMA sitting right there and the fact that it was previous resistance. So, there should be a certain amount of market memory hanging around there. Keep in mind that there are plenty of things right now to push the gold market higher, not the least of which would be geopolitical concerns and worries about tariffs.
KILT/USD kept falling in the intraday levels, amid the dominance of the main downward trend in the medium term, while trading alongside the secondary short-term trend line, with negative pressure due to trading below the 50-day SMA, coupled with negative signals from the RSI despite settling at oversold levels.
Therefore we expect more losses for the price, targeting the support of $0.034, provided the resistance of $0.121 holds on.
Trend forecast for today: Bearish
Silver (XAG/USD) builds on the previous day’s modest bounce from the vicinity of the $32.00 mark, or a nearly one-week low, and gains some positive traction during the Asian session on Tuesday. The white metal, for now, seems to have snapped a two-day losing streak and currently trades just below mid-$32.00s, up 0.25% for the day.
From a technical perspective, the recent repeated failures to find acceptance above the $33.00 mark and the subsequent pullback warrant caution for bullish traders amid mixed oscillators on the daily chart. Hence, it will be prudent to wait for sustained strength and acceptance above the said handle before positioning for an extension of a well-established uptrend from sub-$29.00 levels, or the year-to-date low touched in January.
The XAG/USD might then aim to surpass the monthly swing high, around the $33.40 area touched on February 14, and climb further towards reclaiming the $34.00 mark. The momentum could extend further towards the $34.45 intermediate hurdle en route to the $35.00 neighborhood, or the multi-year peak touched in October.
On the flip side, the $32.10-$32.00 area now seems to have emerged as an immediate strong support ahead of the $31.75 region. Any further slide could be seen as a buying opportunity and help limit the downside for the XAG/USD near the $31.25 zone. The latter coincides with the 100-day Simple Moving Average (SMA) and should act as a key pivotal point. Hence, a convincing break below might shift the bias in favor of bearish traders.
The subsequent decline has the potential to drag the XAG/USD below the $31.00 round-figure mark, towards testing the the next relevant support near the $30.25 region, the $30.00 psychological mark, and the $29.55-$29.50 horizontal zone.
Silver is a precious metal highly traded among investors. It has been historically used as a store of value and a medium of exchange. Although less popular than Gold, traders may turn to Silver to diversify their investment portfolio, for its intrinsic value or as a potential hedge during high-inflation periods. Investors can buy physical Silver, in coins or in bars, or trade it through vehicles such as Exchange Traded Funds, which track its price on international markets.
Silver prices can move due to a wide range of factors. Geopolitical instability or fears of a deep recession can make Silver price escalate due to its safe-haven status, although to a lesser extent than Gold’s. As a yieldless asset, Silver tends to rise with lower interest rates. Its moves also depend on how the US Dollar (USD) behaves as the asset is priced in dollars (XAG/USD). A strong Dollar tends to keep the price of Silver at bay, whereas a weaker Dollar is likely to propel prices up. Other factors such as investment demand, mining supply – Silver is much more abundant than Gold – and recycling rates can also affect prices.
Silver is widely used in industry, particularly in sectors such as electronics or solar energy, as it has one of the highest electric conductivity of all metals – more than Copper and Gold. A surge in demand can increase prices, while a decline tends to lower them. Dynamics in the US, Chinese and Indian economies can also contribute to price swings: for the US and particularly China, their big industrial sectors use Silver in various processes; in India, consumers’ demand for the precious metal for jewellery also plays a key role in setting prices.
Silver prices tend to follow Gold’s moves. When Gold prices rise, Silver typically follows suit, as their status as safe-haven assets is similar. The Gold/Silver ratio, which shows the number of ounces of Silver needed to equal the value of one ounce of Gold, may help to determine the relative valuation between both metals. Some investors may consider a high ratio as an indicator that Silver is undervalued, or Gold is overvalued. On the contrary, a low ratio might suggest that Gold is undervalued relative to Silver.