The main category of Forex News.
You can use the search box below to find what you need.
[wd_asp id=1]
The main category of Forex News.
You can use the search box below to find what you need.
[wd_asp id=1]
Tesla’s stock price (TSLA) rose in the intraday levels after finishing the harmonic short term formation that is the AB/CD pattern, which is a positive pattern, combined with positive signals from the RSI after reaching oversold levels, amid the dominance of the main upward trend in the medium term, while still suffering due to trading below the 50-day SMA, hindering upcoming gains.
Therefore we expect more gains for the stock, targeting the important resistance of $377.30, provided the support of $326.60 holds on.
Trend forecast for today: Bullish
Spot Gold keeps grinding higher on Thursday, currently trading at around $2,920 a troy ounce. Financial markets turned optimistic in early Asia session amid hopes the conflict between Russia and Ukraine could come to an end with the intervention of the United States (US).
Risk appetite was further fueled by market talks pointing at US President Donald Trump announcing gradual tariffs later in the day. Trump imposed 25% tariffs on all steel and aluminium imports to the country at the beginning of the week and anticipated another round of levies to be announced later today. CNBC reported that such fresh tariffs would not come into effect today, adding that there would be a delay of “some months.”
Meanwhile, Trump announced through social media that he will give a news conference on reciprocal tariffs today at 13:00 EST or 18:00 GMT.
Data-wise, market players ignored higher-than-anticipated US Producer Price Index (PPI) data. Inflation at wholesale levels rose by 0.4% on a monthly basis in January, vs the 0.3% anticipated by market players. From a year earlier, the PPI was up 3.5% against expectations of a 3.2% advance. Initial Jobless Claims, on the other hand, rose by less than expected, up 213K in the week ended February 7. On Friday, the macroeconomic calendar will include January US Retail Sales.
The XAU/USD pair has recovered its bullish tone, posting a higher high and a higher low on a daily basis. The same chart shows technical indicators consolidate within overbought territory, somehow hinting at a corrective slide yet far from confirming it. Finally, the pair keeps developing above all its moving averages, with a bullish 20 Simple Moving Average (SMA) advancing beyond the 100 and 200 SMAs while providing mid-term dynamic support at around $2,808.30.
In the near term, and according to the 4-hour chart, the risk skews to the upside. The XAU/USD pair is finding intraday support at around a mildly bullish 20 SMA, currently at $2,904.60. The 100 and 200 SMAs, in the meantime, keep advancing far below the shorter one. Finally, technical indicators turned north within positive levels, favoring another leg north.
Support levels: 2,904.60 2,889.80 2,872.30
Resistance levels: 2,925.10 2,942.50 2,960.00
At 14:05 GMT, Natural Gas Futures are trading $3.733, up $0.168 or +4.71%.
Winter conditions remain a key driver of natural gas prices, with Arctic temperatures expected to persist across northern Europe and parts of the U.S. through late February. NatGasWeather forecasts “high” national demand in the coming week as frigid systems bring subzero temperatures across much of the interior U.S.
Meanwhile, today’s EIA report is expected to show a storage draw of 91-96 Bcf, significantly below the five-year average draw of 144 Bcf. Warmer-than-normal conditions in much of the U.S., excluding the northern regions, and stronger wind energy generation last week have contributed to a smaller-than-expected withdrawal. However, if the reported draw is larger than estimates, it could add further fuel to the current rally.
U.S. gas prices are also reacting to developments in the European market. Reports that the European Commission is considering a price cap to control energy costs have been met with opposition from energy industry groups, which warn of potential market instability.
In a separate development, European gas prices tumbled after reports that the U.S. and Russia have agreed to initiate peace talks regarding the war in Ukraine. A resolution could lead to increased Russian pipeline flows through Ukraine, potentially restoring Europe’s cost competitiveness to pre-crisis levels. Dutch TTF futures fell 6.3% following the news, after briefly trading above 58 euros per megawatt-hour earlier this week.
With cold weather sustaining demand and storage withdrawals tightening supplies, natural gas prices are positioned to climb further. If the market maintains its strength above $3.505, a move toward $4.020 is likely. However, traders should remain cautious, as natural gas markets tend to fade rallies quickly. A weaker-than-expected storage draw or a shift toward milder forecasts could trigger a reversal, bringing the 50-day moving average at $3.138 back into play.
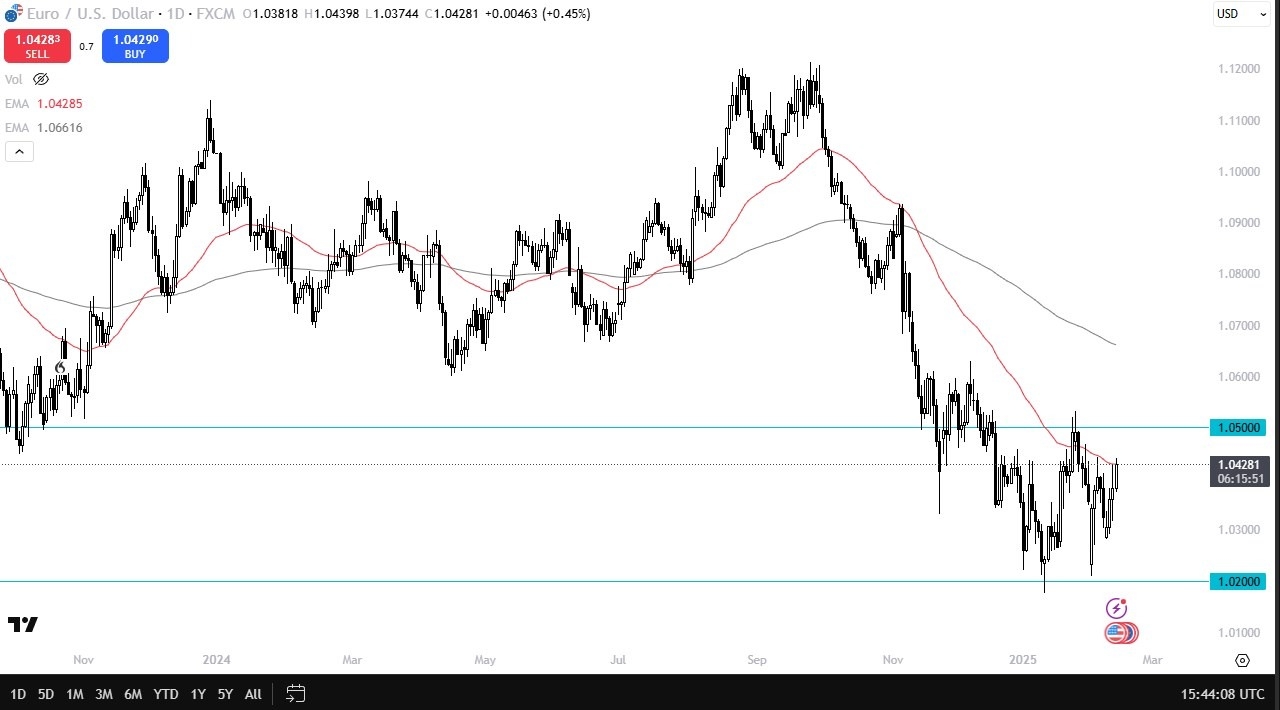
Recently trading in this market has been between the 1.05 level at the top and the 1.02 level at the bottom. At this point, we are getting fairly close to the top, and it’s probably worth noting also that the 1.05 level has a lot of noise that extends all the way to the 1.06 level. Because of this, I think you’ve got a situation where a lot of traders are going to be struggling to break out above there, but if we did see the Euro break that level, then you have to have serious discussions as to whether or not the trend has changed.

As things stand right now, I don’t see the EUR/USD pair breaking above there, unless something drastically changes in the United States, because the European Union is starting to see signs of life in Germany and France, but they still have a long way to go as far as monetary policy is concerned. In fact, this is part of the problem with the European Union, you have countries like Spain which will be completely different than countries like Greece or Finland. I would not want the job of setting monetary policy in this scenario.
As things stand right now, I’m more than willing to start fading signs of exhaustion after short-term rallies, and I think ultimately this is a market that will continue to look for a long wick’s to the upside to start shorting again. This is what I’ve been doing for a couple of months, and until something fundamentally changes, or we break above the 1.06 level, there’s no reason to get long of the Euro.
Ready to trade our EUR/USD analysis and predictions? Here are the best European brokers to choose from.
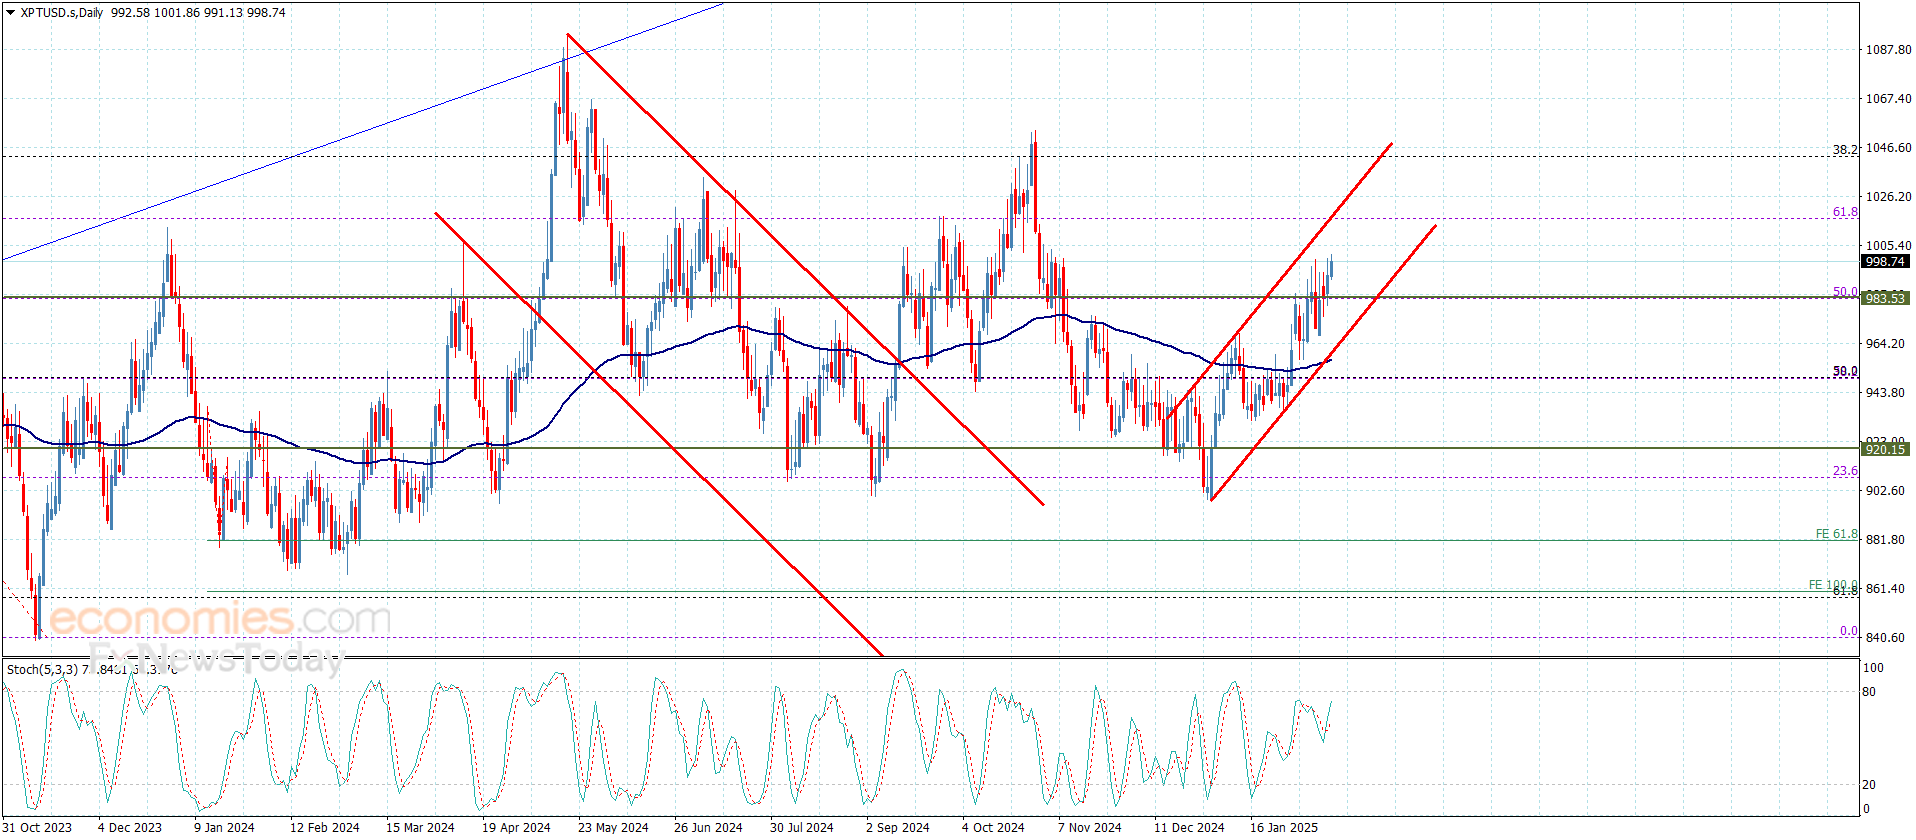
Copper price returned to renew the bullish attempts after holding above 50% Fibonacci correction level at 4.5400$, to surpass 4.6900$ resistance line this morning and hint its preparation to resume the bullish attack by settling near 4.7100$.
The price needs to gather the additional positive momentum to manage to hold above the mentioned resistance and ease the mission of recording additional gains that might extend towards 4.8050$ and 4.8920$ levels soon.
The expected trading range for today is between 4.6500$ and 4.8050$
Trend forecast: Bullish
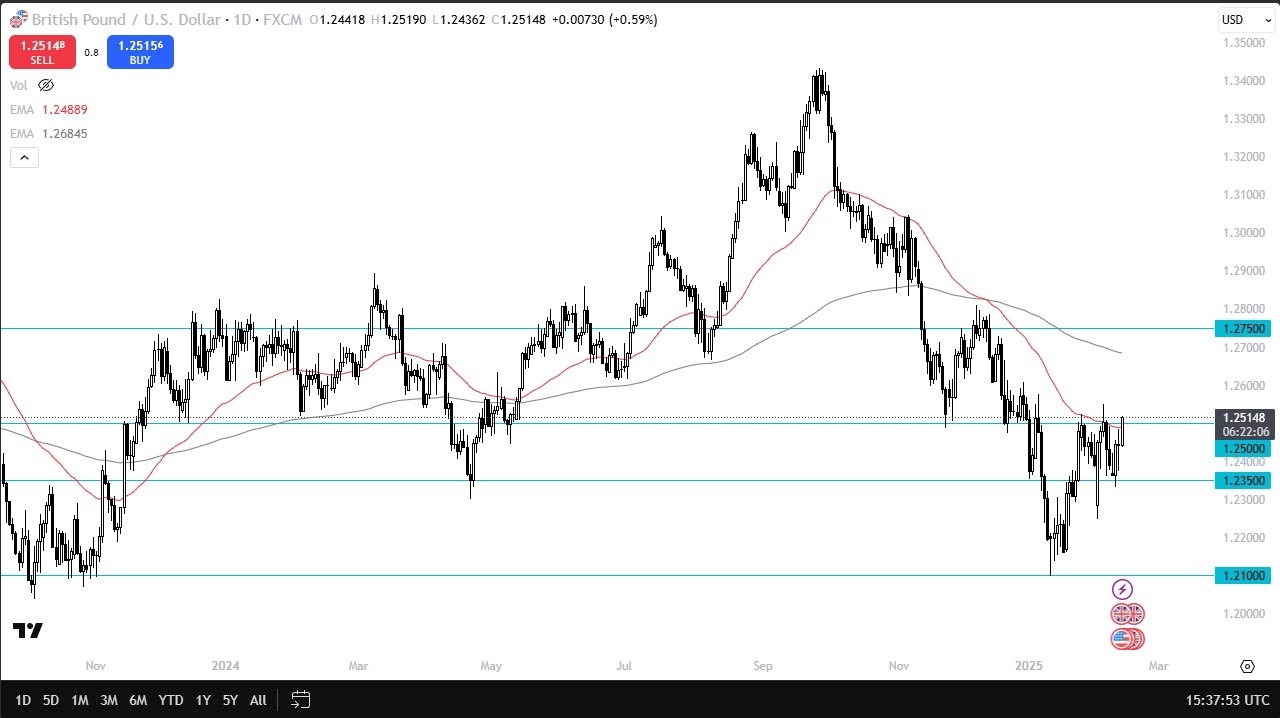
At this point, I think you have a situation where traders will continue to pay close attention to the bond market. It looks like interest rates are pulling back a little bit in the United States to weaken the US dollar for the short term, but over the longer term, it’s very likely that we will see the British pound soften a bit. We could see some exhaustion coming back into the market rather soon. However, it’s also worth noting that we are through most of the fundamental announcements for the week, so I think we’ve got a situation where the next day or 2 could tell us a lot. After all, if there is no fundamental reason for the British pound to suddenly weaken or give up some strength, it tells you how weak that Sterling really is.
On the other hand, if we were to continue to go higher and break above the 1.26 level, then we are going to be fighting the 200 Day EMA. The 200 Day EMA is a large technical indicator that a lot of people pay close attention to, and some people even base the entire trend on this indicator. If we were to break above there, then it’s likely that the market could go looking to the 1.2750 level after that.
That being said, I don’t necessarily think we are going to break above there but if we did, that would obviously be a very bullish sign. At that point, I would anticipate that the US dollar is in serious trouble against most currencies, not just the British pound. However, when you look at the chart you can see easily that the market is still for the most part in a consolidation zone, so I think it makes a lot of sense that we fade this rally given enough time.
Ready to trade our daily Forex GBP/USD analysis? We’ve made this UK forex brokers list for you to check out
We use cookies to remember your site preferences, record your referrer, improve the performance of our site and to make any adverts we show on 3rd party sites more relevant. For more information, see our cookie policy.
Please select an option below and ‘Save’ your preferences.
The USD/JPY forecast suggests a brief retreat as traders take profits after an upbeat US inflation report. However, the bullish bias remains intact as market participants price a hawkish Fed and only one rate cut this year. High borrowing costs will keep a wide gap in rates between the US and Japan, hurting the yen.
–Are you interested in learning more about STP brokers? Check our detailed guide-
The dollar rallied to new peaks against the yen after an upbeat consumer inflation report, reversing the previous downtrend. The US reported that inflation increased by 0.5% in January, well above estimates of a 0.3% increase. At the same time, the annual figure jumped by 3.0%, beating forecasts of 2.9%. The unexpectedly hot numbers pushed market participants to slash bets for Fed rate cuts. After the report, traders were only pricing 28-bps of rate cuts this year, down from 37-bps.
Meanwhile, market participants are keeping an eye on Trump’s tariff developments. The US President has promised to impose duties on all countries that have tariffs on US goods. Such an outcome would rekindle fears of a global trade war and economic uncertainty. Moreover, tariffs will likely keep US inflation high, forcing the Fed to keep rates at elevated levels.
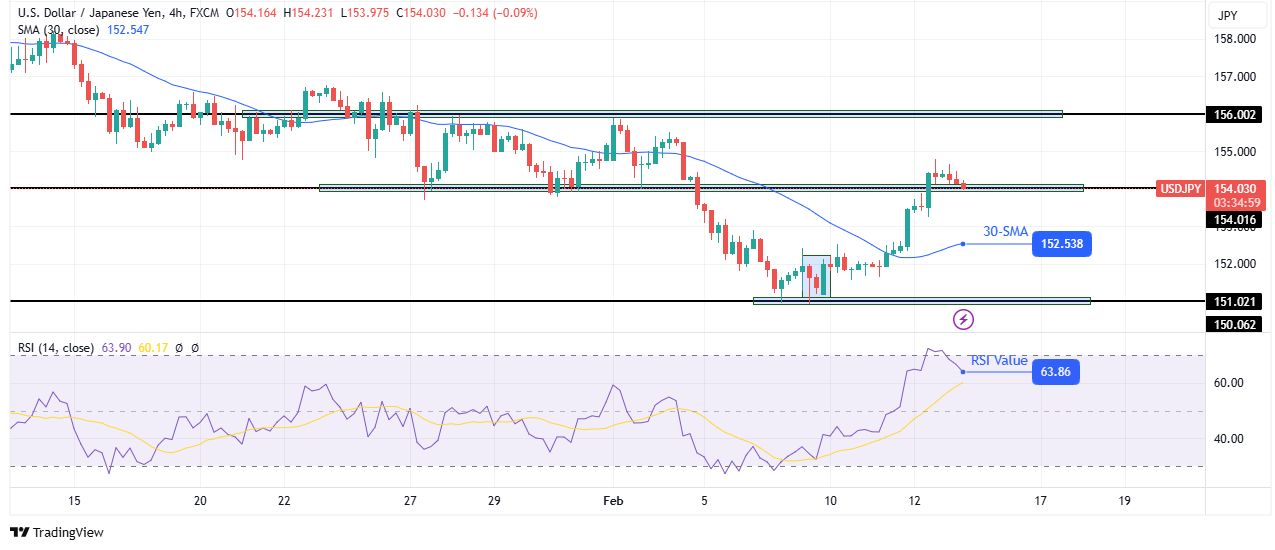
On the technical side, the USD/JPY price has broken above the 30-SMA and soared past the 154.01 resistance level. At the same time, the RI has jumped and now trades near the overbought region. This shows a strong shift in sentiment from bearish to bullish.
–Are you interested in learning more about making money with forex? Check our detailed guide-
Previously, the price had shown massive bearish momentum when it collapsed through the 154.01 support and reached the 151.02 level. However, bears could not continue beyond this level. As a result, bulls emerged and made an engulfing candle that signaled a looming reversal. Soon after, the price broke above the SMA, rising to new highs.
At the moment, the price is retesting the 154.01 level as support. If it holds firm, the price will likely climb to the 156.00 resistance level. However, it might drop further to the 30-SMA before making new highs.
Looking to trade forex now? Invest at eToro!
68% of retail investor accounts lose money when trading CFDs with this provider. You should consider whether you can afford to take the high risk of losing your money.
Silver price (XAG/USD) holds onto gains near Wednesday’s high around $32.30 in Thursday’s European session. The white metal remains firm amid uncertainty that United States (US) President Donald Trump will announce reciprocal tariffs on Thursday.
The White House said on Wednesday that US President Donald Trump could announce his reciprocal tariff plan before he meets with Indian Prime Minister Narendra Modi on Thursday.
Such a scenario would deepen fears of a global trade war, which will boost the safe-haven appeal of precious metals, such as Silver.
In the election campaign, Trump said that he would implement a policy of “an eye for an eye, a tariff for a tariff, same exact amount.”
Meanwhile, the market sentiment is risk-on as leaders of Russia and Ukraine have agreed to peace talks after a three-year-long war. The Silver price had a strong rally when Russia and Ukraine entered a war.
Apart from the uncertainty over Trump’s tariffs, the Silver price clings to gains due to weakness in the US Dollar (USD). Risk-on market mood due to Russia-Ukraine peace talks has weighed heavily on the US Dollar, with the US Dollar Index (DXY) declining to near 107.50.
The US Dollar weakens even though the hot US Consumer Price Index (CPI) report for January has boosted expectations that the Federal Reserve (Fed) will keep interest rates in the current range of 4.25%-4.50% for longer. Technically, higher interest rates for longer bodes poorly for the Silver price.
Silver price continues to face pressure near the immediate resistance of $32.50, which is plotted from the December 9 high. The outlook of the white metal remains bullish as it holds above the 50-day Exponential Moving Average (EMA), which trades around $30.95.
The 14-day Relative Strength Index (RSI) falls back inside the 40.00-60.00 range, suggesting that the momentum is not bullish for now. However, the upside bias is intact.
Looking down, the upward-sloping trendline from the August 8 low of $26.45 will be the key support for the Silver price around $29.50. While, the October 31 high of $33.90 will be the key barrier.
Silver is a precious metal highly traded among investors. It has been historically used as a store of value and a medium of exchange. Although less popular than Gold, traders may turn to Silver to diversify their investment portfolio, for its intrinsic value or as a potential hedge during high-inflation periods. Investors can buy physical Silver, in coins or in bars, or trade it through vehicles such as Exchange Traded Funds, which track its price on international markets.
Silver prices can move due to a wide range of factors. Geopolitical instability or fears of a deep recession can make Silver price escalate due to its safe-haven status, although to a lesser extent than Gold’s. As a yieldless asset, Silver tends to rise with lower interest rates. Its moves also depend on how the US Dollar (USD) behaves as the asset is priced in dollars (XAG/USD). A strong Dollar tends to keep the price of Silver at bay, whereas a weaker Dollar is likely to propel prices up. Other factors such as investment demand, mining supply – Silver is much more abundant than Gold – and recycling rates can also affect prices.
Silver is widely used in industry, particularly in sectors such as electronics or solar energy, as it has one of the highest electric conductivity of all metals – more than Copper and Gold. A surge in demand can increase prices, while a decline tends to lower them. Dynamics in the US, Chinese and Indian economies can also contribute to price swings: for the US and particularly China, their big industrial sectors use Silver in various processes; in India, consumers’ demand for the precious metal for jewellery also plays a key role in setting prices.
Silver prices tend to follow Gold’s moves. When Gold prices rise, Silver typically follows suit, as their status as safe-haven assets is similar. The Gold/Silver ratio, which shows the number of ounces of Silver needed to equal the value of one ounce of Gold, may help to determine the relative valuation between both metals. Some investors may consider a high ratio as an indicator that Silver is undervalued, or Gold is overvalued. On the contrary, a low ratio might suggest that Gold is undervalued relative to Silver.
Important DisclaimersThe content provided on the website includes general news and publications, our personal analysis and opinions, and contents provided by third parties, which are intended for educational and research purposes only. It does not constitute, and should not be read as, any recommendation or advice to take any action whatsoever, including to make any investment or buy any product. When making any financial decision, you should perform your own due diligence checks, apply your own discretion and consult your competent advisors. The content of the website is not personally directed to you, and we does not take into account your financial situation or needs.The information contained in this website is not necessarily provided in real-time nor is it necessarily accurate. Prices provided herein may be provided by market makers and not by exchanges.Any trading or other financial decision you make shall be at your full responsibility, and you must not rely on any information provided through the website. FX Empire does not provide any warranty regarding any of the information contained in the website, and shall bear no responsibility for any trading losses you might incur as a result of using any information contained in the website.The website may include advertisements and other promotional contents, and FX Empire may receive compensation from third parties in connection with the content. FX Empire does not endorse any third party or recommends using any third party’s services, and does not assume responsibility for your use of any such third party’s website or services.FX Empire and its employees, officers, subsidiaries and associates, are not liable nor shall they be held liable for any loss or damage resulting from your use of the website or reliance on the information provided on this website.Risk DisclaimersThis website includes information about cryptocurrencies, contracts for difference (CFDs) and other financial instruments, and about brokers, exchanges and other entities trading in such instruments. Both cryptocurrencies and CFDs are complex instruments and come with a high risk of losing money. You should carefully consider whether you understand how these instruments work and whether you can afford to take the high risk of losing your money.FX Empire encourages you to perform your own research before making any investment decision, and to avoid investing in any financial instrument which you do not fully understand how it works and what are the risks involved.