The main category of Forex News.
You can use the search box below to find what you need.
[wd_asp id=1]
The main category of Forex News.
You can use the search box below to find what you need.
[wd_asp id=1]
Crude oil price confirmed breaking 72.30$ level after closing yesterday below it, starting today with strong decline to head towards expected testing to 70.30$ level, noting that the price returns to the bearish channel that appears on the chart.
For inquiries, Contact Us.
The GBPJPY pair continued to form strong bullish trades, taking advantage of the frequent stability above 189.70 level that formed key support against the bullish attempts, to notice surpassing the first additional target at 192.30 and approach 50% Fibonacci correction level at 193.30 as a next station for the current trades.
Also, stochastic reach to 80 level confirms providing the additional positive momentum to increase the chances of surpassing 193.30 level soon to manage to record additional gains that might start at 193.60 and 194.20 levels.
The expected trading range for today is between 191.80 and 193.60
Trend forecast: Bullish
Gold price is trying to hold above the $2,900-mark early Thursday, having witnessed intense volatility a day ago. The focus once again remains on the US fundamentals and US President Donald Trump’s tariff plans for a fresh boost to Gold prices.
White House noted late Wednesday that the earlier announced reciprocal tariffs by President Trump could come by on Thursday, keeping the haven demand for the traditional safety net – Gold price – intact.
However, Gold traders remain wary of creating additional bullish positions in the bright metal amid increased expectations that the Federal Reserve (Fed) could pause its easing trajectory until the third quarter of this year. The hotter-than-expected January US Consumer Price Index (CPI) data published on Wednesday reinforced the hawkish bets surrounding the Fed’s interest rates outlook.
The annual headline CPI increased 3% in January, up from 2.9% the previous month. The core inflation unexpectedly rose to 3.3% over the year in January versus December’s 3.2% growth. Speaking with US lawmakers Wednesday, Fed Chair Jerome Powell said the latest data show we’re close but not there on inflation, implying that the Fed is in no rush to cut rates further.
The Fed’s hawkishness triggered a sharp rally in the US Treasury bond yields on Wednesday, fuelling a steep decline in Gold price to near the $2,865 region. Gold buyers quickly jumped in on bargain hunting, lifting the yellow metal to settle back above $2,900. Gold is widely considered a hedge against inflation, which remains at the top of the market’s concerns.
Attention now turns toward the US Producer Price Index (PPI) data due later in Thursday’s American session for further cues on the Fed’s policy stance, which could influence the non-interest-bearing Gold price.
However, any downside in Gold price will likely remain cushioned as Trump’s reciprocal tariffs could raise tensions surrounding a potential trade war worldwide. The European Union (EU) will prioritize negotiations over retaliatory countermeasures to avoid a damaging trade war, officials signalled earlier on Wednesday.
Following a brief dip below the critical 21-four hourly Simple Moving Average (SMA), now at $2,897, Gold price managed to recapture the latter, fuelling a gradual recovery.
The Relative Strength Index (RSI) holds well above the midline, currently near 63.50, backing the upside potential.
The further recovery will need acceptance above the $2,910 round level on a four-hourly candlestick closing basis.
The next topside barrier is aligned at the record high of $2,943.
On the flip side, a four-hourly candlestick closing below the 21-four hourly SMA at $2,897 will reinforce the selling interest, calling for a test of the 50-four hourly SMA at $2,866.
The last line of defense for Gold buyers is the 100-four hourly SMA at $2,816.
Tariffs are customs duties levied on certain merchandise imports or a category of products. Tariffs are designed to help local producers and manufacturers be more competitive in the market by providing a price advantage over similar goods that can be imported. Tariffs are widely used as tools of protectionism, along with trade barriers and import quotas.
Although tariffs and taxes both generate government revenue to fund public goods and services, they have several distinctions. Tariffs are prepaid at the port of entry, while taxes are paid at the time of purchase. Taxes are imposed on individual taxpayers and businesses, while tariffs are paid by importers.
There are two schools of thought among economists regarding the usage of tariffs. While some argue that tariffs are necessary to protect domestic industries and address trade imbalances, others see them as a harmful tool that could potentially drive prices higher over the long term and lead to a damaging trade war by encouraging tit-for-tat tariffs.
During the run-up to the presidential election in November 2024, Donald Trump made it clear that he intends to use tariffs to support the US economy and American producers. In 2024, Mexico, China and Canada accounted for 42% of total US imports. In this period, Mexico stood out as the top exporter with $466.6 billion, according to the US Census Bureau. Hence, Trump wants to focus on these three nations when imposing tariffs. He also plans to use the revenue generated through tariffs to lower personal income taxes.
The GBPJPY pair continued to form strong bullish trades, taking advantage of the frequent stability above 189.70 level that formed key support against the bullish attempts, to notice surpassing the first additional target at 192.30 and approach 50% Fibonacci correction level at 193.30 as a next station for the current trades.
Also, stochastic reach to 80 level confirms providing the additional positive momentum to increase the chances of surpassing 193.30 level soon to manage to record additional gains that might start at 193.60 and 194.20 levels.
The expected trading range for today is between 191.80 and 193.60
Trend forecast: Bullish
Campbell Soup Company’s stock price (CPB) rose in the intraday levels, buoyed by positive signals from the RSI as the price tries to retest the resistance of $37.94, while recouping some recent losses, amid the dominance of the main downward trend in the short term, with negative pressure due to trading below the 50-day SMA.
Therefore we expect the price to return lower, provided it settles firmly below the resistance of $37.94, thus targeting the support of $33.90.
Trend forecast for today: Likely Bearish
The GBPJPY pair continued to form strong bullish trades, taking advantage of the frequent stability above 189.70 level that formed key support against the bullish attempts, to notice surpassing the first additional target at 192.30 and approach 50% Fibonacci correction level at 193.30 as a next station for the current trades.
Also, stochastic reach to 80 level confirms providing the additional positive momentum to increase the chances of surpassing 193.30 level soon to manage to record additional gains that might start at 193.60 and 194.20 levels.
The expected trading range for today is between 191.80 and 193.60
Trend forecast: Bullish
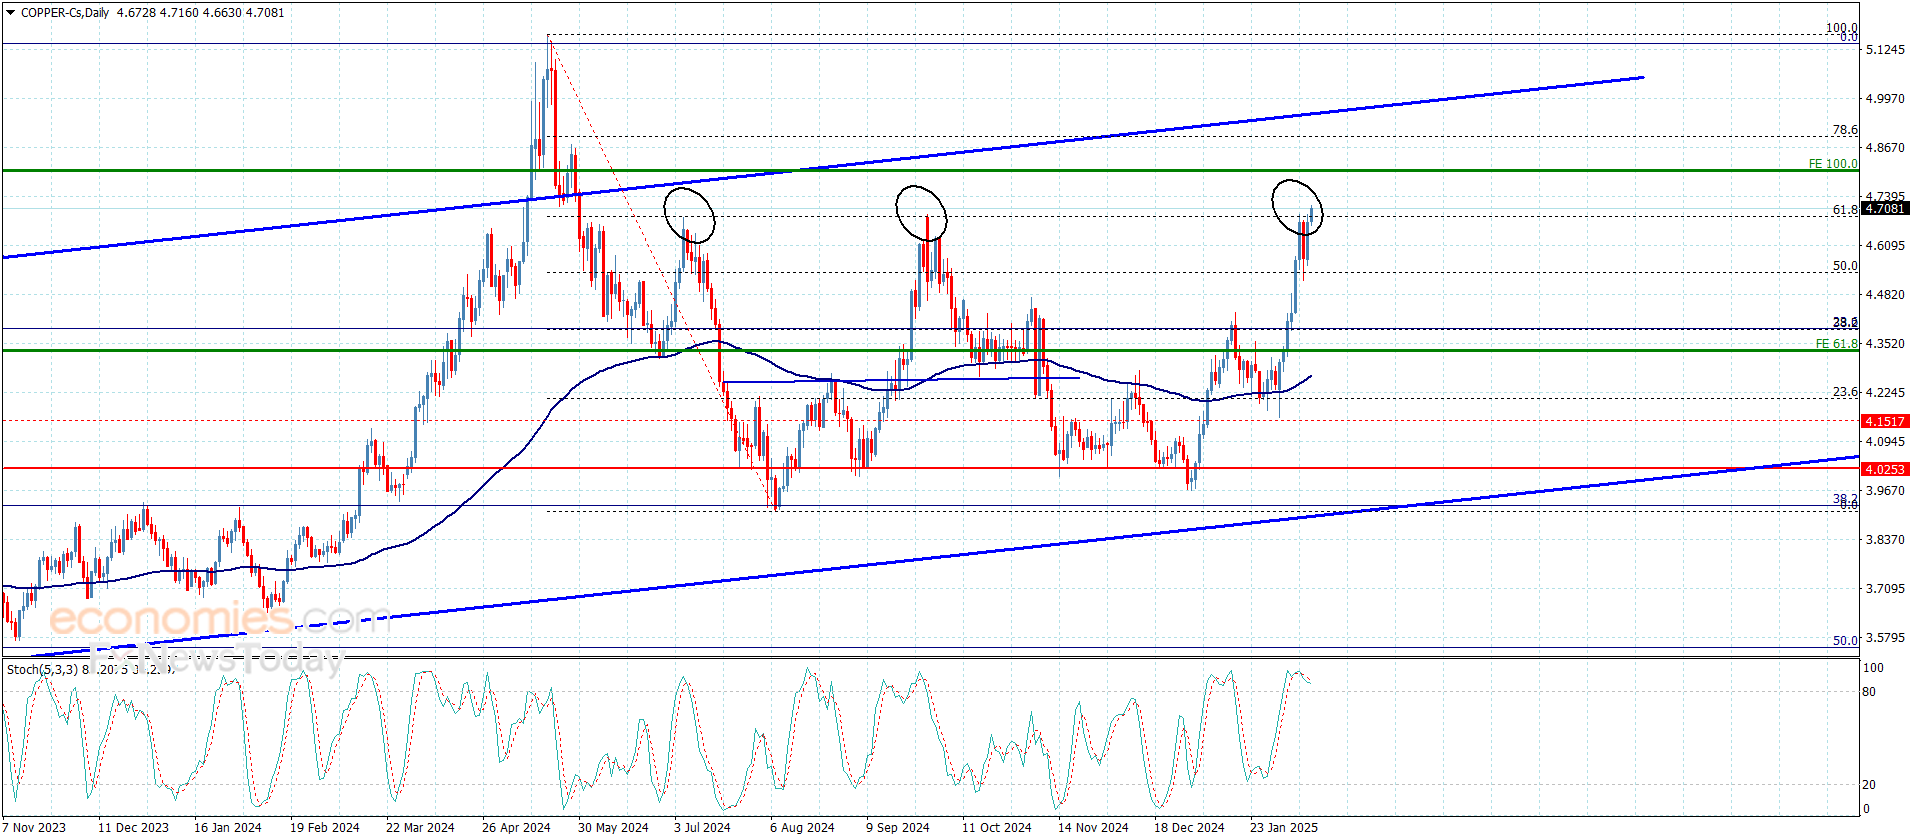
Copper price returned to renew the bullish attempts after holding above 50% Fibonacci correction level at 4.5400$, to surpass 4.6900$ resistance line this morning and hint its preparation to resume the bullish attack by settling near 4.7100$.
The price needs to gather the additional positive momentum to manage to hold above the mentioned resistance and ease the mission of recording additional gains that might extend towards 4.8050$ and 4.8920$ levels soon.
The expected trading range for today is between 4.6500$ and 4.8050$
Trend forecast: Bullish

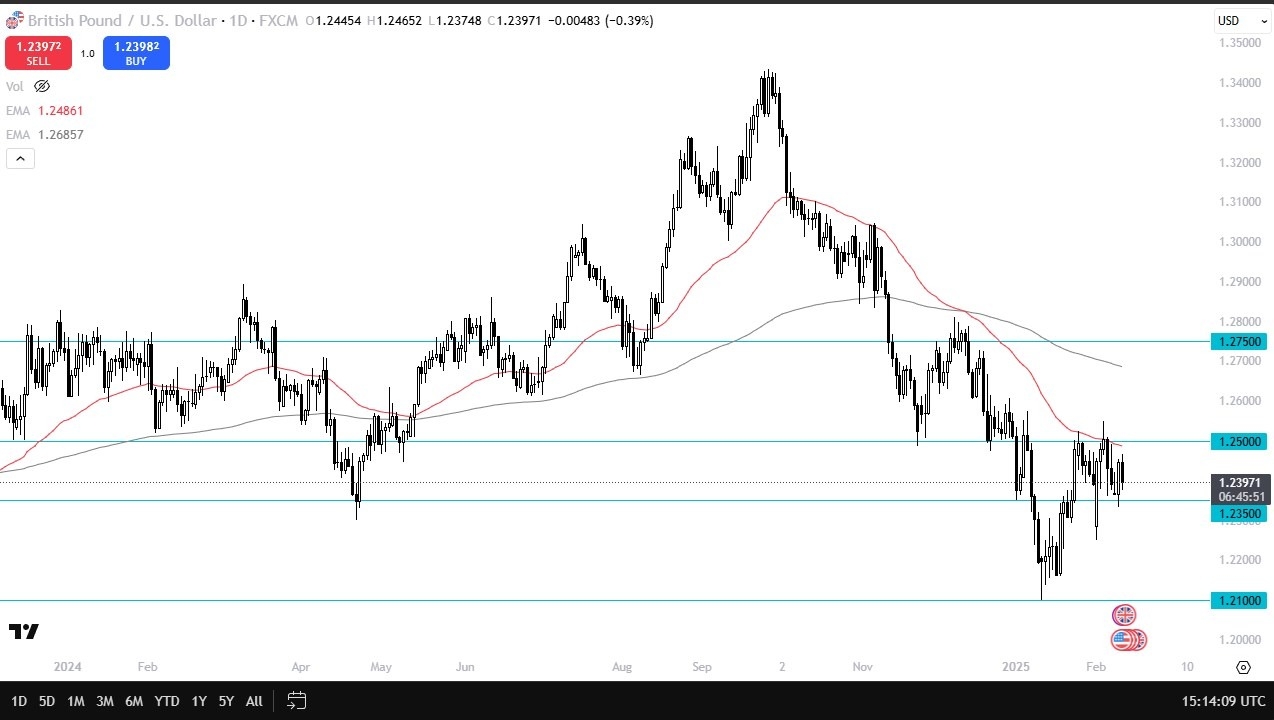
Ultimately, when you look at the technical analysis, we are still very much in a downtrend, and the 50-day EMA sits just above and near the 1.25 level. The level of 1.25 has been both support and resistance multiple times in the past, so I don’t think it’s very surprising that it could be an area of interest right now.
If we were to break above 1.26, then you can start to talk about a potential trend change. But right now, I think we’re just stuck in the same pattern that we’ve been in for a while with 1.25, a bump being a bit of a ceiling and 1.2350 level underneath being a bit of a floor. We have a little bit of sideways action, maybe some short-term range-bound opportunities present themselves for those who are a little bit more short-term inclined.
Overall, though, I still think you have a scenario where the US dollar remains fairly stout and rallies at this point in time I just don’t trust. Things can and will change, but keep in mind the Bank of England just cut interest rates and even had a couple of members on the Monetary Policy Committee suggest that they were ready to cut 50 basis points instead of 25.
Ready to trade our daily Forex GBP/USD analysis? We’ve made this UK forex brokers list for you to check out
The GBPJPY pair continued to form strong bullish trades, taking advantage of the frequent stability above 189.70 level that formed key support against the bullish attempts, to notice surpassing the first additional target at 192.30 and approach 50% Fibonacci correction level at 193.30 as a next station for the current trades.
Also, stochastic reach to 80 level confirms providing the additional positive momentum to increase the chances of surpassing 193.30 level soon to manage to record additional gains that might start at 193.60 and 194.20 levels.
The expected trading range for today is between 191.80 and 193.60
Trend forecast: Bullish
Amid the search by retail traders for financial assets to hedge against inflation or capitalize on potential bullish trends, individual investors’ appetite for the white metal is increasing
At the same time, escalating global trade tensions and growing economic uncertainty are bolstering demand for safe-haven assets, with silver remaining a favored choice alongside gold to protect wealth during volatile times
On the monetary side, major economies continue to implement a cycle of monetary easing, with central banks persistently cutting interest rates, which makes non-yielding assets such as silver more attractive compared to traditional investments like bonds
With real yields falling, the investment demand for the white metal is on the rise, potentially driving its prices to new levels throughout the year
On the industrial front, silver continues to play a vital role in multiple sectors, most notably in technology and renewable energy; the growing demand for solar panels—which rely on silver in their production—along with its widespread use in electronics and medical applications, contributes to a strong and sustainable demand for the metal
As emerging economies expand and investments in infrastructure and green technology increase, industrial demand is expected to remain a key driver for silver’s market growth, placing it at a crossroads between being an exceptional investment opportunity or merely a temporary bullish surge. Are you ready to seize the opportunity and benefit from these supporting trends?
In their quest for financial assets to hedge against the risks associated with changing monetary policies of global central banks, silver has proven to be the most cost-effective and optimal choice at present, making it the focus of investors’ attention
The current surge in silver prices has caught the attention of retail traders as the white metal diverges significantly from its true value compared to gold, which continues to set new record highs, nearing the $3,000 per ounce mark for the first time in history
According to the Silver Institute, the supply shortage in the silver market is expected to continue throughout 2025, which could support price increases to levels not seen since 2011. Moreover, supportive government policies for green energy and infrastructure are anticipated to boost silver demand due to its use in renewable energy technologies
The institute, an international non-profit organization comprising members from various sectors of the silver industry, explained that stronger industrial activity will be a major catalyst for increased global demand for the white metal, potentially leading to a new high annual level this year
Global trade tensions have escalated with the return of U.S. President Donald Trump to the political arena and the adoption of stringent trade policies aimed at protecting the American economy, as he vowed to impose high tariffs on a wide range of imports, particularly from China and Europe
These measures have prompted strong reactions from major trading partners, who have threatened retaliatory actions, further stoking fears of a new trade war that could impact global economic growth and boost demand for safe-haven assets such as gold and silver
Additionally, silver benefits from concerns over supply chain disruptions, especially with potential restrictions on industrial metals, maintaining its investment appeal amid uncertainty over U.S. trade policies
Major central banks in the United States, Europe, the United Kingdom, Canada, Switzerland, and Mexico continue their cycle of monetary easing and interest rate cuts, resulting in new liquidity injections into the markets and bolstering medium-term investor optimism for stocks, real estate, gold, silver, and even cryptocurrencies
Forecasts indicate that industrial demand for silver will remain robust throughout 2025, driven by its increasing use in technology, renewable energy, and electronics. This is especially true as investments in solar energy, which relies on silver for photovoltaic cells, continue to expand
Moreover, demand from the electronics and medical sectors is expected to further support the sustainable growth of silver’s market, enhancing long-term price prospects
Silver is primarily used for industrial purposes, playing a crucial role in the manufacturing of automobiles, solar panels, jewelry, and electronics, in addition to its use in coinage and as a safe haven for investors
Silver is currently trading at around $32 per ounce, and given forecasts that indicate a bullish market in 2025, we believe that levels between $31 and $30 per ounce are suitable for investment, with a long-term target above $35 per ounce
There are several ways to invest in silver:
In light of recent developments in global markets and the economic, trade, and geopolitical risks, it is entirely possible for silver prices to climb above $50 per ounce over the coming years, eventually paving the way to reach $100 for the first time in history if strong industrial and investment demand factors materialize
Yes, most major institutions and banks forecast that silver prices will continue to rise this year, with the metal nearing the breakthrough of the $35 per ounce barrier
The weekly chart of silver prices shows how the downward correction that began from the all-time high recorded at $49.74 was halted at the 76.4% Fibonacci level, which formed strong support around $15.34. From there, the price began its new upward journey, attempting to resume the long-term bullish trend.
Current positive attempts are facing a key resistance level formed by the previously broken 38.2% Fibonacci level, now acting as strong resistance at $32.55. Therefore, the price needs to break through this barrier and secure a weekly close above it to confirm the continuation of the upward trend and move toward new gains starting with a target of $35.30 and then the next pivotal resistance at $39.10.
On the daily timeframe, we notice that the price underwent a minor downward correction before resuming its upward movement. Additionally, the price recently formed and broke through a descending wedge pattern, triggering a positive catalyst that is expected to drive the price further upward and achieve the targets mentioned above.
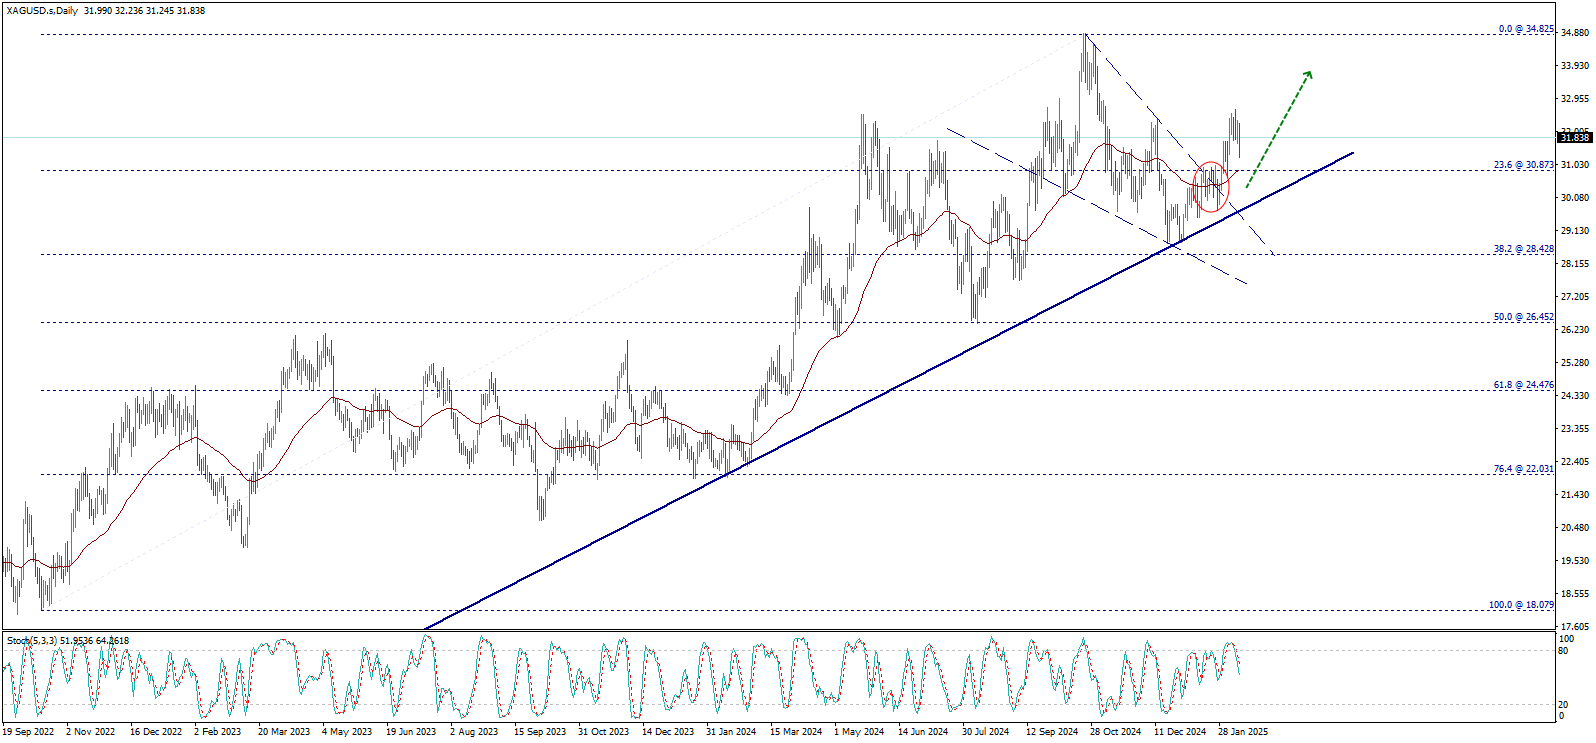
The current negative momentum across various timeframes may cause some temporary bearish fluctuations before a return to positive trading, as evidenced by the 1-hour chart. This chart shows the price forming a double top pattern, which triggered a quick downward correction before rebounding. The price needs to hold above $31.75 to avoid further negative pressure and to build a new upward wave with targets first breaking $32.64, then paving the way toward levels of $35.30 and finally $39.10, which are the next major milestones.
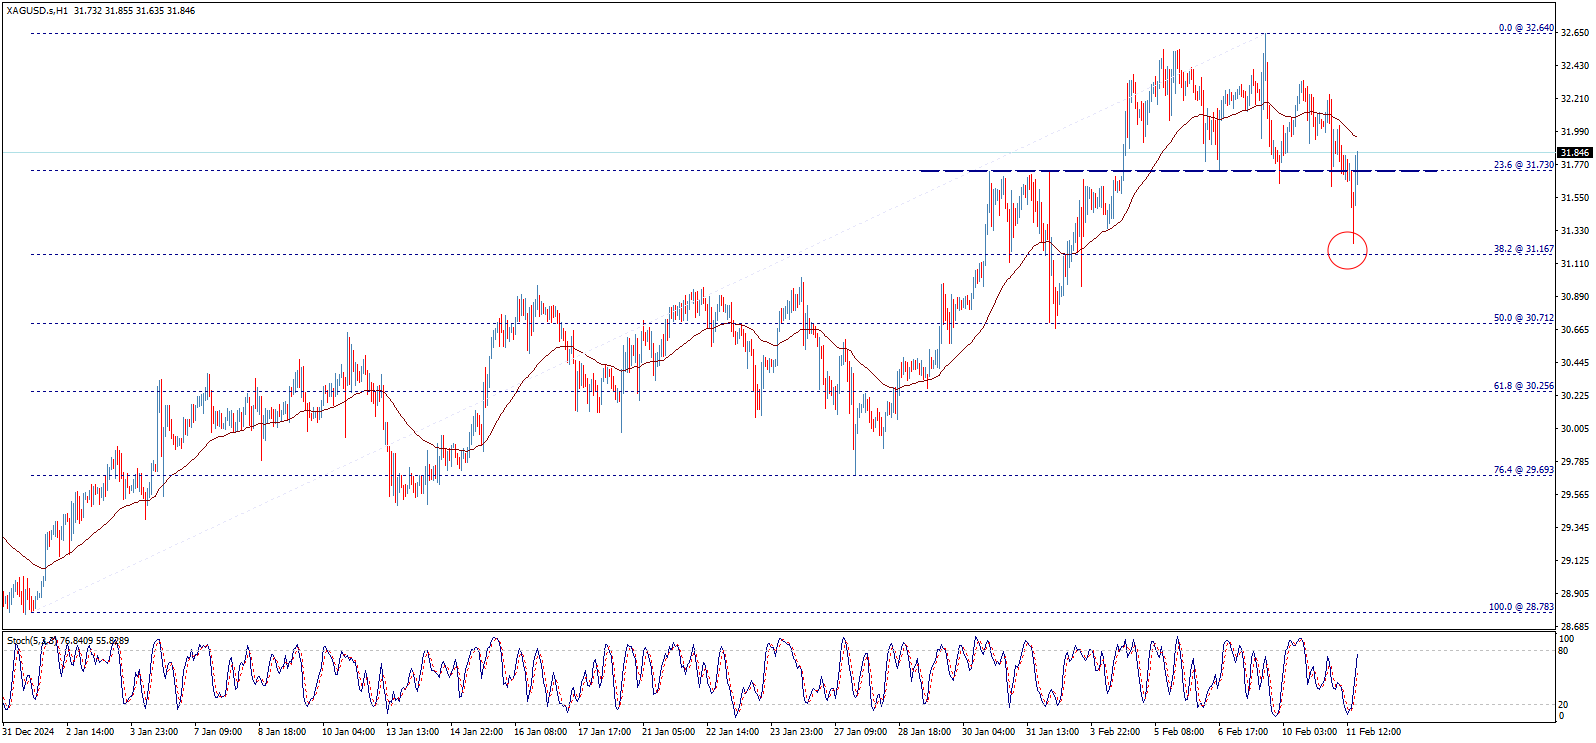
In summary, the aforementioned technical factors suggest that the price is on track to continue rising in the coming period, provided it overcomes certain barriers starting with the $32.55 – $32.64 range, and then moves towards the targets mentioned above. The 50-day moving average continues to offer positive support for the anticipated bullish wave.
Conversely, it is crucial to note that a reversal below $29.70 would derail the upward momentum, forcing a new downward correction with targets initially testing the $28.40 level and potentially extending losses to $24.50 before any new attempt at a recovery.