The main category of Forex News.
You can use the search box below to find what you need.
[wd_asp id=1]
The main category of Forex News.
You can use the search box below to find what you need.
[wd_asp id=1]
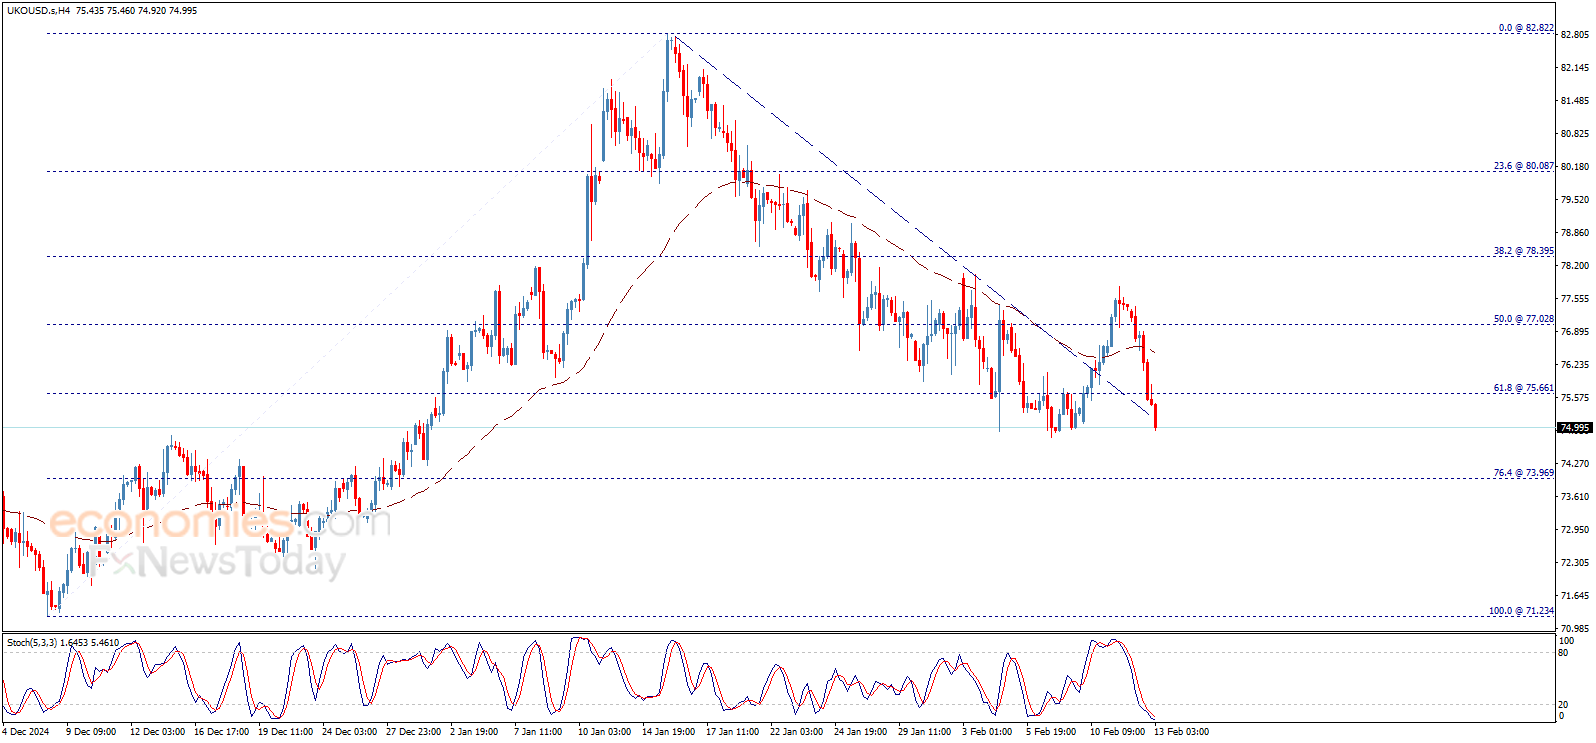
Crude oil price confirmed breaking 72.30$ level after closing yesterday below it, starting today with strong decline to head towards expected testing to 70.30$ level, noting that the price returns to the bearish channel that appears on the chart.
For inquiries, Contact Us.
EUR/USD gathers bullish momentum and rises toward 1.0450 in the European morning on Thursday. The broad-based selling pressure surrounding the US Dollar (USD) fuels the pair’s leg higher as risk flows dominate the action in financial markets.
The table below shows the percentage change of Euro (EUR) against listed major currencies today. Euro was the strongest against the US Dollar.
| USD | EUR | GBP | JPY | CAD | AUD | NZD | CHF | |
|---|---|---|---|---|---|---|---|---|
| USD | -0.42% | -0.40% | -0.23% | -0.19% | -0.16% | -0.19% | -0.20% | |
| EUR | 0.42% | 0.02% | 0.21% | 0.24% | 0.24% | 0.23% | 0.22% | |
| GBP | 0.40% | -0.02% | 0.15% | 0.22% | 0.27% | 0.21% | 0.20% | |
| JPY | 0.23% | -0.21% | -0.15% | 0.03% | 0.08% | 0.00% | 0.03% | |
| CAD | 0.19% | -0.24% | -0.22% | -0.03% | 0.04% | -0.02% | -0.01% | |
| AUD | 0.16% | -0.24% | -0.27% | -0.08% | -0.04% | -0.03% | -0.04% | |
| NZD | 0.19% | -0.23% | -0.21% | 0.00% | 0.02% | 0.03% | -0.01% | |
| CHF | 0.20% | -0.22% | -0.20% | -0.03% | 0.01% | 0.04% | 0.01% |
The heat map shows percentage changes of major currencies against each other. The base currency is picked from the left column, while the quote currency is picked from the top row. For example, if you pick the Euro from the left column and move along the horizontal line to the US Dollar, the percentage change displayed in the box will represent EUR (base)/USD (quote).
In the early trading hours of the American session on Wednesday, EUR/USD declined toward 1.0300 as the USD gathered strength on January inflation data. The US Bureau of Labor Statistics reported that the annual Consumer Price Index (CPI) rose by 3%, coming in above the market expectation and December’s increase of 2.9%. Additionally, the core CPI, which excludes volatile food and energy prices, rose by 0.4% on a monthly basis, following the 0.2% rise recorded in the previous month.
Later in the day, the improving risk mood made it difficult for the USD to preserve its strength and opened the door for a decisive rebound in EUR/USD. US President Donald Trump said that he had a “lengthy and highly productive” phone call with Russian President Vladimir Putin to begin negotiations to end the war in Ukraine. In the meantime, Trump refrained from announcing reciprocal tariffs.
In the second half of the day, the risk perception could continue to drive the pair’s action amid a lack of high-tier data releases. At the time of press, US stock index futures were rising between 0.2% and 0.5%.
According to CNBC, Trump could still unveil his reciprocal tariff plan before he meets with Indian Prime Minister Narendra Modi on Thursday. In case Trump does so, the USD could regain its traction and cause EUR/USD to turn south. On the other hand, the pair could build on its daily gains if markets don’t get any new headlines on Trump’s reciprocal tariffs.
The Relative Strength Index (RSI) indicator on the 4-hour chart climbed above 70, suggesting that EUR/USD could correct lower before extending its uptrend. On the upside, 1.0440 (Fibonacci 61.8% retracement of the latest downtrend) aligns as immediate resistance. If the pair rises above this level and starts using it as support, it could target 1.0500-1.0510 (round level, Fibonacci 78.6% retracement) and 1.0550 (static level) next.
Looking south, the first support level could be spotted at 1.0400 (100-period Simple Moving Average (SMA), Fibonacci 50% retracement) ahead of 1.0355-1.0350 (Fibonacci 38.2% retracement, 200-period SMA).
Tariffs are customs duties levied on certain merchandise imports or a category of products. Tariffs are designed to help local producers and manufacturers be more competitive in the market by providing a price advantage over similar goods that can be imported. Tariffs are widely used as tools of protectionism, along with trade barriers and import quotas.
Although tariffs and taxes both generate government revenue to fund public goods and services, they have several distinctions. Tariffs are prepaid at the port of entry, while taxes are paid at the time of purchase. Taxes are imposed on individual taxpayers and businesses, while tariffs are paid by importers.
There are two schools of thought among economists regarding the usage of tariffs. While some argue that tariffs are necessary to protect domestic industries and address trade imbalances, others see them as a harmful tool that could potentially drive prices higher over the long term and lead to a damaging trade war by encouraging tit-for-tat tariffs.
During the run-up to the presidential election in November 2024, Donald Trump made it clear that he intends to use tariffs to support the US economy and American producers. In 2024, Mexico, China and Canada accounted for 42% of total US imports. In this period, Mexico stood out as the top exporter with $466.6 billion, according to the US Census Bureau. Hence, Trump wants to focus on these three nations when imposing tariffs. He also plans to use the revenue generated through tariffs to lower personal income taxes.
Although today’s decline triggered a breakdown below Tuesday’s bearish shooting star candlestick pattern, the bullish reaction today may negate that signal. Nonetheless, near-term price levels look relatively clear. Today’s low of $2,864 is short term support. If broken to the downside the trendline will also have failed to retain support and lower prices become targets.
This week’s low at $2,853 is a key price level as it is part of a series of six consecutive weeks of higher weekly highs and higher weekly lows. A change in that bullish weekly pattern may provide a clue to That bullish pattern may begin to change once that pattern starts to change.
On the upside, a breakout above today’s high of $2,909 will show strength, but Monday’s high of $2,912 should also be considered. It was resistance on Monday, which had the highest historical closing price at $2,907. Tuesday’s record high in gold was $2,943.
The advance completed a couple targets there were derived from Fibonacci extension and projection targets. Therefore, resistance was seen in a price area that could lead to a pullback. Nonetheless, if the $2,943 high is exceeded higher targets start with $2,961, followed by $2,982.
Furthermore, notice that there is a trendline across the top of a large parallel trend channel. The line was confirmed with the recent swing high at $2,790. It also shows the possibility of higher prices if Tuesday’s high can be exceeded.

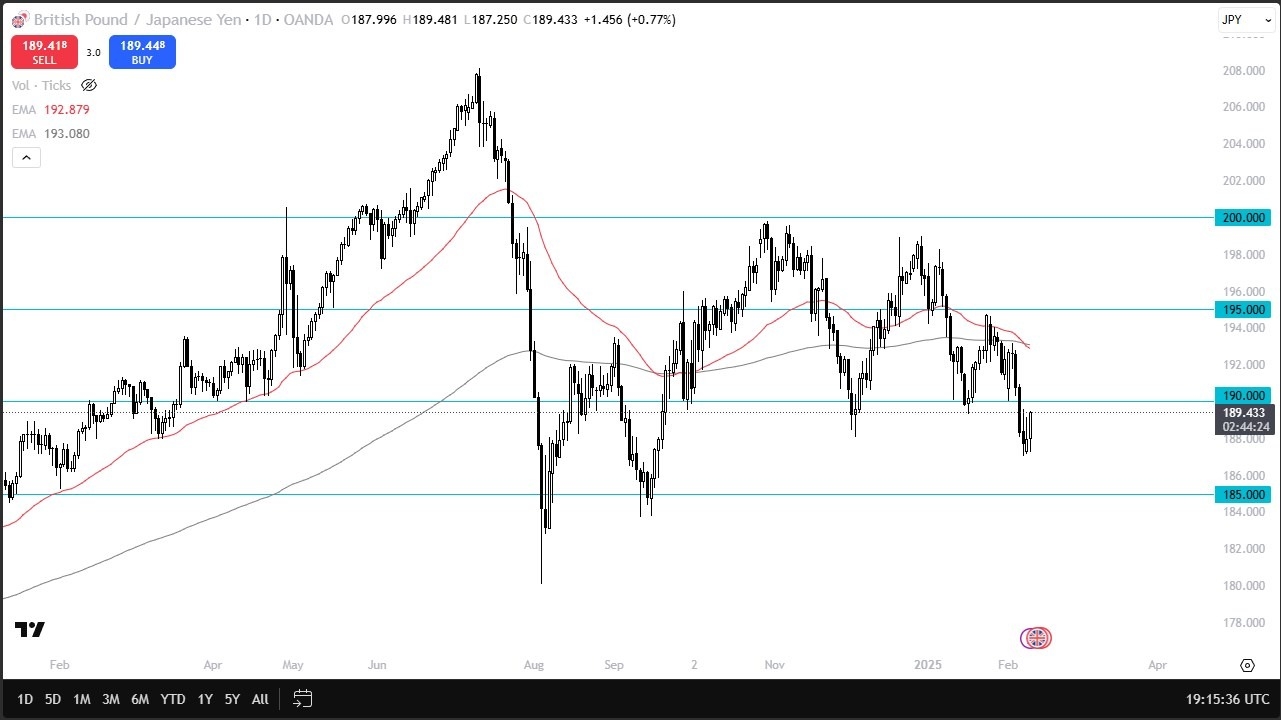
In that environment, I think you have to look at the market through a potential melt up. I don’t have any interest in trying to get too cute here. I think it’s a simple matter of waiting to see if we can break above that 190 yen level on a daily close if we can then I think that’s a very positive sign if we can’t, then it shows that we are going to pull back and go looking at the 188 yen level again. In general, I don’t necessarily like jumping into the market right here, I want to see what the reaction is to this major inflection point.
I think ultimately, you’ve got a scenario where a lot of traders will be looking at this through the idea of whether or not we can continue to go higher or if the exhaustion comes back into the picture, because the interest rate differential does favor the British pound, but it also is a scenario where the Bank of England just cut rates and they look like they’re going to continue to cut rates while the Japanese central bank of course is now starting to worry about fighting inflation. So definitely at this point in time we are at a major inflection point, but you need to watch this 190 yen level for clues.
Ready to trade our daily Forex analysis? We’ve made a list of the best forex demo accounts worth trading with.
Silver price ended yesterday above 31.63$ level and the negative pressure that it witnessed in the previous sessions, to keep the bullish trend scenario active for the upcoming period, organized inside the bullish channel that appears on the chart, supported by the EMA50 that carries the price from below.
For inquiries, Contact Us.
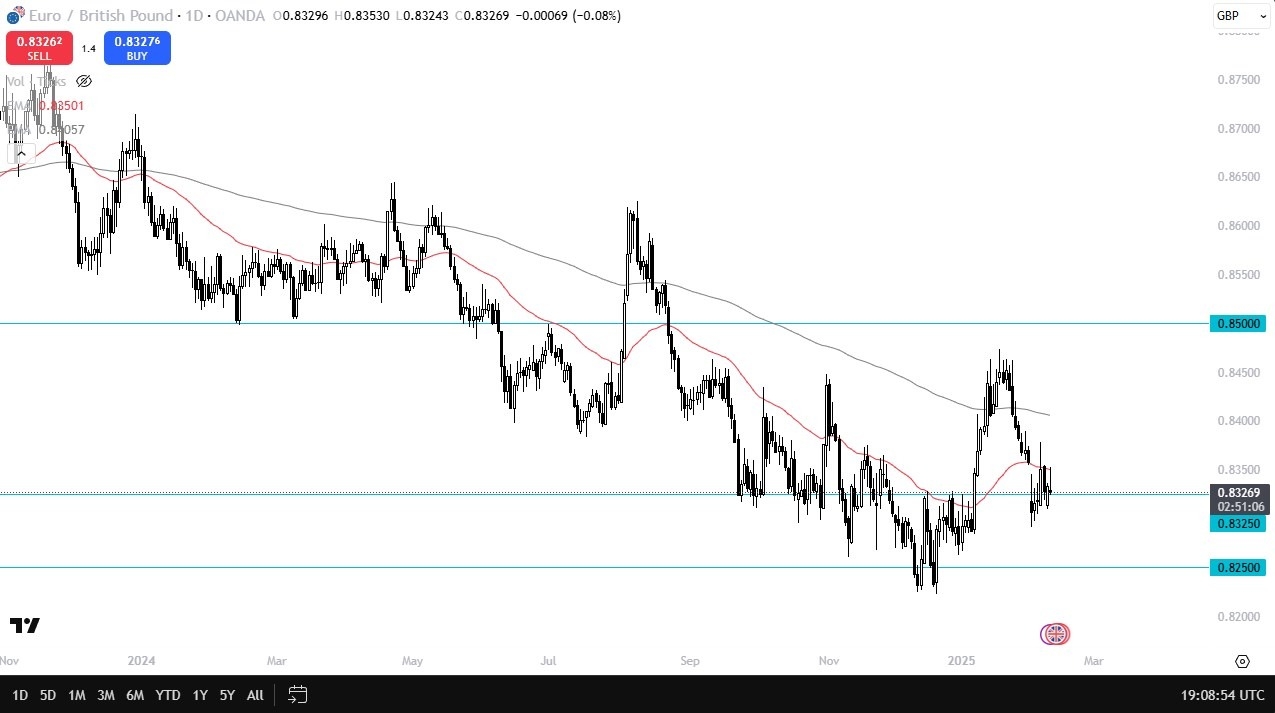
Well, I don’t know if they will, but I do know that when you look at two currencies, it is a relative game. The question now is which one is going to end up being the victor of the two? Well, when you look at this pair, you can see we’ve been in a downtrend for some time. But it’s also worth noting that the 0.8250 level is an area of significant support. So, I think this remains more or less a choppy market, but I do favor fading short term rallies that show signs of exhaustion as the market is most decidedly heavy.
The 50 day EMA has attracted some attention. And I think at this point in time, if we do break down from here, we could revisit that 0.8 to five zero level. On the other hand, if we can turn around and break above the 0.8375 level, we could challenge the 200 day EMA, followed by the 0.8460 level. This is a market that tends to be very choppy and noisy, so you have to pay attention to your trades on a short-term basis because it doesn’t move very much most of the time. However, keep in mind that the PIP value is much higher than most currency pairs, so it doesn’t need to. At this point, I still favor shorting, at least for now, but I do believe that we are getting close to some type of bottoming pattern. Expect a lot of choppiness going forward.
Ready to trade our daily forecast and analysis? Here’s a list of some of the top forex brokers UK to check out
A daily close above the 50-Day line is bullish and may provide a clue that indicates further underlying strength in the price of natural gas. Also, the 38.2% Fibonacci retracement level at $3.51 was exceeded for the second time today and a strong close above that price level looks likely. However, today’s rise was the first test of resistance around the 20-Day MA since the drop below it on January 27. Resistance has been seen but whether it can be sustained remains to be seen. Given the signs of underlying strength, a reclaim of the 20-Day MA may be possible before a pullback.
If the 20-Day MA can be reclaimed, the next higher target zone is from around $3.64 to $3.69. That price zone consists of the prior swing high and peak for 2023 at $3.64, a 50% retracement level at $3.67, and a 127.2% extended target for a small rising ABCD pattern (not shown). The initial target for the ABCD pattern was completed at $3.58.
Now that the 20-Day line has fallen to converge with the $3.58, the $3.58 price zone takes on greater potential significance. Since a breakout above the 2023 high of $3.64 provided a new bullish trend reversal signal for the long-term trend in late-December, it is a key price level. A rise above it would be bullish, and especially a daily close above it.
Last week’s price range and likely this week as well are within the price range from two weeks ago from $2.99 to $3.83. Since the low end of the price range was tested as support with last week’s low, an upswing to test resistance near the week’s high could be in process.
For a look at all of today’s economic events, check out our economic calendar.
The USD/JPY rallied sharply on Wednesday after a hot US inflation report spurred a jump in the US 10-year Treasury yield, closely correlated with the major. Hence, the pair aimed higher, clearing the 153.00 and 154.00 figures on their way toward current spot prices, near 154.50.
The USD/JPY enjoyed an over 1% rally on Wednesday after clearing the 200-day Simple Moving Average (SMA) at 152.76, opening the door for further upside. Despite this, the pair found stir resistance at the Kijun-sen at 154.90 before consolidating near the 154.50 area,
Despite this, the pair is neutral to downward biased after registering a successive series of lower highs and lower lows. If bulls want to regain control, the USD/JPY must clear the 50-day SMA at 155.26, followed by the latest cycle high of 155.89.
On the other hand, a drop below 154.00 would expose the Senkou Span B at 153.76, followed by the 153.00 figure and the 200-day SMA at 152.76.
The table below shows the percentage change of Japanese Yen (JPY) against listed major currencies today. Japanese Yen was the strongest against the Australian Dollar.
| USD | EUR | GBP | JPY | CAD | AUD | NZD | CHF | |
|---|---|---|---|---|---|---|---|---|
| USD | 0.05% | 0.03% | 0.00% | 0.03% | 0.06% | 0.05% | 0.03% | |
| EUR | -0.05% | -0.02% | -0.05% | -0.02% | -0.01% | 0.00% | -0.02% | |
| GBP | -0.03% | 0.02% | -0.04% | 0.00% | 0.03% | 0.02% | -0.00% | |
| JPY | 0.00% | 0.05% | 0.04% | 0.03% | 0.06% | 0.05% | 0.03% | |
| CAD | -0.03% | 0.02% | -0.00% | -0.03% | 0.02% | 0.02% | -0.00% | |
| AUD | -0.06% | 0.01% | -0.03% | -0.06% | -0.02% | -0.01% | -0.03% | |
| NZD | -0.05% | -0.01% | -0.02% | -0.05% | -0.02% | 0.00% | -0.02% | |
| CHF | -0.03% | 0.02% | 0.00% | -0.03% | 0.00% | 0.03% | 0.02% |
The heat map shows percentage changes of major currencies against each other. The base currency is picked from the left column, while the quote currency is picked from the top row. For example, if you pick the Japanese Yen from the left column and move along the horizontal line to the US Dollar, the percentage change displayed in the box will represent JPY (base)/USD (quote).
Home Depot’s stock price (HD) rose in the intraday levels, after leaning on the support of the 50-day SMA, lending the stock positive momentum, amid the dominance of the main upward trend, while trading alongside the secondary short-term trend line, with positive signals from the RSI after reaching oversold levels.
Therefore we expect more gains for the stock, targeting the pivotal resistance of $440.97, provided the support of $401.76 holds on.
Trend forecast for today: Bullish
Spot Gold recovered from an intraday low of $2,863.61 and trades above the $2,900 mark in the mid-American session. Financial markets are quite volatile in the second half of the day after multiple key headlines coming from the United States (US).
On the one hand, the country released the Consumer Price Index (CPI), which rose by 3.0% in January compared to a year earlier. The core annual reading printed at 3.3% vs. the expected 3.1%, while, on a monthly basis, the CPI rose 0.5%, higher than the 0.4% posted in December. All figures were above expectations, immediately triggering demand for the safe-haven US Dollar (USD) amid speculation the US Federal Reserve (Fed) will further delay any potential interest rate cut.
The XAU/USD pair fell to the aforementioned low, yet the slide was limited amid Gold’s safe-haven condition. The pair recovered as Fed Chairman Jerome Powell testified before Congress. Powell tried to put things back in balance by noting that the economy is “close, but not there” on inflation. Additionally, he repeated that the central bank makes its decisions based on the economy’s performance. Finally, he said that policymakers want to keep the monetary policy restrictive for now while acknowledging that it is possible officials will have to move the policy rate on tariffs.
Somehow, Wall Street managed to reverse part of its early losses with Powell, putting pressure on the USD and helping XAU/USD recover its bullish pose.
From a technical point of view, the daily chart for XAU/USD shows overbought conditions persist, yet there are no clear signs of an upcoming slide. Technical indicators have turned flat within extreme levels and even aim marginally higher. At the same time, XAU/USD develops far above all its moving averages, with the 20 Simple Moving Average (SMA) heading firmly north at around $2,798.00 while far above the 100 and 200 SMAs.
In the near term, and according to the 4-hour chart, Gold is bullish. XAU/USD is advancing, breaking above a bullish 20 SMA, while the intraday dip has stalled far above a bullish 100 SMA. The Momentum indicator pared it slide around its 100 line but holds around it. However, the Relative Strength Index (RSI) indicator has already changed course and aims north at around 59, supporting another leg north.
Support levels: 2,883.50 2,872.30 2,855.45
Resistance levels: 2,911.60 2,925.00 2,940.00