The main category of Forex News.
You can use the search box below to find what you need.
[wd_asp id=1]
The main category of Forex News.
You can use the search box below to find what you need.
[wd_asp id=1]
Gold price (XAU/USD) extends the rally to around $2,865 during the early Asian session on Monday. The precious metal edges higher as escalating trade tensions prompt investors to seek refuge in the safe-haven asset.
US President Donald Trump said on Friday that he plans to announce reciprocal tariffs on many countries by Tuesday or Wednesday, which will take effect almost immediately. This, in turn, provides some support to the yellow metal. Investors will closely monitor the developments surrounding trade war threat. “Central focus of the gold market continues to be the uncertainty in regard to the Trump tariff policies,” said David Meger, director of metals trading at High Ridge Futures.
Furthermore, the People’s Bank of China (PBOC) added gold to its reserves in January for a third month, boosting the Gold price as China is the world’s largest gold consumer. China’s gold reserves were 73.45 million fine troy ounces at the end of January, up from 73.29 million a month earlier. “The PBOC will likely continue to diversify its reserves in the longer term, given the rising geopolitical uncertainty,” said David Qu, an economist at Bloomberg Economics.
On the other hand, data released by the Labor Department on Friday suggested the labor market remains strong, which might prevent the Federal Reserve (Fed) from cutting its interest rate. The US economy added 143,000 jobs in January, compared with a rise of 170,000 expected by economists. Meanwhile, the Unemployment Rate ticked lower to 4.0% versus 4.1% prior, compared with expectations of 4.1%. Traders are now expecting the US central bank to cut interest rates just one time this year. This might lift the Greenback and weigh on the USD-denominated commodity price.
Gold has played a key role in human’s history as it has been widely used as a store of value and medium of exchange. Currently, apart from its shine and usage for jewelry, the precious metal is widely seen as a safe-haven asset, meaning that it is considered a good investment during turbulent times. Gold is also widely seen as a hedge against inflation and against depreciating currencies as it doesn’t rely on any specific issuer or government.
Central banks are the biggest Gold holders. In their aim to support their currencies in turbulent times, central banks tend to diversify their reserves and buy Gold to improve the perceived strength of the economy and the currency. High Gold reserves can be a source of trust for a country’s solvency. Central banks added 1,136 tonnes of Gold worth around $70 billion to their reserves in 2022, according to data from the World Gold Council. This is the highest yearly purchase since records began. Central banks from emerging economies such as China, India and Turkey are quickly increasing their Gold reserves.
Gold has an inverse correlation with the US Dollar and US Treasuries, which are both major reserve and safe-haven assets. When the Dollar depreciates, Gold tends to rise, enabling investors and central banks to diversify their assets in turbulent times. Gold is also inversely correlated with risk assets. A rally in the stock market tends to weaken Gold price, while sell-offs in riskier markets tend to favor the precious metal.
The price can move due to a wide range of factors. Geopolitical instability or fears of a deep recession can quickly make Gold price escalate due to its safe-haven status. As a yield-less asset, Gold tends to rise with lower interest rates, while higher cost of money usually weighs down on the yellow metal. Still, most moves depend on how the US Dollar (USD) behaves as the asset is priced in dollars (XAU/USD). A strong Dollar tends to keep the price of Gold controlled, whereas a weaker Dollar is likely to push Gold prices up.
February 9, 2025 – Written by David Woodsmith
STORY LINK GBP/USD Forecast: Dollar Survives US Jobs Test, Pound Blocked at $1.2500
The dollar dipped in immediate reaction to the latest US employment report, but quickly regained ground amid firmer underlying data and a smaller than expected benchmark revision.
At this stage, markets do not expect US interest rates will be cut below UK rates over the remainder of this year.
The Pound to Dollar (GBP/USD) exchange rate spiked to near 1.2500 before a rapid retreat to 1.2425.
The Pound to Euro (GBP/EUR) exchange rate settled just below the 1.2000 level amid position adjustment into the weekend.
US non-farm payrolls increased 143,000 for January compared with consensus forecasts of around 170,000, although there was a significant upward revision to the December gain to 307,000 compared with the flash reading of 256,000.
The unemployment rate edged lower to 4.0% from 4.1% previously.
Average hourly earnings increased 0.5% on the month compared with expectations of 0.3% with the annual increase holding at 4.1%.

The BLS also announced annual benchmark revisions with a decline in payrolls of 598,000 over the year, although this was below market expectations of around 800,000.
According to Peter Cardillo, Chief Market Economist at Spartan Capital Securities; “Basically, it’s a report that raises inflation and inflation fears. It means the Fed will probably continue with its wait-and-see attitude, and that wait-and-see might actually have to be longer than perhaps what the market is expecting.”
Markets consider that the chances of a rate cut by June are only just above 50% with the most likely outcome only one cut this year.
MUFG commented; “if there is a knee-jerk drop in yields and the dollar on a weaker print, the one-off risks that may have impacted the data and the FOMC’s strong stance for a pause suggests to us that the move could quickly reverse.”
Domestically, Bank of England MPC member Pill stated that there is an on-going disinflation process in the UK, but added that pay disinflation was not as strong as thought in November.
As far as inflation is concerned, Pill stated that he was optimistic that an upward blip in inflation this year will not lead to second-round effects, but he did state that the bank needed to be vigilant.
He pointed to stagflation risks with comments that underlying pressures remain elevated, but that activity is weaker than expected.
Pill sees scope for gradual and careful rate cuts and he stated that this acts against cutting rates by 50 basis-point increments.
Following Pill’s comments, markets were slightly more cautious over the outlook for three rate cuts this year.
Scotiabank still expressed some reservations over the UK outlook; “BoE forecasts for weak growth and higher inflation may add to concerns that Chancellor Reeves fiscal plans may be disrupted by the sluggish economy.”
International Money Transfer? Ask our resident FX expert a money transfer question or try John’s new, free, no-obligation personal service! ,where he helps every step of the way,
ensuring you get the best exchange rates on your currency requirements.
TAGS: Pound Dollar Forecasts
Economic data from Japan, including wage growth and household spending, have intensified market expectations for a BoJ policy move. Traders should now turn their attention to upcoming data releases, including machine tool orders and producer prices, which may offer more clues on Japan’s economic outlook.
On February 12, machine tool orders will provide insights into Japan’s industrial demand environment. Economists forecast orders to rise 1.6% year-on-year in January, down from 11.2% in December.
A smaller-than-expected increase may signal a pullback in business investment and industrial production. Downward trends could indicate weaker employment across the manufacturing sector, potentially affecting wage growth. Softer wage growth could curb consumer spending and dampen demand-driven inflationary pressures.
Conversely, larger-than-expected demand for tools could suggest robust production, supporting the labor market and wage growth, a key metric for the BoJ.
While economists consider machine tool orders a barometer of Japan’s manufacturing sector, producer prices will likely impact the USD/JPY pair more. Producer prices are a leading indicator of inflation since producers adjust prices according to demand.
Economists expect producer prices to rise 4% year-on-year in January, up from 3.8% in December.
The GBPCAD price lost the positive momentum recently after reaching 1.8160 level, to activate the correctional bearish track and achieve some gains by declining towards 1.7850, approaching the additional support at 1.7800.
Note that holding within the bullish channel and the consolidation of the MA55 near the mentioned additional support line will reinforce the chances of renewing the bullish attempts, to expect rallying towards 1.7980 soon, followed by attempting to renew the pressure on 1.8070 obstacle.
The expected trading range for today is between 1.7865 and 1.7980
Trend forecast: Bullish
The GBP/USD weekly forecast indicates a brief respite for the pound as Trump’s policies weaken the dollar.
The GBP/USD pair had a bullish week despite a rate cut by the Bank of England. The rally came from a decline in the dollar after Trump paused tariffs on Canadian and Mexican goods.
–Are you interested in learning more about STP brokers? Check our detailed guide-
On Tuesday, the dollar collapsed when a 25% tariff meant for Canada and Mexico failed to take off. The two countries negotiated better trade deals, giving them more time. Meanwhile, the Bank of England lowered borrowing costs but emphasized the need for caution due to high inflation. Finally, data on Friday showed a mixed picture of the US labor sector, with both jobs and the unemployment rate easing.

Next week, market participants will focus on inflation and retail sales data from the US. Meanwhile, the UK will release figures on manufacturing production and GDP. The US consumer inflation report will shape the outlook for Fed rate cuts.
In the previous month, the core CPI figure missed forecasts, indicating soft underlying price pressures. As a result, the dollar fell as rate cut expectations rose. Another month of cooler-than-expected inflation might further weigh on the dollar.
Meanwhile, the UK GDP report will show the state of the UK economy, which has been slowing down.
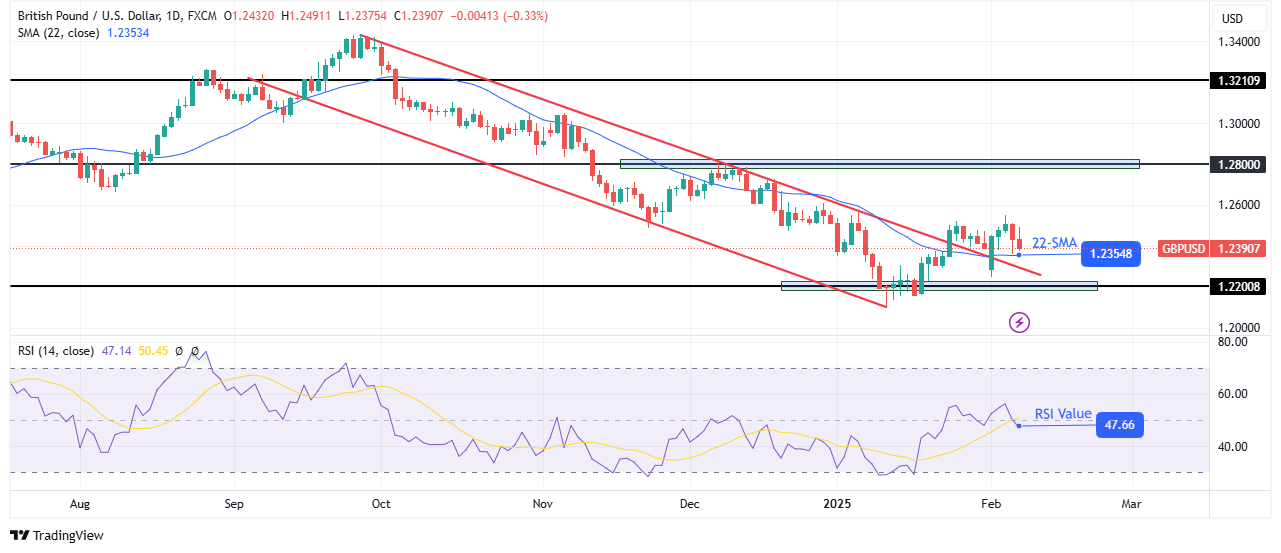
On the technical side, the GBP/USD price has broken out of its bearish channel, indicating a bullish shift in sentiment. The price now trades slightly above the 22-SMA, showing bulls are in the lead. However, the RSI remains slightly below 50, a sign that bearish momentum is still strong.
–Are you interested in learning more about making money with forex? Check our detailed guide-
GBP/USD has maintained a strong downtrend, making lower highs and lows and breaking past key support levels. However, bears paused when the price hit the 1.2200 support level. Here, price action showed small-bodied candles with large wicks, indicating indecision.
After that, bulls took charge by breaking above the channel resistance and the 22-SMA resistance. The price is currently retesting the SMA as support. If bulls remain in the lead, the price will climb to the 1.2800 resistance. A break above this resistance would confirm a new bullish trend.
Looking to trade forex now? Invest at eToro!
68% of retail investor accounts lose money when trading CFDs with this provider. You should consider whether you can afford to take the high risk of losing your money.
The USD/JPY weekly forecast is bearish amid increasing bets for a Bank of Japan rate hike, boosting the yen.
The USD/JPY pair ended the week lower as the yen rallied against the dollar due to a surge in BoJ rate hike expectations. At the same time, a pause in US tariffs weakened the greenback.
–Are you interested in learning more about STP brokers? Check our detailed guide-
BoJ rate hike bets rose after Japan released data showing solid wage growth.
Meanwhile, the dollar eased as market participants became more convinced that Trump’s tariffs were just a negotiation tactic. He paused tariffs on Canada and Mexico, plunging the dollar. Additionally, employment figures revealed a drop in job growth and lower unemployment, painting a mixed picture of the labor sector.
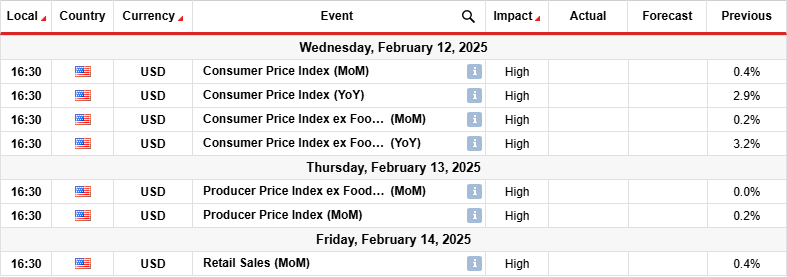
Next week, traders will focus on data from the US, including consumer inflation, producer inflation and retail sales. The inflation figures will show the state of price pressures, shaping the outlook for Fed rate cuts.
Last month, inflation came in at 2.9%, nearing the Fed’s 2% target. However, policymakers have remained cautious because it has paused near this level. As a result, the central bank has been waiting for more progress before signaling further rate cuts. Meanwhile, the retail sales report will show the state of consumer spending in the US.
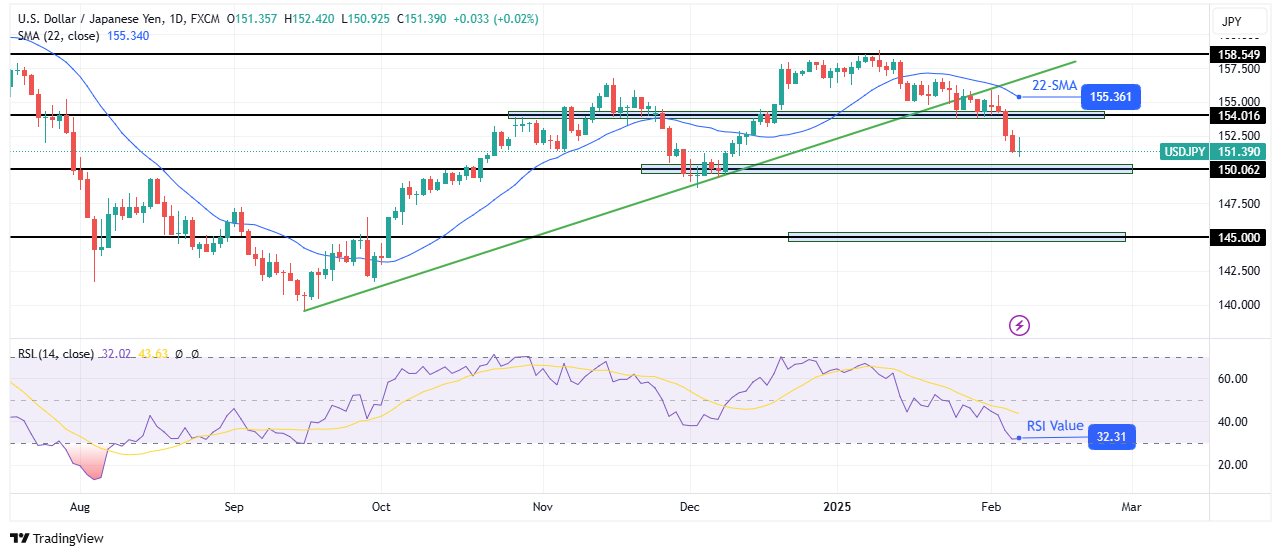
On the technical side, the USD/JPY price is approaching the 150.06 support level after breaking below its bullish trendline. The price trades far below the 22-SMA, showing a strong lead for bears. At the same time, the RSI trades near the oversold region, indicating solid bearish momentum.
–Are you interested in learning more about making money with forex? Check our detailed guide-
Bulls paused the previous move when the price got to the 158.54 resistance level. Moreover, although the price made higher highs and lows, it broke below the 22-SMA, indicating a corrective move. At the same time, the RSI failed to enter the overbought region, a sign that either bulls were holding back, or bears were strong too.
After the corrective move, USD/JPY might make an impulsive leg. Therefore, the price might break below the 150.06 support to reach the 145.00 support. However, the price might retest the 22-SMA as resistance before continuing lower.
Looking to trade forex now? Invest at eToro!
68% of retail investor accounts lose money when trading CFDs with this provider. You should consider whether you can afford to take the high risk of losing your money.
Crude oil price continued to decline to press on 71.00$ barrier and attempts to break it, noticing that the price begins today with bullish bias affected by the RSI positivity, and it might achieve some intraday gains before attempting to decline again.
Are you looking for more exclusive insights and analysis? Join Economies.com VIP Club Channel on Telegram and get access to:
Subscribe now to our channel on Telegram and join the Economies VIP Club to get ahead in the market. Limited Spots Available.
For inquiries about how to register, contact us through this link.
As noted in prior articles, price action in natural gas since the January 31 swing low at $2.99 has been contained within last week’s price range. Last week ended with a wide range red candlestick pattern. Trading inside that range can lead to price behavior like what is seen inside a consolidation range. Choppy price action with unreliable follow-through is common. Therefore, it can be helpful to know what patterns are forming and evolving and the key price levels to pay attention to.
In the near-term, natural gas is in the process of advancing from the $2.99 swing low. Since then, it has formed a small rising ABCD pattern (light blue) as Thursday’s high generated a higher swing high (above B) and therefore a bullish trend continuation signal. Despite today’s bearish performance, if natural gas stays above the interim swing low at $3.16 the price structure of the ABCD pattern remains intact and a continuation higher is anticipated. That expectation would change on a drop below $3.16 as that would violate the integrity of the ABCD pattern of higher swing highs and higher swing lows.
An initial upside target from the pattern points to $3.58. That is in the middle between two of the major moving averages. The 50-Day MA is at $3.52 and the 20-Day is at 3.65. Each line previously identified trend support, following the upside gap on October 29. During the subsequent advance the 50-Day line did a better job of holding as support until it was broken during the sharp drop on January 28. Therefore, it presents a potentially more significant price area, and it could stop an advance and lead to a bearish reversal. Watch and observe the behavior of natural gas around the 50-Day line, with this possibility in mind.
For a look at all of today’s economic events, check out our economic calendar.
Wheat price rallied upwards strongly yesterday to succeed achieving our waited target at 599.00$, which represents 38.2% Fibonacci correction level for the entire decline measured from 728.30$ to 519.10$, which means that breaching it will push the price to achieve additional bullish correction that its next target reaches 623.70$.
Are you looking for more exclusive insights and analysis? Join Economies.com VIP Club Channel on Telegram and get access to:
Subscribe now to our channel on Telegram and join the Economies VIP Club to get ahead in the market. Limited Spots Available.
For inquiries about how to register, contact us through this link.
Silver price (XAG/USD) climbs to near $32.40 in European trading hours on Friday. The white metal gains as the US Dollar (USD) and bond yields tick lower ahead of the United States (US) Nonfarm Payrolls (NFP) data for January, which will be published at 13:30 GMT.
Investors will focus on employment data to gauge the Federal Reserve’s (Fed) monetary policy outlook. On Thursday, Dallas Fed Bank President Lorie Logan said she would support holding interest rates at their current levels until the “labor market doesn’t falter.”
The US NFP report is expected to show that 170K fresh workers were added to the labor force in January, fewer than 256K in December. The Unemployment Rate is estimated to have remained steady at 4.1%. Signs of strong labor demand would boost market expectations that the Fed will keep interest rates in their current range of 4.25%- 4.50% for longer. Such a scenario would be unfavorable for the Silver price.
Investors will also focus on the Average Hourly Earnings data, which is a key measure of wage growth. On year, the wage growth measure is expected to have decelerated to 3.8% from 3.9% in December.
Ahead of the US NFP, the US Dollar Index (DXY), which tracks the Greenback’s value against six major currencies, trades subduedly around 107.70. 10-year US Treasury yields tick lower to near 4.43%.
Silver price strives to break above the immediate resistance of $32.50, which is plotted from the December 9 high. The outlook of the white metal remains bullish as the 20-day Exponential Moving Average (EMA) is sloping higher near $30.90.
The 14-day Relative Strength Index (RSI) oscillates in the 60.00-80.00 range, suggesting that the momentum is bullish.
Looking down, the upward-sloping trendline from the August 8 low of $26.45 will be the key support for the Silver price around $29.50. While, the October 31 high of $33.90 will be the key barrier.
Silver is a precious metal highly traded among investors. It has been historically used as a store of value and a medium of exchange. Although less popular than Gold, traders may turn to Silver to diversify their investment portfolio, for its intrinsic value or as a potential hedge during high-inflation periods. Investors can buy physical Silver, in coins or in bars, or trade it through vehicles such as Exchange Traded Funds, which track its price on international markets.
Silver prices can move due to a wide range of factors. Geopolitical instability or fears of a deep recession can make Silver price escalate due to its safe-haven status, although to a lesser extent than Gold’s. As a yieldless asset, Silver tends to rise with lower interest rates. Its moves also depend on how the US Dollar (USD) behaves as the asset is priced in dollars (XAG/USD). A strong Dollar tends to keep the price of Silver at bay, whereas a weaker Dollar is likely to propel prices up. Other factors such as investment demand, mining supply – Silver is much more abundant than Gold – and recycling rates can also affect prices.
Silver is widely used in industry, particularly in sectors such as electronics or solar energy, as it has one of the highest electric conductivity of all metals – more than Copper and Gold. A surge in demand can increase prices, while a decline tends to lower them. Dynamics in the US, Chinese and Indian economies can also contribute to price swings: for the US and particularly China, their big industrial sectors use Silver in various processes; in India, consumers’ demand for the precious metal for jewellery also plays a key role in setting prices.
Silver prices tend to follow Gold’s moves. When Gold prices rise, Silver typically follows suit, as their status as safe-haven assets is similar. The Gold/Silver ratio, which shows the number of ounces of Silver needed to equal the value of one ounce of Gold, may help to determine the relative valuation between both metals. Some investors may consider a high ratio as an indicator that Silver is undervalued, or Gold is overvalued. On the contrary, a low ratio might suggest that Gold is undervalued relative to Silver.