The main category of Forex News.
You can use the search box below to find what you need.
[wd_asp id=1]
The main category of Forex News.
You can use the search box below to find what you need.
[wd_asp id=1]
The EURUSD price shows bullish bias after the decline that it witnessed yesterday, to settle above the breached resistance again, which supports the chances of resuming the expected bullish trend for the upcoming period, which targets testing 1.0455$, reminding you that breaching it will push the price towards 1.0600$ as a next main target.
Are you looking for more exclusive insights? Join Economies.com VIP Club Channel on Telegram and get access to:
Subscribe now to our channel on Telegram and join the Economies VIP Club to get ahead in the market. Limited Spots Available.
Bitcoin price (BTCUSD) shows bearish bias to head towards potential test to the key support 95195.00$, which represents one of the next trend keys besides 100000.00$ resistance, and as we mentioned yesterday, the price needs to breach one of these levels to detect its next destination clearly, which makes us continue with our neutrality until now.
Are you looking for more exclusive insights? Join Economies.com VIP Club Channel on Telegram and get access to:
Subscribe now to our channel on Telegram and join the Economies VIP Club to get ahead in the market. Limited Spots Available.
It is interesting to note that a falling measured move completes at $68.52. The first measured decline began from the October swing high. Following that high the price of crude oil dropped by $12.24 or 15.5%. There will be a match in the two declines based on the price change if the $65.52 price target is reached.
Since that potential target is close to the $67.72 target, as well as the lower uptrend line, and bearish momentum is continuing, it seems like a good chance the lower price levels may eventually be reached before the current correction is complete. Moreover, crude oil could continue to fall further until it triggers a bearish breakdown on a drop below the uptrend line initially, with weakness confirmed on a drop below the $67.11 minor swing low from December 6.
Despite the potential bearish scenario, if support is seen around the 78.6% retracement area, a bounce could follow. In that situation, potential resistance would be around the 50-Day MA, now at $72.61. That price level is followed by $73.27, which was both support and resistance previously. Further up is the 200-Day MA at $74.83 and the 20-Day MA at $75.69. Keep in mind that the moving averages are dynamic and that the price represented will change.
Be aware that 200-Day MA is angled down and that the 20-Day only recently turned down after rising for approximately 35 trading days. Further, both moving averages are a little below a bottom boundary line for a large symmetrical triangle pattern. Together, these indicators show potentially significant resistance around the 20-Day MA, since it is above the 200-Day line currently.
For a look at all of today’s economic events, check out our economic calendar.
According to the forex market trading. The Japanese yen gained strong positive momentum against the rest of the major currencies amid strong signals of the Bank of Japan’s readiness to tighten. In this regard, a member of the Board of Directors of the Bank of Japan, Naoki Tamura, stated that the Japanese central bank should raise the interest rate to at least 1% in the latter part of the fiscal year 2025. Also, Finance Minister Katsunobu Kato warned that inflation may continue to rise.
Moreover, recent economic data has highlighted strong wage growth, providing momentum to expectations that the Bank of Japan will continue to raise interest rates this year. According to the results of the economic calendar data, real wages in Japan rose for the second consecutive month in December, with nominal wage growth reaching its highest level in nearly three decades, driven largely by higher winter bonuses.
For its part, the Bank of Japan raised interest rates in January and indicated its willingness to raise them further if economic trends and prices are in line with its expectations. Also, the yen’s rise was supported by broad weakness in the US dollar, lower Treasury yields, amid mixed US economic data and easing concerns about a global trade war.
The Japanese yen is one of the most prominent safe havens, and increasing uncertainty may increase its gains.

During Thursday’s trading, and through stock trading platforms, the Nikkei 225 index of Japanese stocks rose by 0.6% to close at 39066, while the broader Topix index rose by 0.25% to 2752, marking the third consecutive day of gains for Japanese stocks. Obviously, these moves followed positive trends in US stock markets on Wall Street as concerns about a global trade war eased amid cautious measures by the US and China. Nvidia and other AI-related stocks also recovered losses associated with the DeepSeek disaster.
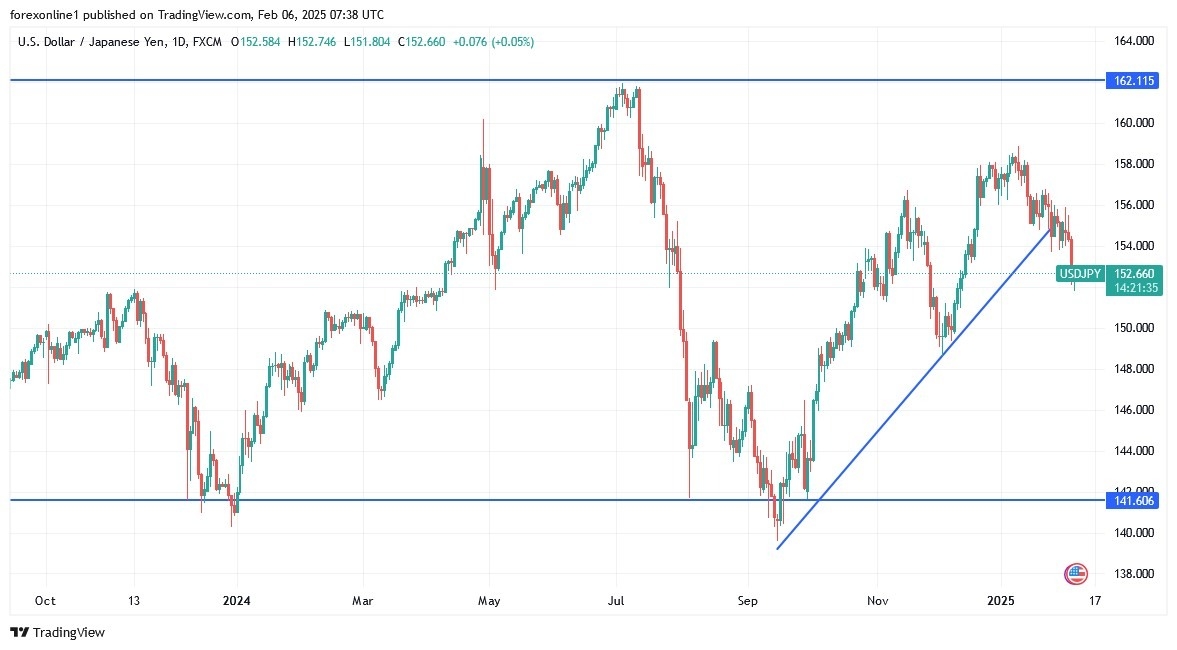
According to the daily chart, the USD/JPY pair is moving within a recently formed downward channel. Technically, the bears’ success in moving towards the psychological level of 150.00 will reinforce the downward trend, and with it the technical indicators are moving towards strong oversold levels. We still prefer to buy USD/JPY from every downward level, but without risk, and the closest support levels currently are 151.60 and 150.90, respectively. On the other hand, and in the same time frame, moving towards and above the resistance of 156.00 will reinforce the bulls’ control over the trend again.
The currency pair will remain in a cautious wait-and-see mode until the US jobs numbers are announced, which will have a reaction to the future of the US Federal Reserve’s policies, in addition to the reaction to Trump’s continued imposition of more tariffs.
Want to trade our USD/JPY forex analysis and predictions? Here’s a list of forex brokers in Japan to check out.
The first upside target is shown on the chart at $3.51 to $3.52. It starts with the 38.2% Fibonacci retracement and is followed by the 50-Day MA. Note that the price represented by the 50-Day line may change slightly before it is reached. Also, be aware of the internal downtrend line near to today’s price action.
Although it may not provide a clear price to gauge from, it can help as a guide. The next more significant potential resistance zone above the 50-Day line is around the 20-Day MA, currently at $3.67. Notice that the 20-Day line has been falling recently and has entered the price range discussed previously from the $3.64 peak in 2023, and the 50% retracement at $3.67.
An interim upside target has been added to the chart since as of today there is a higher swing high for the developing ABCD pattern (light blue) starting from the recent $2.99 low (A). The initial target from the patten is $3.58, approximately halfway between the 50-Day and 20-Day MAs. Further up is the 127.2% extended target from the pattern at $3.69. Therefore, that higher price target can be added to the price range around the 20-Day MA.
Since this week’s price action is contained with a wide range from last week, it would not be surprising to see natural gas continue to slowly advance and fill more of that range. Last week’s range goes from a low of $2.99 to a high of $3.83. Last week’s high marks the next higher potential target area above the $3.69 price level.
For a look at all of today’s economic events, check out our economic calendar.
February 6, 2025 – Written by Ben Hughes
STORY LINK Bank of England: GBP Losses vs EUR and USD, Markets Expect Three More Rate Cuts in 2025
Pound Sterling traded lower against the Euro and US Dollar into the Bank of England (BoE) decision, not helped by a weaker-than-expected reading for the construction PMI index.
Sterling dipped sharply following the BoE cut to 4.50% with markets considering that there is scope for more rate cuts this year. Markets are now pricing in around a 20% chance of a further cut in March.
Domestic and global factors will be crucial with the BoE more likely to want to wait until May.
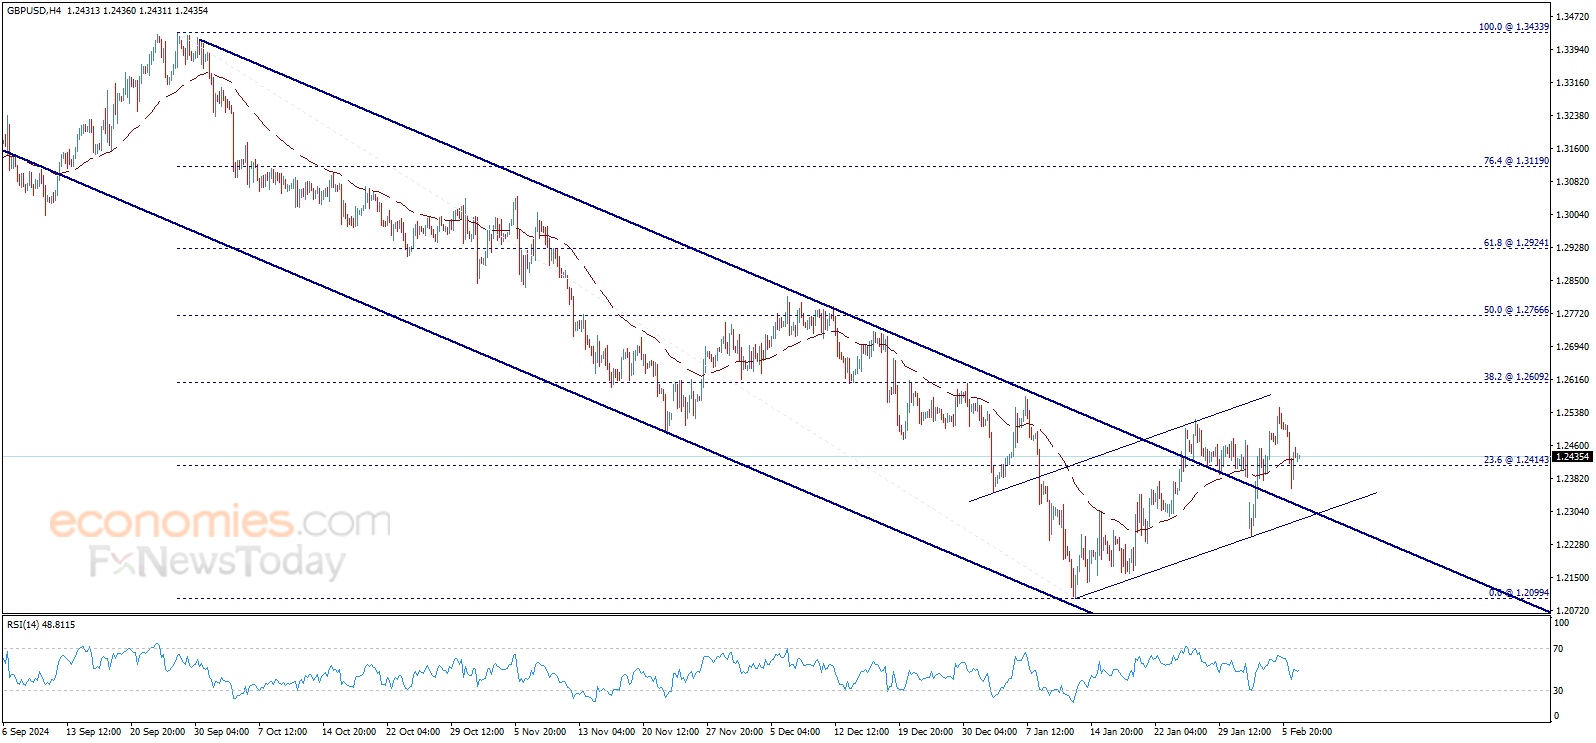
The Pound to Dollar (GBP/USD) exchange rate slumped to lows at 1.2360 before a tentative recovery to 1.2400 as the dollar pared gains and compared with 4-week highs at 1.2550 on Wednesday.
According to Scotiabank, “Short-term price action suggests a minor peak at least formed yesterday at 1.2550.”
SocGen commented, “A pullback is underway. October 2023 low of 1.2090/1.2035 is a key support zone.”
ING still expects dollar strength will help drive GBP/USD to 1.19/20 later in the year.

The Pound to Euro (GBP/EUR) exchange rate also dipped sharply to 1.1950 from 1.2000 before settling around 1.1970.
Danske Bank still recommends buying GBP/EUR dips to the 1.1900 area.
The Bank of England cut interest rates by 25 basis points to 4.50%, which was in line with expectations.
There was a surprise on the vote split with a 7-2 vote for the decision.
ING commented, “There’s nothing unusual or unexpected about the Bank of England’s decision to cut rates by 25 basis points to 4.50% this month. As for the vote split, well that’s anything but.”
Dhingra and Mann both voted for a 50 basis-point cut to 4.25%. Mann’s decision was notably surprising given her fears over inflation.
ING added, “Not only has Mann ended her fight against rate cuts, but she has doubled down with a vote to slash rates by 50bp. Though not directly attributed to Mann, the meeting minutes suggest that she saw a need to give a “clear signal” on where interest rates need to get to, whilst still recognising policy needs to stay restrictive for some time to come.”
There was a small net decline in the UK 10-year yield while the FTSE 100 index hit a record high with a daily gain of over 1.5%.
The growth forecasts were downgraded with the BoE now predicting GDP growth of 0.75% in 2025 compared with the 1.5% forecast in November.
According to Luke Bartholomew, deputy chief economist at abrdn, “The fact that two MPC members voted to deliver a bumper 50 basis-point cut, despite revising up near-term inflation forecasts, gives a sense of how concerned some policymakers are about the headwinds to growth.”
There were, however, upgrades to the 2026 and 2027 GDP growth forecasts to 1.5% from 1.25% as the budget measures take effect.
Looking at inflation, the bank warned that it is likely to rise to 3.7% over the first half of this year due to the increase in utility prices.
The forecast in 2-year times is now 2.3% from 2.2% in November.
According to the bank, “Domestic inflationary pressures are moderating, but they remain somewhat elevated, and some indicators have eased more slowly than expected.”
In this context, it commented, “the Committee will pay close attention to any consequent signs of more lasting inflationary pressures.”
Governor Bailey reiterated that the bank will take a gradual and careful approach to cuts.
According to Bailey “We expect to be able to cut bank rate further as the disinflation process continues, but we will have to judge meeting by meeting, how far and how fast.”
On the international dimension, he noted, “We live in an uncertain world, and the road ahead will have bumps on it.”
He added; “The judgment we will have to make at our future meetings is whether underlying inflationary pressures in the UK economy are easing enough to allow further cuts in bank rate.”
MUFG commented, “we expect the BoE to stick to their “gradual approach to removing monetary policy restraint” which has been consistent with a rate cut every quarter since the easing cycle started in August. We expect the BoE to deliver 100bps of easing this year.”
According to ING; Weaker growth, higher market rates and relatively limited scope to credibly trim public spending projections suggest further tax hikes are inevitable in the autumn. A more fragile jobs market and the prospect of better news on services inflation in the spring should also help cement a gradual string of rate cuts from the Bank of England this year.
Following the decision, traders are now pricing in three further rate cuts this year.
ING added, “That feels to us like the path of least resistance, though today’s vote split does suggest there’s an outside chance the Bank still moves faster.”
Investec Chief Economist Philip Shaw commented; “Fairly plainly, it is a dovish set of minutes overall and although Catherine Mann’s decision to back a 50-bp cut was a surprise, she has warned for a while that she is a supporter of monetary policy activism.”
He added, “The divergent views on the committee may make it more difficult to chart the course of interest rates over the remainder of 2025, but for now, we stand by our view that there will be three further 25bp cuts to 3.75% by the end of this year.”
According to Capital Economics, “the Bank of England showed some signs that it may cut rates faster and further than our forecast of a decline to 3.50% by early 2026.”
KPMG Chief Economist Yael Selfin expressed some caution; “The tone in the minutes signals a clear easing bias for all MPC (Monetary Policy Committee) members and leaves the door open for further interest rate cuts this year. Nonetheless, domestic uncertainty remains with the upcoming tax rises and the increase in the National Living Wage.”
She added, “The Bank will assess the second-round effects of these policy changes and whether they lead to a rebound in domestic price pressures. This will likely mean the pace of cuts will be gradual, and overall, we expect only two further cuts, leaving base rates at 4% by the end of 2025.”
Neil Birrell at Premier Miton Investors noted the structural challenges which could dampen Pound sentiment; “The Bank of England cut its base rate to give the economy a boost that is much needed. The fact that two members voted for a 0.5% cut is telling, clearly showing concern over the parlous state of economic growth, which is not something the government will appreciate.”
He added, “With growth under threat and inflation remaining higher than hoped, that provides a combination that is likely to see the word “stagflation” being banded around.”
International Money Transfer? Ask our resident FX expert a money transfer question or try John’s new, free, no-obligation personal service! ,where he helps every step of the way,
ensuring you get the best exchange rates on your currency requirements.
TAGS: Pound Sterling Forecasts
Silver (XAG/USD) attracts some sellers following an intraday uptick on Thursday and snaps a three-day winning streak to a three-month top, around the $32.55 region touched the previous day. The white metal sticks to its intraday losses and currently trades near the lower end of its daily range, around the $32.00 mark, down 0.75% for the day.
From a technical perspective, the recent breakout through the $31.00 confluence – comprising the 38.2% Fibonacci retracement level of the October-December fall and the 100-day Simple Moving Average (SMA) – was seen as a key trigger for bulls. A subsequent strength beyond the 50% retracement level, around the $31.70-$31.75 region, and positive oscillators on the daily chart validate the constructive setup.
Hence, any further slide below the $31.75-$31.70 area, or the daily swing low, could be seen as a buying opportunity. This, in turn, should help limit the downside for the XAG/USD near the $31.00 resistance breakpoint, now turned support. A convincing break below the latter, however, could make the XAG/USD vulnerable to accelerate the fall toward the $30.25 support zone en route to the $30.00 psychological mark.
On the flip side, the $32.55 area, or a multi-month peak touched on Wednesday, now seems to act as an immediate hurdle. Some follow-through buying should allow the XAG/USD to climb further towards reclaiming the $33.00 mark for the first time since early November. The said handle also represents the 61.8% Fibo. level, which if cleared decisively will set the stage for an extension of over a one-month-old uptrend.
Silver is a precious metal highly traded among investors. It has been historically used as a store of value and a medium of exchange. Although less popular than Gold, traders may turn to Silver to diversify their investment portfolio, for its intrinsic value or as a potential hedge during high-inflation periods. Investors can buy physical Silver, in coins or in bars, or trade it through vehicles such as Exchange Traded Funds, which track its price on international markets.
Silver prices can move due to a wide range of factors. Geopolitical instability or fears of a deep recession can make Silver price escalate due to its safe-haven status, although to a lesser extent than Gold’s. As a yieldless asset, Silver tends to rise with lower interest rates. Its moves also depend on how the US Dollar (USD) behaves as the asset is priced in dollars (XAG/USD). A strong Dollar tends to keep the price of Silver at bay, whereas a weaker Dollar is likely to propel prices up. Other factors such as investment demand, mining supply – Silver is much more abundant than Gold – and recycling rates can also affect prices.
Silver is widely used in industry, particularly in sectors such as electronics or solar energy, as it has one of the highest electric conductivity of all metals – more than Copper and Gold. A surge in demand can increase prices, while a decline tends to lower them. Dynamics in the US, Chinese and Indian economies can also contribute to price swings: for the US and particularly China, their big industrial sectors use Silver in various processes; in India, consumers’ demand for the precious metal for jewellery also plays a key role in setting prices.
Silver prices tend to follow Gold’s moves. When Gold prices rise, Silver typically follows suit, as their status as safe-haven assets is similar. The Gold/Silver ratio, which shows the number of ounces of Silver needed to equal the value of one ounce of Gold, may help to determine the relative valuation between both metals. Some investors may consider a high ratio as an indicator that Silver is undervalued, or Gold is overvalued. On the contrary, a low ratio might suggest that Gold is undervalued relative to Silver.
February 6, 2025 – Written by Frank Davies
STORY LINK Pound Sterling in Freefall Against Dollar and Euro Following BoE Rate Cut
The Pound US Dollar exchange rate plunged on Thursday following the Bank of England’s (BoE) latest interest rate decision.
At the time of writing, GBP/USD was trading at approximately $1.2411, up roughly 0.4% from the start of Thursday’s session.
On Thursday, the Pound (GBP) weakened against most other currencies after the Bank of England’s latest interest rate decision.
As anticipated, the central bank reduced the rate from 4.75% to 4.5%.
However, the split in the BoE’s voting and the dovish forward guidance led to expectations of further rate cuts, which put substantial pressure on the value of Sterling.
Although the US Dollar (USD) surged against the Pound on Thursday, it also gained ground against most of its peers.
This was in part driven by the release of the latest US initial jobless claims data.
The report showed an increase from 208,000 to 219,000, above the expected 213,000.
Despite a cautiously optimistic market mood and the US Dollar’s status as a primary safe-haven currency, the ‘Greenback’ strengthened
against the majority of its counterparts following the release.
Looking ahead, the main driver of movement for the Pound US Dollar exchange rate on Friday will likely be the release of several US economic data points.
First up, the US will publish its latest non-farm payrolls data for January.
If the data confirms a decrease in new job creations, it could weaken the US Dollar at the end of the week.
Additionally, the US will release its latest unemployment rate, which is expected to remain unchanged at 4.1% for the same time period.
With no UK economic data releases scheduled for Friday, GBP exchange rates may lack a clear direction by the end of the week.
International Money Transfer? Ask our resident FX expert a money transfer question or try John’s new, free, no-obligation personal service! ,where he helps every step of the way,
ensuring you get the best exchange rates on your currency requirements.
TAGS: Pound Dollar Forecasts
The US Dollar (USD) found some near-term demand on Thursday, resulting in XAU/USD retreating from record highs. The pair trades around $2,850 in the American session after hitting $2,882.35 on Wednesday. An improved market mood adds pressure on the safe-haven metal, albeit speculative interest is far from optimistic.
Trade-war tensions have been put temporarily aside but remain firm in the background as attention has shifted to first-tier events. On the one hand, the United States (US) kept publishing employment-related data ahead of the January Nonfarm Payrolls report scheduled for Friday. The country is expected to have added 170K new jobs in the month, while the Unemployment Rate is expected to hold steady at 4.1%. Employment-related data released ahead of the announcement has been tepid yet far from worrisome.
Additionally, the Bank of England (BoE) announced its monetary policy decision. The Monetary Policy Committee (MPC) trimmed the benchmark interest rates by 25 basis points (bps) to 4.50% as expected, although the dovish surprise came from policymakers, as all nine MPC members voted for a cut, with two of them favoring a 50 bps trim. Additionally, officials upwardly review their near-term inflation perspective while downgrading growth expectations for this year. The dovish tone of the BoE helped the USD maintain its near-term strength.
Looking ahead, however, demand for the bright metal is set to prevail amid continued uncertainty regarding the US tariffs’ plan.
From a technical point of view, the daily chart for XAU/USD shows that the ongoing slide could be seen as corrective. A lower low and a lower high, however, suggest a bearish extension is likely. The same chart shows that technical indicators are retreating from their recent peaks in overbought territory but with limited downward strength and still at extreme levels. At the same time, the bright metal develops above all bullish moving averages, with the 20 Simple Moving Average (SMA) currently at around $2,755.35.
The 4-hour chart anticipates another leg lower, particularly if XAU/USD slides below the intraday low at $2,833.96, although still suggesting declines would remain corrective. The pair is battling to remain above a bullish 20 SMA while the 100 and 200 SMAs head north far below the shorter one. Technical indicators, in the meantime, have corrected extreme overbought conditions and are currently approaching their midlines with firmly bearish slopes.
Support levels: 2,834.00 2,817.10 2,803.50
Resistance levels: 2,862.70 2,883.00 2,900.00
Important DisclaimersThe content provided on the website includes general news and publications, our personal analysis and opinions, and contents provided by third parties, which are intended for educational and research purposes only. It does not constitute, and should not be read as, any recommendation or advice to take any action whatsoever, including to make any investment or buy any product. When making any financial decision, you should perform your own due diligence checks, apply your own discretion and consult your competent advisors. The content of the website is not personally directed to you, and we does not take into account your financial situation or needs.The information contained in this website is not necessarily provided in real-time nor is it necessarily accurate. Prices provided herein may be provided by market makers and not by exchanges.Any trading or other financial decision you make shall be at your full responsibility, and you must not rely on any information provided through the website. FX Empire does not provide any warranty regarding any of the information contained in the website, and shall bear no responsibility for any trading losses you might incur as a result of using any information contained in the website.The website may include advertisements and other promotional contents, and FX Empire may receive compensation from third parties in connection with the content. FX Empire does not endorse any third party or recommends using any third party’s services, and does not assume responsibility for your use of any such third party’s website or services.FX Empire and its employees, officers, subsidiaries and associates, are not liable nor shall they be held liable for any loss or damage resulting from your use of the website or reliance on the information provided on this website.Risk DisclaimersThis website includes information about cryptocurrencies, contracts for difference (CFDs) and other financial instruments, and about brokers, exchanges and other entities trading in such instruments. Both cryptocurrencies and CFDs are complex instruments and come with a high risk of losing money. You should carefully consider whether you understand how these instruments work and whether you can afford to take the high risk of losing your money.FX Empire encourages you to perform your own research before making any investment decision, and to avoid investing in any financial instrument which you do not fully understand how it works and what are the risks involved.