The main category of Forex News.
You can use the search box below to find what you need.
[wd_asp id=1]
The main category of Forex News.
You can use the search box below to find what you need.
[wd_asp id=1]
January 30, 2025 – Written by Tim Boyer
STORY LINK Pound to Euro Forecast Today: GBP/EUR Steady Ahead of ECB
The Pound Sterling (GBP) held firm near its recent highs against the Euro (EUR) on Wednesday morning, with investors adopting a wait-and-see approach ahead of key events later this week.
At the time of writing, Pound Euro (GBP/EUR) exchange rate was trading at approximately €1.1937, showing little movement from Wednesday’s opening levels.
The Euro (EUR) remained flat on Wednesday as market participants refrained from making any aggressive bets ahead of the European Central Bank’s (ECB) latest interest rate decision.
The ECB is widely expected to cut interest rates by 25 basis points when it concludes its first policy meeting of 2025 on Thursday.
While the rate cut itself appears largely priced in, the Euro’s performance will likely hinge on the bank’s forward guidance.
Should ECB officials hint at further monetary easing in the months ahead, the single currency could face additional downside pressure.
Conversely, if policymakers suggest that they would prefer to hold off from further cuts for now, it may help stem losses in EUR exchange rates.

All eyes will be on ECB President Christine Lagarde’s comments, with investors seeking clarity on the central bank’s assessment of the Eurozone economy and its resilience amid ongoing global trade tensions.
The Pound (GBP) traded in a narrow range on Wednesday as UK Chancellor Rachel Reeves outlined her ambitious plans for boosting economic growth.
In her latest speech, Reeves unveiled proposals to establish a high-tech hub between Oxford and Cambridge, dubbed ‘Europe’s Silicon Valley,’ alongside renewed government backing for Heathrow’s third runway.
The government estimates these initiatives could contribute £78bn to the UK economy over the next decade.
However, Sterling’s reaction has been muted, with businesses seeming unconvinced as they still face the increased tax burden of Reeves’s previous Budget.
The ECB’s policy decision is expected to dominate the movement in the Pound to Euro exchange rate on Thursday.
However, before the ECB announcement, the Euro could come under pressure from the Eurozone’s fourth-quarter GDP figures.
Economists predict growth slowed sharply, dropping from 0.4% to just 0.1%. Signs of a stalling Eurozone economy could amplify expectations for extended ECB easing, potentially dragging the Euro lower.
Meanwhile, the absence of major UK economic data through the second half of the week may leave the Pound’s movements tied to broader market sentiment.
International Money Transfer? Ask our resident FX expert a money transfer question or try John’s new, free, no-obligation personal service! ,where he helps every step of the way,
ensuring you get the best exchange rates on your currency requirements.
TAGS: Pound Euro Forecasts
Natural gas price formed temporary correctional bullish wave yesterday to fluctuate above 50% Fibonacci correction level at 3.130$, attempting to cover some previous losses to settle near 3.200$.
Note that the MA55 continues to form additional barrier at 3.260$, along with stochastic consolidation within the oversold areas, these factors support the domination of the bearish bias for the near-term and medium-term period, to keep waiting to form new negative waves and target 2.970$ followed by 2.840$ levels.
The expected trading range for today is between 2.970$ and 3.200$
Trend forecast: Bearish
The GBP/USD pair was flat after the Federal Reserve left interest rates unchanged in its first interest rates of the year. It was trading at 1.2440 on Thursday morning ahead of the upcoming US GDP data.

The GBP/USD pair wavered after the Federal Reserve made its first interest rate decision of the year. In, the Federal Open Market Committee (FOMC) decided to leave interest rates unchanged at 4.50%.
The committee tweaked its statement by removing any mention of progress on inflation. This was likely a reaction to a recent report that showed that the headline Consumer Price Index (CPI) rose from 2.7% to 2.9% in December.
The Fed expects the headline inflation to take a longer period before moving back to the 2.0% target. The top inflation risks are the recent wildfires in Los Angeles that hav made most things, including housing and insurance expensive. There are also concerns that some of Donald Trump’s policies like mass deportations, tariffs, and tax cuts will lead to high inflation.
The Fed maintained the view that the economy was solid and that the labor market was making progress. As such, most analysts anticipate that the Fed will hold interest rates steady and then cut in July.
The next important GBP/USD news will be the upcoming US GDP data, which will shed more color on the state of the economy. Economists expect the data to show that the US capped a good year, growing by 2.7% in the fourth quarter.
The GBP/USD pair may remain under pressure now that analysts expect the Bank of England to be more aggressive in cutting rates this year since the economy is slowing.
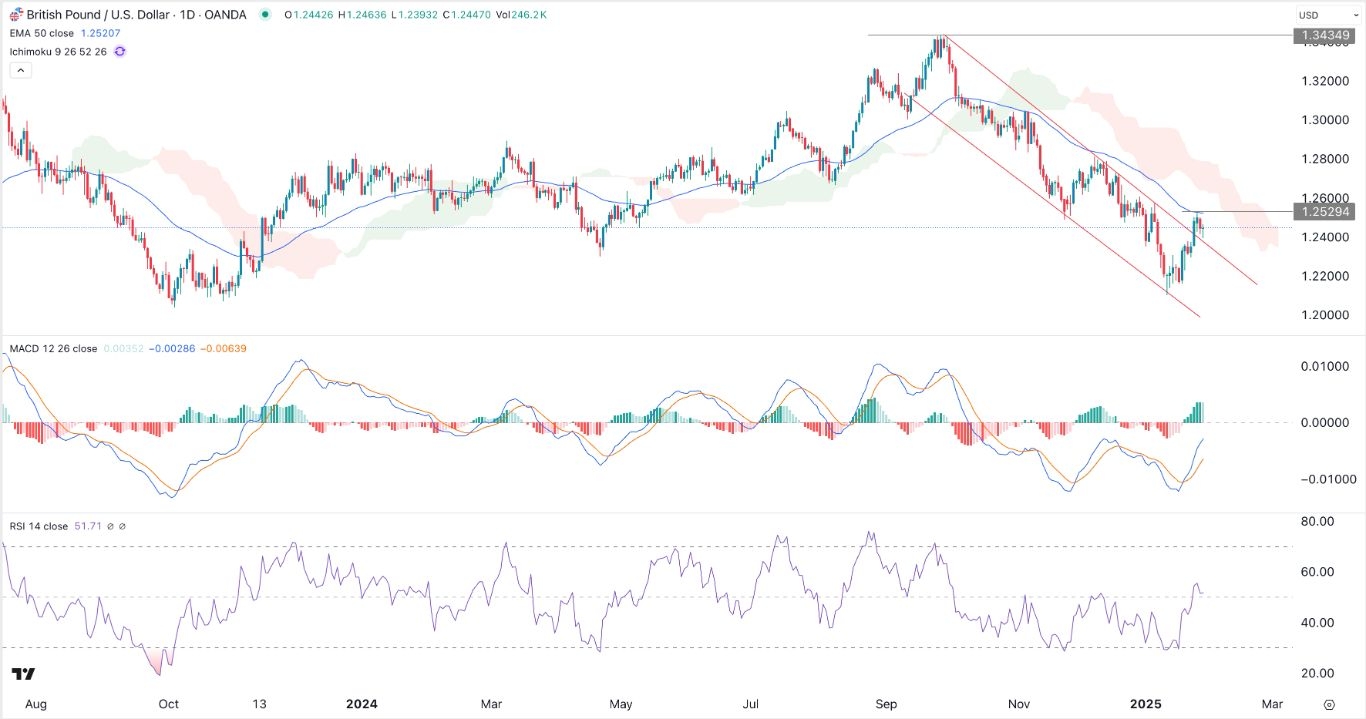
The daily chart shows that the GBP/USD pair peaked at 1.3435 in September and has now dropped to 1.2450. Its recent rebound found substantial resistance point at the 50-day Exponential Moving Average (EMA).
The pair has moved slightly above the upper side of the descending channel pattern. It has also dropped below the Ichimoku cloud indicator. The Relative Strength Index and the MACD indicators have pointed upwards.
Therefore, the pair will likely resume the downward trend, and possibly retest the key support at 1.2350. A move above the 50-day moving average will point to more gains and invalidate the bearish view.
Ready to trade our free trading signals? We’ve made a list of the best UK forex brokers worth using.
Applied Materials’ stock price (AMAT) edged higher in the intraday levels, after leaning on the support of the 50-day SMA, lending the stock some positive momentum, while trying to recoup some losses, amid the dominance of the downward correctional trend in the short term, with negative signals from the RSI.
Therefore we expect the price to return lower, provided the support of $171.60 was reliably breached, targeting the next one at $148.00.
Trend forecast for today: Likely Bearish
According to Forex market trading, the Japanese Yen had recorded gains against the rest of the other major currencies, the highest for the Japanese currency in five weeks, and its gains came as the stricter policy by the Bank of Japan this year regained the spotlight after the US Federal Reserve fixed the interest rate. The minutes of the Bank of Japan’s December meeting recently revealed that the Japanese central bank is maintaining a cautious stance on monetary policy adjustments, based on inflation trends, wage growth and global economic risks.
However, the Bank of Japan raised the interest rate, and revised inflation forecasts higher at its January meeting, supporting market bets that the Japanese central bank is scheduled to continue tightening policy this year. In return, Asian currencies also received support from easing concerns about tariffs by the new US presidential administration amid conflicting comments on trade restrictions by government officials.
We still recommend buying the dollar/Japanese yen from every downward level as Trump’s policies may ultimately benefit the US dollar.
During yesterday’s trading session, according to stock trading companies’ platforms, US stock indices pared their losses after the Federal Reserve left US interest rates unchanged, as expected. Meanwhile, the markets awaited a set of key earnings and continued to assess the impact of potential tariffs on major trading partners. By trade, the S&P 500 closed down 0.5%, the Nasdaq 100 fell 0.5%. Also, the Dow Jones Industrial Average ended down 0.3%, with the S&P 500 and Nasdaq 100 paring their losses by 0.8% in the afternoon.
For its part, the US Federal Reserve indicated that growth remained steady and that the labour market was stable at strong levels, while its statement lacked a previous paragraph that referred to progress in declining inflation. Nvidia shares remained in the spotlight with a 4% decline, extending their volatile momentum after claims of effective AI models from China risked the urgent need for more AI infrastructure. Meanwhile, the performance of Microsoft, Meta, and Tesla shares was mixed before their earnings after the closing bell. On a more positive note, T-Mobile US shares rose 6.3% after reporting stronger-than-expected earnings.
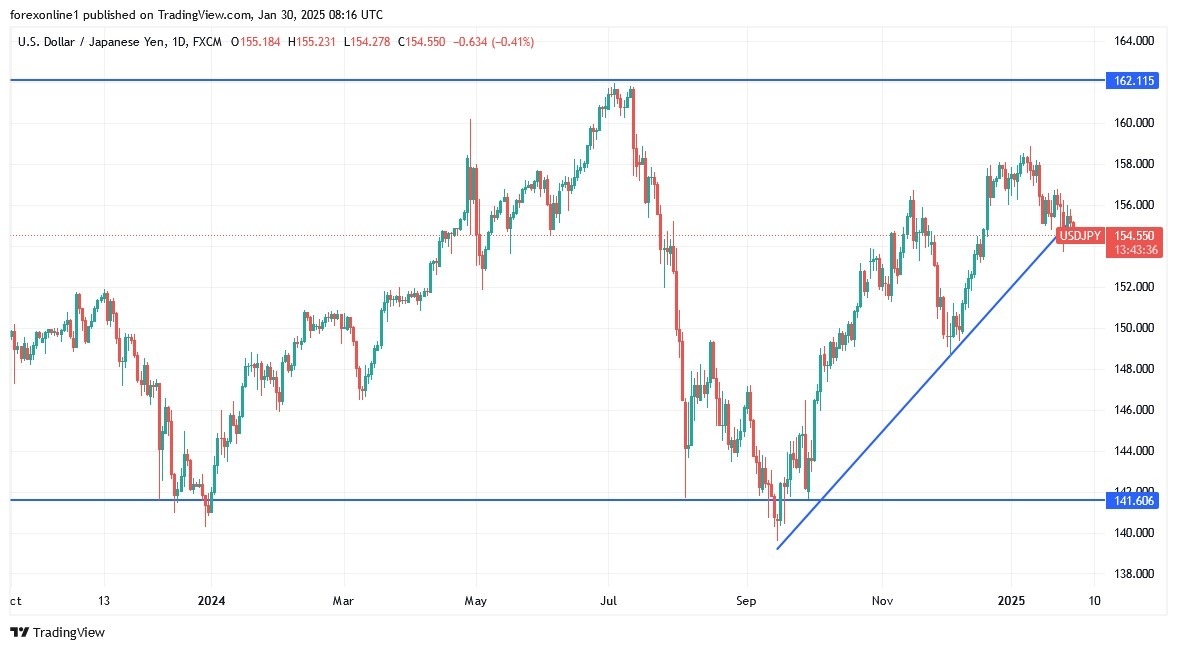
According to trading on the daily chart, the USD/JPY currency pair is trying to stop the downward correction path. Meanwhile, the strong control for the bulls will not return without returning to the vicinity of the resistance levels of 156.80 and 158.00, respectively. The last level will stimulate the move towards the psychological resistance of 160.00, with which the talk about the imminent Japanese intervention in the forex markets increases, in addition to the movement of technical indicators towards strong overbought levels. In return, and in the same time frame, the support level of 153.20 will remain the most important for strong control of the bears over the direction. The USD/JPY price today will be affected by the announcement of the US economic growth reading and the number of weekly jobless claims, in addition to the extent of investors’ appetite for risk or not.
Want to trade our USD/JPY forex analysis and predictions? Here’s a list of forex brokers in Japan to check out.
Gold price is back in demand early Thursday, holding its fort above $2,750. Despite the rebound, Gold price remains in a familiar range below the record high of $2.790 as traders look forward to the US fourth-quarter advance Gross Domestic Product (GDP) report for fresh impetus.
Gold buyers are trying their luck in Asian trading on Thursday, helped by a subdued performance of the US Dollar (USD) and the US Treasury bond yields as traders digest the latest US Federal Reserve (Fed) policy decision in the face of looming tariffs by President Donald Trump on Canada, Mexico and China as soon as this weekend.
Meanwhile, markets remained wary of the mixed earnings results from the US tech titans Meta, Tesla, and Microsoft released after the market close. Meta’s sales in the fourth quarter jumped 21% year over year while net income grew 49% to $20.8 billion from $14 billion a year earlier. Microsoft slipped on weak quarterly revenue guidance while Tesla Inc. shares rallied as much as 4% in extended trading on Wednesday despite the company reporting a disappointing quarter on both revenue and the profit front.
Expectations of a slowdown in the US economic growth also revive the safe-haven appeal of the Gold price. The US economy is expected to grow at an annualized pace of 2.6% in Q4 2024 after expanding 3.1% in the prior quarter. The widening US trade deficit in goods suggests that the advance GDP data could be weaker than the market forecasts.
Faltering US economic growth prospects and looming trade war risks under Trump’s presidency could keep the buoyant tone intact around the traditional store of value – Gold. Also of note will be the weekly US Jobless Claims and the quarterly Personal Consumption Expenditures (PCE) Prices data.
On Wednesday, Gold price returned to the red following a hawkish hold Fed decision as perceived by market participants. The Fed held the benchmark policy rate in the 4.25%-4.50% target range but altered the language in the policy statement to a slightly hawkish tone. The US central bank removed the earlier statement saying that inflation “has made progress” towards its 2% inflation goal while noting only the pace of price increases “remains elevated.”
Additionally, Fed Chairman Jerome Powell, in his post-policy press conference, the Fed wants to see further progress on inflation and could see a pathway for that, adding, “we don’t need to be in a hurry to make any adjustments.”
Traders are pricing in around 46 basis points (bps) of cuts by year-end, a tad lower than around 48 bps before the Fed statement, indicating waning expectations for two Fed rate cuts this year, per Reuters.
However, gold prices managed to stage a modest rebound late Wednesday as the USD failed to sustain Fed-inspired gains. US Treasury bond yields slipped amid souring mood as traders remained cautious ahead of the earnings results from US tech giants – Microsoft, Tesla and Meta.
The short-term technical outlook for Gold price remains bullish, making it a ‘buy-the-dips’ trade.
The 14-day Relative Strength Index (RSI) holds comfortably above the midline, currently near 63, keeping Gold buyers hopeful.
Adding credence to the bullish potential, the 50-day SMA closed above the 100-day SMA last Thursday, confirming a Bull Cross.
Gold price needs a sustained move above the static resistance at around $2,765 to take on the upside.
However, a daily candlestick closing above the symmetrical triangle target of $2,785 or record high of $2,790 is critical to initiating a fresh uptrend.
The next relevant upside targets are $2,800 and the $2,850 psychological barrier.
On the downside, the immediate support will be seen at the previous day’s low of $2,745.
Sellers will then aim for this week’s low of $2,731, folowed by the $2,700 round level, where the 21-day SMA coincides.
EUR/USD continues to move sideways in a narrow channel above 1.0400 in the European session on Thursday after closing marginally lower on Wednesday. Investors await the European Central Bank’s (ECB) policy announcements and the Gross Domestic Product (GDP) data from the US.
The table below shows the percentage change of Euro (EUR) against listed major currencies this week. Euro was the weakest against the Japanese Yen.
| USD | EUR | GBP | JPY | CAD | AUD | NZD | CHF | |
|---|---|---|---|---|---|---|---|---|
| USD | 0.71% | 0.23% | -0.73% | 0.34% | 1.36% | 1.04% | 0.13% | |
| EUR | -0.71% | -0.41% | -1.30% | -0.23% | 0.64% | 0.44% | -0.48% | |
| GBP | -0.23% | 0.41% | -1.21% | 0.18% | 1.05% | 0.87% | -0.07% | |
| JPY | 0.73% | 1.30% | 1.21% | 1.13% | 2.29% | 2.02% | 1.02% | |
| CAD | -0.34% | 0.23% | -0.18% | -1.13% | 0.82% | 0.69% | -0.24% | |
| AUD | -1.36% | -0.64% | -1.05% | -2.29% | -0.82% | -0.16% | -1.07% | |
| NZD | -1.04% | -0.44% | -0.87% | -2.02% | -0.69% | 0.16% | -1.14% | |
| CHF | -0.13% | 0.48% | 0.07% | -1.02% | 0.24% | 1.07% | 1.14% |
The heat map shows percentage changes of major currencies against each other. The base currency is picked from the left column, while the quote currency is picked from the top row. For example, if you pick the Euro from the left column and move along the horizontal line to the US Dollar, the percentage change displayed in the box will represent EUR (base)/USD (quote).
The Federal Reserve (Fed) announced late Wednesday that it maintained the policy rate unchanged at 4.25%-4.5%. In its policy statement, the Fed removed the language suggesting inflation had “made progress” toward its 2% target and said the pace of price increases “remains elevated” instead. In the post-meeting press conference, Fed Chairman Jerome Powell said that there was elevated uncertainty because of significant policy shifts. “We don’t need to be in a hurry to make any adjustments,” he noted.
The US Dollar managed to stay resilient against its rivals after the Fed event but failed to gather bullish momentum. Later in the day, the US Bureau of Economic Analysis (BEA) will publish its first estimate of the fourth-quarter Gross Domestic Product (GDP) data. Markets expect the US economy to expand at an annualized rate of 2.6% following the 3.1% growth recorded in the third quarter. A weaker-than-forecast print could hurt the USD with the immediate reaction.
The ECB is widely anticipated to cut key rates by 25 basis points. In case ECB President Christine Lagarde adopts a cautious tone regarding further policy easing, citing doubts over the continuation of the disinflation, the Euro could gather strength. If Lagarde acknowledges the worsening growth outlook and reiterates the confidence in inflation stabilizing at around their target level, the Euro could come under renewed bearish pressure.
The near-term technical outlook fails to provide a directional clue, with the Relative Strength Index (RSI) indicator on the 4-hour chart moving sideways slightly below 50.
On the downside, first support could be seen at 1.0380-1.0390 (200-period Simple Moving Average, Fibonacci 50% retracement of the latest downtrend) before 1.0340-1.0350 (Fibonacci 38.2% retracement, 100-period SMA) and 1.0300 (static level, round level). If EUR/USD stabilizes above 1.0440 (Fibonacci 61.8% retracement), next resistance could be spotted at 1.0500-1.0510 (round level, Fibonacci 78.6% retracement) ahead of 1.0540 (static level) and 1.0600 (beginning point of the downtrend).
The European Central Bank (ECB) in Frankfurt, Germany, is the reserve bank for the Eurozone. The ECB sets interest rates and manages monetary policy for the region. The ECB primary mandate is to maintain price stability, which means keeping inflation at around 2%. Its primary tool for achieving this is by raising or lowering interest rates. Relatively high interest rates will usually result in a stronger Euro and vice versa. The ECB Governing Council makes monetary policy decisions at meetings held eight times a year. Decisions are made by heads of the Eurozone national banks and six permanent members, including the President of the ECB, Christine Lagarde.
In extreme situations, the European Central Bank can enact a policy tool called Quantitative Easing. QE is the process by which the ECB prints Euros and uses them to buy assets – usually government or corporate bonds – from banks and other financial institutions. QE usually results in a weaker Euro. QE is a last resort when simply lowering interest rates is unlikely to achieve the objective of price stability. The ECB used it during the Great Financial Crisis in 2009-11, in 2015 when inflation remained stubbornly low, as well as during the covid pandemic.
Quantitative tightening (QT) is the reverse of QE. It is undertaken after QE when an economic recovery is underway and inflation starts rising. Whilst in QE the European Central Bank (ECB) purchases government and corporate bonds from financial institutions to provide them with liquidity, in QT the ECB stops buying more bonds, and stops reinvesting the principal maturing on the bonds it already holds. It is usually positive (or bullish) for the Euro.
Oil and natural gas markets remain volatile as traders weigh geopolitical tensions and trade uncertainties.
Crude oil prices held steady as markets assessed the potential impact of tariff measures on major energy suppliers, News.Az reports, citing foreign media.
Meanwhile, U.S. crude stockpiles increased by 3.46 million barrels, reflecting reduced demand from recent weather disruptions.
On the supply side, Russian crude exports are set to decline by 8% as refining activity increases, while OPEC+ prepares for its upcoming policy meeting.
Analysts remain skeptical of a potential price war between major producers, noting that an oversupply scenario could drive Brent crude prices below $50 if spare capacity is aggressively deployed. Traders now await further signals on production policy and global energy demand shifts.
Natural gas price forecast
Natural Gas (NG) Price Chart
Natural Gas (NG) is treading water at $3.17, with traders closely watching the $3.20 pivot level for directional cues. The commodity remains below its 50-day EMA at $3.28 and well under the 200-day EMA at $3.38, reinforcing a cautious outlook.
A break above $3.20 could spark a move toward the $3.37 resistance, potentially extending gains to $3.51 if bullish momentum strengthens. On the downside, immediate support at $3.01 is critical—losing this level may accelerate declines toward $2.88.
The market remains bearish below $3.20, with sellers in control unless buyers step in to reclaim higher ground. Until then, traders should remain cautious, as a failure to hold above key technical levels could invite further downside pressure.
WTI oil price forecast

WTI Price Chart
Crude oil (USOIL) is trading at $72.51, down 0.61%, as it struggles to find footing below the $73.49 pivot level. The 50-day EMA at $73.73 and the 200-day EMA at $74.62 continue to act as strong resistance, keeping sellers in control for now.
A break above $73.49 could shift momentum, targeting $74.93, with further upside potential toward $75.95. However, failure to reclaim this level may push oil toward $72.32, with $71.25 as the next major support.
For now, the trend remains bearish below $73.49, but a decisive move above resistance could spark a fresh rally. Traders should watch for volume confirmation before positioning for a reversal or further downside.
Brent oil price forecast
Brent Price Chart
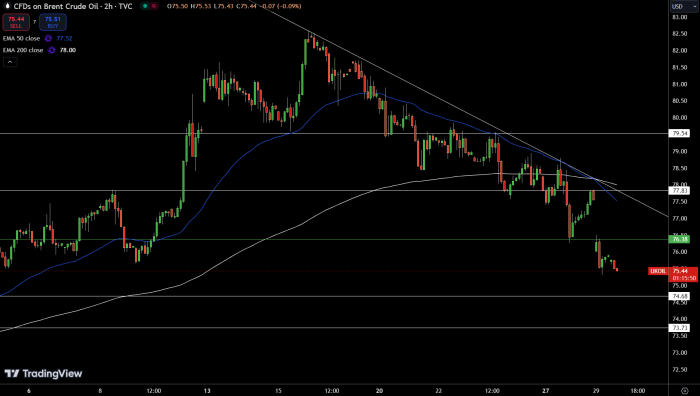
Brent crude (UKOIL) is trading at $75.40, down 0.59%, as it remains under pressure below the $76.38 pivot level. The 50-day EMA at $77.52 and the 200-day EMA at $78.00 signal a bearish bias, keeping upside momentum in check.
A break above $76.38 could trigger a push toward $77.83, with an extended move potentially testing $79.54. However, failure to reclaim this level may reinforce selling pressure, dragging prices toward $74.68, with $73.73 as the next critical support.
For now, the market remains bearish below $76.38, and sellers have the upper hand unless buyers regain control above resistance. A confirmed breakout or further rejection at these levels will determine the next directional move.
The EURJPY pair surrendered to stochastic negativity yesterday, forming new negative waves to crawl below the sideways track’s support line at 161.60, to notice resuming the negative attempts this morning and settling near 160.80.
Now, the major indicators provide the negative momentum to increase the sharpness of the bearish track, to expect suffering additional losses by crawling below 160.90 level again and targeting the additional support at 160.20.
The expected trading range for today is between 160.20 and 162.10
Trend forecast: Bearish
Ethereum price (ETHUSD) still confined between 3017.30$ support and 3222.00$ resistance, which makes us continue with our neutrality until now, waiting to breach one of these levels to detect the next targets clearly.
We remind you that breaching the resistance will push the price to recover and achieve gains that start at 3335.00$ followed by 3425.50$, while breaking the support represents negative factor that will push the price to resume the bearish trend within the bearish channel that appears on the chart, to head towards visiting 2765.00$ areas on the near-term basis.
The expected trading range for today is between 3020.00$ support and 3335.00$ resistance.
Trend forecast: Neutral