The main category of Forex News.
You can use the search box below to find what you need.
[wd_asp id=1]
The main category of Forex News.
You can use the search box below to find what you need.
[wd_asp id=1]
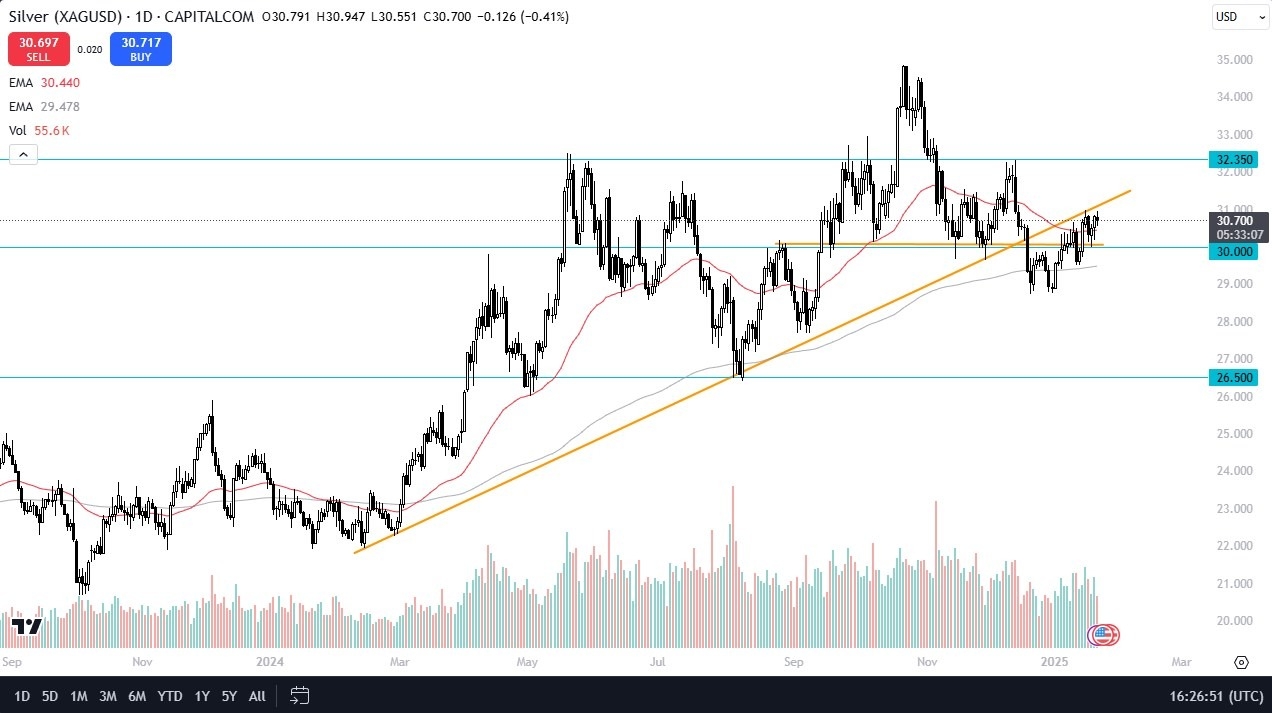
The technical analysis for this pair is essentially sideways in the short term, but there are a lot of different things working against the price of silver right now. Therefore, you need to be cautious about buying in this market. That being said, the market is likely to continue to see a lot of questions asked of the $31 level above, which could of course be a major resistance barrier as it has been important a couple of times now. If we can break above the $31 level, the market is likely to continue to see buyers jump into the market, perhaps reaching the $32.35 level.
If we do break down from here, the market is likely going to look at the 50 Day EMA as a support level, and then of course after that, we have the $30 level offering a significant amount of support also. After that, then we have the 200 Day EMA, followed by the $28.75 level. This is an area where we have seen a little bit of a “double bottom” coming into the picture, so if we were to break down below that level, then I think silver really starts to fall apart.
All things being equal, the silver market is one that is heavily influenced by interest rates, and of course the stronger US dollar. Both of those are working against silver at the moment, so I think you’ve got a situation where we continue to see silver lag gold.

Ready to trade our Forex daily forecast? We’ve shortlisted the best FX trading platform in the industry for you.
The EUR/JPY cross extends the rally to near 163.05 during the early European trading hours on Thursday. The uptick of the cross is bolstered by the risk-on mood in the financial markets. Investors will closely monitor the Bank of Japan (BoJ) interest rate decision on Friday for fresh catalysts.
Traders have priced in a nearly 90% possibility that the Japanese central bank will raise interest rates from 0.25% to 0.50% at the end of the January 23-24 meeting, which would be the highest since the 2008 global financial crisis.
Technically, EUR/JPY keeps the bullish vibe on the 4-hour chart as the cross is well-supported above the key 100-period Exponential Moving Average (EMA). The upward momentum is supported by the Relative Strength Index (RSI), which stands above the midline near 58.05, indicating that the further upside looks favorable.
The first upside barrier for EUR/JPY emerges near 163.55, the upper boundary of the Bollinger Band. The next potential resistance level is seen at the 164.00 psychological level. Further north, the next hurdle to watch is 164.55, the high of January 5.
On the flip side, the initial support level for the cross is located at 162.32, the high of January 20. Any follow-through selling below the mentioned level could see a drop to 161.87, the 100-period EMA. The next contention level is seen at 160.96, the low of January 21.
The Euro is the currency for the 19 European Union countries that belong to the Eurozone. It is the second most heavily traded currency in the world behind the US Dollar. In 2022, it accounted for 31% of all foreign exchange transactions, with an average daily turnover of over $2.2 trillion a day. EUR/USD is the most heavily traded currency pair in the world, accounting for an estimated 30% off all transactions, followed by EUR/JPY (4%), EUR/GBP (3%) and EUR/AUD (2%).
The European Central Bank (ECB) in Frankfurt, Germany, is the reserve bank for the Eurozone. The ECB sets interest rates and manages monetary policy. The ECB’s primary mandate is to maintain price stability, which means either controlling inflation or stimulating growth. Its primary tool is the raising or lowering of interest rates. Relatively high interest rates – or the expectation of higher rates – will usually benefit the Euro and vice versa. The ECB Governing Council makes monetary policy decisions at meetings held eight times a year. Decisions are made by heads of the Eurozone national banks and six permanent members, including the President of the ECB, Christine Lagarde.
Eurozone inflation data, measured by the Harmonized Index of Consumer Prices (HICP), is an important econometric for the Euro. If inflation rises more than expected, especially if above the ECB’s 2% target, it obliges the ECB to raise interest rates to bring it back under control. Relatively high interest rates compared to its counterparts will usually benefit the Euro, as it makes the region more attractive as a place for global investors to park their money.
Data releases gauge the health of the economy and can impact on the Euro. Indicators such as GDP, Manufacturing and Services PMIs, employment, and consumer sentiment surveys can all influence the direction of the single currency. A strong economy is good for the Euro. Not only does it attract more foreign investment but it may encourage the ECB to put up interest rates, which will directly strengthen the Euro. Otherwise, if economic data is weak, the Euro is likely to fall. Economic data for the four largest economies in the euro area (Germany, France, Italy and Spain) are especially significant, as they account for 75% of the Eurozone’s economy.
Another significant data release for the Euro is the Trade Balance. This indicator measures the difference between what a country earns from its exports and what it spends on imports over a given period. If a country produces highly sought after exports then its currency will gain in value purely from the extra demand created from foreign buyers seeking to purchase these goods. Therefore, a positive net Trade Balance strengthens a currency and vice versa for a negative balance.
Natural gas price kept its stability within the bullish channel that its major support line located at 3.680$, to notice renewing the positive action by targeting 4.030$ barrier now, which formed the first target for the recent bullish overview.
Now, stochastic exit from the oversold areas will reinforce the chances of gathering the positive momentum to manage to surpass the current barrier and achieve additional gains by rallying towards 4.220$ followed by reaching the bullish channel’s resistance line at 4.420$.
The expected trading range for today is between 3.920$ and 4.220$
Trend forecast: Bullish
The GBPUSD price’s rise stopped at the minor bullish channel’s resistance line that appears on the chart, to rebound bearishly and head towards achieving expected decline in the upcoming sessions, targeting testing the mentioned channel’s support line around 1.2210$, noting that this channel forms potential bearish flag pattern that might push the price to resume the main bearish track within the main bearish channel that appears on the image.
Therefore, we expect to witness negative trades today, taking into consideration that the consolidation of 1.2300$ level against the negative attempts will lead the price to recover again and head to test 1.2440$ areas mainly.
The expected trading range for today is between 1.2230$ support and 1.2380$ resistance
Trend forecast: Bearish
Gold price’s rise stopped near 2765.00$ level, to start bouncing bearishly after losing the positive momentum, as it returns to the bullish channel and trades below its resistance line, to hint starting bearish wave that targets visiting the mentioned channel’s support line, located now at 2707.00$.
Therefore, the bearish trend will be expected for today, and breaking 2744.00$ will ease the mission of achieving the suggested target, while breaching 2755.00$ will stop the suggested bearish wave and lead the price to resume the main bullish trend again.
The expected trading range for today is between 2730.00$ support and 2765.00$ resistance.
Trend forecast: Bearish
The USD/JPY has lost more than 1.5% of its value over the last six trading sessions, allowing the Japanese yen to regain ground against the prolonged bullish trend favoring the US dollar. This short-term bearish correction is driven by expectations that the Bank of Japan will raise interest rates in its upcoming decision this week.
In order to understand the behavior of the USD/JPY since mid-September 2024, it is important to evaluate the interest rate outlook in both the United States and Japan.
On one hand, the Federal Reserve (Fed) faces new economic uncertainties with the change in administration in the United States. The arrival of Donald Trump has introduced tariff proposals and tax cuts that could increase long-term inflation by strengthening domestic consumption. This scenario could pose a new challenge for the Fed, extending the pause in the current interest rate of 4.5%.
According to the CME Group, there is a 99.5% probability that the interest rate will remain at its current level (4.25% – 4.5%) for the January 29 decision. Following this trajectory, for the next decision on March 19, the probability of keeping rates unchanged has risen to 73.6% in recent days. This reflects a more aggressive stance by the central bank for the first quarter of 2025, primarily due to uncertainty surrounding inflation. It is important to note that these probabilities may change depending on economic conditions.

Source: CMEGroup

Source: CMEGroup
The neutral stance in the United States, reinforced by the probabilities mentioned, has fueled a wave of buying in the USD/JPY in recent weeks. This, combined with the lack of clarity in the Bank of Japan’s monetary policies, has consistently weakened the Japanese yen and sustained the bullish trend in USD/JPY.
On the other hand, on January 23, the Bank of Japan’s next official decision is expected to be announced. The latest inflation data published in Japan stands at 2.9% (November), above the 2% target. This has led the market to anticipate an interest rate hike from 0.25% to 0.5%, which has slightly strengthened the yen in the short term (due to higher expected returns on Japanese assets), driving the current bearish correction in USD/JPY.

Source: Data – FXSTREET
The critical factor moving forward will be to determine whether this new hawkish stance by the Bank of Japan will persist, something that could be confirmed by the comments following the rate decision. If the market is already accustomed to high rates in the United States but anticipates greater aggressiveness in Japan, the current bearish pressure could evolve into a more significant movement.

Source: StoneX, Tradingview
Written by Julian Pineda, CFA – Market Analyst
It is notable that last week’s trend high of 4.37 ended with a bearish candlestick pattern and a closing price below the previous trend high of 4.20. This means that if today’s advance continues, and it looks like it will, there is a good size resistance zone to be encountered before a chance at new trend highs.
If correct, the expectation would be for a period of consolidation largely contained with support around the uptrend line and key resistance at the most recent swing high of 4.33. There are a couple of prior weekly price levels that may see resistance. They include 4.02, 4.06, and 4.41. Also, there is a monthly high at 4.20.
Nonetheless, a decisive decline below the 3.64 price level increases the risk for a deeper correction. In that case, a drop to a price zone from 3.52 to 3.51 looks likely. That zone includes the 127.2% extended target for a descending ABCD pattern and the 61.8% Fibonacci retracement, respectively. A little lower is the 50-Day MA at 3.43. The 50-Day line is joined by the 3.39 prior peak from January 2024. If the 20-Day line fails to mark support, the 50-Day line becomes a target when considering moving average analysis.
On a monthly basis (not shown), natural gas has been progressing in a series of higher monthly highs and higher monthly lows for five months. The closing price for the month may provide a clue to the strength of weakness of demand. Currently, the trading range for the month of January is 3.33 to 4.37, which puts the middle at 3.85.
For a look at all of today’s economic events, check out our economic calendar.
It is notable that last week’s trend high of 4.37 ended with a bearish candlestick pattern and a closing price below the previous trend high of 4.20. This means that if today’s advance continues, and it looks like it will, there is a good size resistance zone to be encountered before a chance at new trend highs.
If correct, the expectation would be for a period of consolidation largely contained with support around the uptrend line and key resistance at the most recent swing high of 4.33. There are a couple of prior weekly price levels that may see resistance. They include 4.02, 4.06, and 4.41. Also, there is a monthly high at 4.20.
Nonetheless, a decisive decline below the 3.64 price level increases the risk for a deeper correction. In that case, a drop to a price zone from 3.52 to 3.51 looks likely. That zone includes the 127.2% extended target for a descending ABCD pattern and the 61.8% Fibonacci retracement, respectively. A little lower is the 50-Day MA at 3.43. The 50-Day line is joined by the 3.39 prior peak from January 2024. If the 20-Day line fails to mark support, the 50-Day line becomes a target when considering moving average analysis.
On a monthly basis (not shown), natural gas has been progressing in a series of higher monthly highs and higher monthly lows for five months. The closing price for the month may provide a clue to the strength of weakness of demand. Currently, the trading range for the month of January is 3.33 to 4.37, which puts the middle at 3.85.
For a look at all of today’s economic events, check out our economic calendar.
January 22, 2025 – Written by Tim Boyer
STORY LINK GBP/USD Forecast: Pound to Dollar Rate Holds Near $1.23
The Pound US Dollar exchange rate was mostly quiet on Wednesday amid an absence of both UK and US economic data releases.
At the time of writing, GBP/USD was trading at approximately $1.2354, virtually unchanged from the start of Thursday’s session.
On Wednesday, the Pound (GBP) experienced minimal fluctuation against most other currencies, as the lack of major economic data left the British currency directionless.
Nevertheless, Sterling managed to regain much of the ground it lost on Tuesday, after the country’s latest unemployment rate unexpectedly rose.
With no significant economic indicators or clear market sentiment to drive the currency, GBP exchange rates remained trapped in a narrow range throughout the day.
On Wednesday, the US Dollar (USD) failed to capture investor interest and declined against several of its major counterparts as newly inaugurated President Donald Trump entered his third day in office.

On Tuesday, USD exchange rates saw significant volatility, with a sharp rise in the morning followed by a retreat in the afternoon, after the President signed a series of executive orders on Monday.
However, on Wednesday, markets adopted a cautious stance, as new uncertainties surrounding US tax policies weighed on the ‘Greenback.’
In the absence of any economic data to influence trading, this uncertainty kept USD exchange rates under pressure throughout the European trading session.
Looking ahead, the main driver of movement for the Pound US Dollar exchange rate on Thursday will likely be several economic releases from both the UK and the US.
For the Pound, the UK is scheduled to publish its latest CBI business optimism index and the CBI industrial trends orders survey.
The business optimism index is expected to show a slight improvement, potentially offering Sterling some modest support at the start of Thursday’s European session.
However, the industrial trends orders survey is forecast to decline again, which could temper any potential gains for the Pound.
On the US Dollar side, the US will release its latest initial jobless claims report for the week ending January 18th.
If the data indicates an increase in initial jobless claims as anticipated, this could weaken the ‘Greenback’ as the week progresses.
International Money Transfer? Ask our resident FX expert a money transfer question or try John’s new, free, no-obligation personal service! ,where he helps every step of the way,
ensuring you get the best exchange rates on your currency requirements.
TAGS: Pound Dollar Forecasts
Silver prices forecast, XAG/USD continues to trade above the $30.50 mark, hovering close to its nine-day Exponential Moving Average (EMA).
Silver, often seen as a safe-haven asset, has displayed strong resilience in recent trading sessions. Currently, XAG/USD is maintaining its position above $30.50, a critical psychological level that traders are closely monitoring. This article delves into the factors influencing silver prices, the technical outlook for XAG/USD, and what investors can expect in the coming weeks.
As of now, silver is trading above the $30.50 threshold, supported by several macroeconomic factors. The ongoing geopolitical tensions, inflationary pressures, and shifts in monetary policy continue to create a favorable environment for precious metals, including silver.
Geopolitical uncertainties often drive investors towards safe-haven assets like silver and gold. Recent developments in various global hotspots have heightened market anxiety, prompting investors to seek refuge in precious metals. The ongoing conflicts and trade tensions have not only impacted investor sentiment but also contributed to fluctuations in the value of fiat currencies, further bolstering demand for silver.
Inflation remains a significant concern for many economies worldwide. Rising prices for goods and services have prompted central banks to reassess their monetary policies. In such environments, precious metals are traditionally viewed as a hedge against inflation, which is another factor propelling silver prices higher.
The Fed interest rate landscape is crucial in determining the attractiveness of non-yielding assets like silver. Current expectations suggest that central banks may adopt a more cautious approach to rate hikes, especially amid growing concerns about economic slowdowns. Lower interest rates typically benefit precious metals as they reduce the opportunity cost of holding them, making silver more appealing to investors.
Key Support and Resistance Levels
On the technical front, XAG/USD’s ability to hold above the $30.50 level is significant. This area serves as both a psychological support level and a technical benchmark. Traders will be looking for signs of consolidation above this level to confirm bullish momentum.
Support Level: The $30.50 mark is a crucial support level. A sustained breach below this could signal a shift in sentiment, leading to further declines.
Resistance Level: On the upside, key resistance is around $31.50. A breakout above this level could pave the way for further gains, potentially targeting the $32.00 region.
The nine-day Exponential Moving Average (EMA) is currently acting as a dynamic support level for XAG/USD. The alignment of the price above this EMA indicates that bullish momentum may persist in the near term. Traders often look for crossovers to identify potential trend reversals or continuations, making the EMA a critical tool in their analysis.
Momentum indicators, such as the Relative Strength Index (RSI), can provide insights into the strength of the current trend. If the RSI remains above the 50 level, it suggests that the bullish trend is intact. However, if it approaches overbought territory (above 70), it may indicate a potential pullback.
Bullish Sentiment
Market sentiment around silver remains predominantly bullish, driven by the factors discussed earlier. Traders are increasingly optimistic about silver’s potential to outperform in the current economic climate. The combination of geopolitical tensions, inflation fears, and a supportive interest rate environment has created a favorable backdrop for silver investment.
Institutional Interest
Institutional investors have also been showing a renewed interest in silver. As more funds allocate capital towards precious metals, this influx of institutional money could provide additional support for prices. Furthermore, exchange-traded funds (ETFs) that focus on silver have seen increased inflows, reflecting growing confidence among investors.
Retail Investor Activity
Retail investors are also becoming more active in the silver market, particularly as prices hold steady above essential support levels. The accessibility of trading platforms and the availability of silver-related investment products have made it easier for individual investors to participate in this market.
In the short term, XAG/USD is likely to remain influenced by ongoing economic data releases and geopolitical developments. Key economic indicators, including inflation rates and employment data, will be closely watched as they could impact central bank policies and, consequently, silver prices.
Positive Scenario: If inflation continues to rise and geopolitical tensions escalate, silver could break above the $31.50 resistance level, paving the way for further gains.
Negative Scenario: Conversely, if economic data suggests a stronger-than-expected recovery, leading to a more aggressive rate hike stance from central banks, silver may struggle to maintain its current levels.
Looking further ahead, several factors could shape the long-term outlook for silver prices:
Sustainable Inflation: If inflation proves to be persistent, silver may continue to gain traction as a hedge.
Green Energy Demand: The growing emphasis on renewable energy and electric vehicles could drive increased demand for silver, which is used in various applications, including solar panels and batteries.
Central Bank Policies: Ongoing adjustments in monetary policy will be crucial. A shift towards dovish policies may provide further support for silver prices.
In summary, XAG/USD’s ability to hold above the $30.50 mark, coupled with supportive technical indicators, presents a cautiously optimistic outlook for silver prices. Geopolitical tensions, inflationary concerns, and a favorable interest rate environment are all contributing to a bullish sentiment around silver.
Investors should remain vigilant, monitoring both technical levels and macroeconomic developments, as these factors will undoubtedly influence the trajectory of silver prices in the coming weeks and months. As always, prudent risk management and a well-defined investment strategy will be essential for navigating the complexities of the silver market.
When considering shares, indices, forex (foreign exchange) and commodities for trading and price predictions, remember that trading CFDs involves a significant degree of risk and could result in capital loss.
Past performance is not indicative of any future results. This information is provided for informative purposes only and should not be construed to be investment advice.