The main category of Forex News.
You can use the search box below to find what you need.
[wd_asp id=1]
The main category of Forex News.
You can use the search box below to find what you need.
[wd_asp id=1]
The USD/JPY has lost more than 1.5% of its value over the last six trading sessions, allowing the Japanese yen to regain ground against the prolonged bullish trend favoring the US dollar. This short-term bearish correction is driven by expectations that the Bank of Japan will raise interest rates in its upcoming decision this week.
In order to understand the behavior of the USD/JPY since mid-September 2024, it is important to evaluate the interest rate outlook in both the United States and Japan.
On one hand, the Federal Reserve (Fed) faces new economic uncertainties with the change in administration in the United States. The arrival of Donald Trump has introduced tariff proposals and tax cuts that could increase long-term inflation by strengthening domestic consumption. This scenario could pose a new challenge for the Fed, extending the pause in the current interest rate of 4.5%.
According to the CME Group, there is a 99.5% probability that the interest rate will remain at its current level (4.25% – 4.5%) for the January 29 decision. Following this trajectory, for the next decision on March 19, the probability of keeping rates unchanged has risen to 73.6% in recent days. This reflects a more aggressive stance by the central bank for the first quarter of 2025, primarily due to uncertainty surrounding inflation. It is important to note that these probabilities may change depending on economic conditions.

Source: CMEGroup

Source: CMEGroup
The neutral stance in the United States, reinforced by the probabilities mentioned, has fueled a wave of buying in the USD/JPY in recent weeks. This, combined with the lack of clarity in the Bank of Japan’s monetary policies, has consistently weakened the Japanese yen and sustained the bullish trend in USD/JPY.
On the other hand, on January 23, the Bank of Japan’s next official decision is expected to be announced. The latest inflation data published in Japan stands at 2.9% (November), above the 2% target. This has led the market to anticipate an interest rate hike from 0.25% to 0.5%, which has slightly strengthened the yen in the short term (due to higher expected returns on Japanese assets), driving the current bearish correction in USD/JPY.

Source: Data – FXSTREET
The critical factor moving forward will be to determine whether this new hawkish stance by the Bank of Japan will persist, something that could be confirmed by the comments following the rate decision. If the market is already accustomed to high rates in the United States but anticipates greater aggressiveness in Japan, the current bearish pressure could evolve into a more significant movement.

Source: StoneX, Tradingview
Written by Julian Pineda, CFA – Market Analyst
3M’s stock price (MMM) rallied in the intraday levels, accompanied by a surge in trading volumes, while managing to pierce the pivotal resistance of $141.45, amid the dominance of the main upward trend in the medium term, with positive pressure due to trading above the 50-day SMA, countered with negative signals from the RSI after reaching overbought levels.
Therefore we expect more gains for the stock, provided it settles firmly above $141.45, targeting the resistance of $168.54.
Trend forecast for today: Bullish
After rising to the 1.0450 area earlier in the session, EUR/USD lost its bullish momentum and erased its daily gains. Nevertheless, the pair holds comfortably above 1.0400, while the technical shows the bullish bias remains unchanged in the near term.
The table below shows the percentage change of Euro (EUR) against listed major currencies this week. Euro was the strongest against the US Dollar.
| USD | EUR | GBP | JPY | CAD | AUD | NZD | CHF | |
|---|---|---|---|---|---|---|---|---|
| USD | -1.50% | -1.42% | -0.22% | -0.76% | -1.47% | -1.46% | -0.76% | |
| EUR | 1.50% | 0.02% | 1.19% | 0.65% | 0.09% | -0.07% | 0.63% | |
| GBP | 1.42% | -0.02% | 1.12% | 0.62% | 0.08% | -0.10% | 0.61% | |
| JPY | 0.22% | -1.19% | -1.12% | -0.53% | -1.20% | -1.34% | -0.71% | |
| CAD | 0.76% | -0.65% | -0.62% | 0.53% | -0.66% | -0.71% | -0.01% | |
| AUD | 1.47% | -0.09% | -0.08% | 1.20% | 0.66% | -0.25% | 0.47% | |
| NZD | 1.46% | 0.07% | 0.10% | 1.34% | 0.71% | 0.25% | 0.52% | |
| CHF | 0.76% | -0.63% | -0.61% | 0.71% | 0.01% | -0.47% | -0.52% |
The heat map shows percentage changes of major currencies against each other. The base currency is picked from the left column, while the quote currency is picked from the top row. For example, if you pick the Euro from the left column and move along the horizontal line to the US Dollar, the percentage change displayed in the box will represent EUR (base)/USD (quote).
The improving risk mood made it difficult for the US Dollar (USD) to find demand in the European session and helped EUR/USD hold its ground. Dovish comments from European Central Bank (ECB) officials, however, seem to be limiting the Euro’s upside ahead of next week’s policy meeting.
ECB policymaker José Luis Escrivá said on Wednesday that a 25 basis points (bps) cut next week is a likely scenario. “Incoming information points towards converging to 2% inflation goal,” Escrivá added. Moreover, ECB policymaker Francois Villeroy de Galhau noted that the disinflation process is still on track and said that there could be a decoupling between the ECB and the Federal Reserve on rates.
The US economic calendar will not offer any key data releases on Wednesday. Later in the day, ECB President Christine Lagarde will participate in the dialogue ‘Beyond Crisis: Unlocking Europe’s Potential’ at the World Economic Forum in Davos.
Meanwhile, US stock index futures were last seen rising between 0.3% and 1%. A bullish opening in Wall Street could cause the USD to stay under pressure and allow EUR/USD to regain its traction.
The Relative Strength Index (RSI) indicator on the 4-hour chart retreated slightly after touching 70, suggesting that the bullish bias remains intact, with a potential for a technical correction. On the upside, 1.0440 (Fibonacci 61.8% retracement of the latest downtrend, 50-day SMA) aligns as key resistance before 1.0500 (round level, Fibonacci 78.6% retracement) and 1.0545 (static level).
Looking south, a strong support area seems to have formed at 1.0390-1.0400, where the 200-period Simple Moving Average (SMA) meets the Fibonacci 50% retracement, before 1.0350 (Fibonacci 38.2% retracement) and 1.0320 (100-period SMA).
The Euro is the currency for the 19 European Union countries that belong to the Eurozone. It is the second most heavily traded currency in the world behind the US Dollar. In 2022, it accounted for 31% of all foreign exchange transactions, with an average daily turnover of over $2.2 trillion a day. EUR/USD is the most heavily traded currency pair in the world, accounting for an estimated 30% off all transactions, followed by EUR/JPY (4%), EUR/GBP (3%) and EUR/AUD (2%).
The European Central Bank (ECB) in Frankfurt, Germany, is the reserve bank for the Eurozone. The ECB sets interest rates and manages monetary policy. The ECB’s primary mandate is to maintain price stability, which means either controlling inflation or stimulating growth. Its primary tool is the raising or lowering of interest rates. Relatively high interest rates – or the expectation of higher rates – will usually benefit the Euro and vice versa. The ECB Governing Council makes monetary policy decisions at meetings held eight times a year. Decisions are made by heads of the Eurozone national banks and six permanent members, including the President of the ECB, Christine Lagarde.
Eurozone inflation data, measured by the Harmonized Index of Consumer Prices (HICP), is an important econometric for the Euro. If inflation rises more than expected, especially if above the ECB’s 2% target, it obliges the ECB to raise interest rates to bring it back under control. Relatively high interest rates compared to its counterparts will usually benefit the Euro, as it makes the region more attractive as a place for global investors to park their money.
Data releases gauge the health of the economy and can impact on the Euro. Indicators such as GDP, Manufacturing and Services PMIs, employment, and consumer sentiment surveys can all influence the direction of the single currency. A strong economy is good for the Euro. Not only does it attract more foreign investment but it may encourage the ECB to put up interest rates, which will directly strengthen the Euro. Otherwise, if economic data is weak, the Euro is likely to fall. Economic data for the four largest economies in the euro area (Germany, France, Italy and Spain) are especially significant, as they account for 75% of the Eurozone’s economy.
Another significant data release for the Euro is the Trade Balance. This indicator measures the difference between what a country earns from its exports and what it spends on imports over a given period. If a country produces highly sought after exports then its currency will gain in value purely from the extra demand created from foreign buyers seeking to purchase these goods. Therefore, a positive net Trade Balance strengthens a currency and vice versa for a negative balance.
Gold (XAU/USD) continued its weekly rally on Wednesday, marking its third consecutive day of gains. The precious metal climbed above $2,760 per troy ounce for the firdt time since early November, driven by persistent unceratainty surrounding President Trump’s announcements, particulalry regarding to tariffs.
Somewhat limiting the metal’s appeal, the US Dollar (USD) regained part of its shine lost as of late, with the Dollar Index (DXY) regaining upside traction and bouncing off recent multi-week lows, while US yields traded in a mixed fashion across various maturity periods.
Still around Trump, he announced plans to impose tariffs on the European Union, Canada and Mexico, and revealed that his administration was considering a 10% tariff on Chinese imports. The move, he claimed, was in response to fentanyl being trafficked from China to the United States through Mexico and Canada.
However, these policies could complicate the outlook for the yellow metal. While gold is traditionally seen as an inflation hedge, analysts believe that if Trump’s tariff-driven policies stoke inflation, the Federal Reserve (Fed) might be forced to keep interest rates elevated for a longer period, dampening gold’s appeal, as it is a non-yielding asset and tends to lose its shine in a high-rate environment.
Looking ahead, the market’s focus will likely remain on developments from the White House, especially in a light week for major economic data releases. Investors are also preparing for the Fed’s January 28–29 meeting, where interest rates are widely expected to stay in their 4.25%-4.50% range.
As political uncertainty and central bank decisions loom large, gold remains a key asset to watch, with volatility likely on the horizon.
In the near term, gold’s next major resistance is $2,763, the 2025 high reached on January 22. Beyond that, traders will target the all-time high of $2,790, recorded on October 31. If these levels are surpassed, Fibonacci projections suggest further upside milestones at $3,009, $3,123, and $3,288.
On the downside, key support levels include December’s low of $2,582, November’s low of $2,536, and the 200-day moving average at $2,515. Deeper corrections could push prices toward $2,471 (the September low) or even $2,353 (July’s weekly low).
Should a significant selloff occur, watch for levels around $2,286 (June low) and $2,277 (May low). The ultimate downside target for now stands at $1,984, the February 2024 low—a substantial retracement from current prices.
Gold daily chart
Risk-on has been a key theme in the markets from around mid-January and that trend continued after Trump’s inauguration, where a delay in tariff announcements fuelled further optimism. While the stock market has been the major beneficiary, we have also seen the likes of the euro, Canadian dollar and Mexican peso all staging a relief rally. The risk on trade has also benefited the pound, but it is far too early to say whether the GBP/USD forecast has turned bullish.
While markets are buoyed by Trump’s restraint in enforcing blanket trade tariffs on imports into the US, caution is palpable. The daily rhetoric from Trump continues to stir the waters, leaving investors on edge. His threats of imposing trade tariffs on China and the EU remain a cloud over potential market gains. The latest warning? A 10% tariff on Chinese imports, which he said is still under consideration. So, while there has been relief that there weren’t any immediate tariffs, celebrations might be cut short.
In Britain, December’s budget figures revealed a wider-than-expected deficit, driven by increased debt interest payments. Borrowing rose to £17.8 billion, far exceeding the forecasted £14.1 billion. These figures underscore the uphill battle for Chancellor Rachel Reeves as she navigates mounting fiscal pressures, leaving the pound vulnerable to further volatility.
Investors have been trimming long USD positions amid the recent strong performance of US Treasuries, putting yields under pressure. and the temporary reprieve from immediate tariff announcements. Yet, the tariff situation remains fraught with complexity.
The focus has shifted to Canada and Mexico, following Monday’s threat of 25% tariffs. Both currencies have seen a decent bounce since Friday, suggesting markets are still clinging to hopes of delayed measures.
Today’s US calendar is void of any major data. The question now is whether Treasury yields will fall further lower to put more pressure on the dollar’s momentum.
The technical GBP/USD forecast has improved along with all other USD pairs, but it is far too early to say whether rates have hit a bottom.

Source: TradingView.com
Indeed, the series of lower highs and lower lows since the GBP/USD peaked in September remain intact for now. The bearish trend line connecting those lower highs is also in place.
In fact, the GBP/USD was now testing the first important area of resistance starting at around 1.2360, which roughly marks the low from the start of the year. The bearish trend line itself comes in around 1.2450, while arguably the most important resistance is seen in or around the 1.25 handle.
So, there are lots of hurdles that need to give way for the tide to turn decisively bullish. Until that happens, we will have to treat this recovery as a normal retracement inside the larger bear trend.
A couple of short-term support levels to watch include 1.2300, 1.2250 and 1.2200. If we start to see the breakdown of these levels in the coming days, then that could be a sign that the prevailing bearish trend has resumed.
— Written by Fawad Razaqzada, Market Analyst
Follow Fawad on Twitter @Trader_F_R
Silver price (XAG/USD) reclaims a more-than-a-month high of $30.95 in Wednesday’s European session. The white metal strengthens as the US Dollar (USD) extends its downside due to less-fearful tariff plans announced by United States (US) President Donald Trump in his first two days of administration.
The US Dollar Index (DXY), which tracks the Greenback’s value against six major currencies, refreshes a two-week low at 107.80. The lower US Dollar makes the Silver price inexpensive for investors. 10-year US Treasury yields tick lower to near 4.57%.
Trump has announced 25% tariffs on Mexico and Canada and is discussing 10% tariffs on China from February 1. However, his comments during the election campaign indicated that the tariffs would be much higher than what he actually announced.
Lower tariffs by Trump would also weigh on market speculation that the Federal Reserve (Fed) will keep interest rates at their current levels for longer. Market participants were anticipating that higher tariffs would increase demand for domestically produced goods and services. This scenario would have accelerated inflationary pressures.
Currently, the CME FedWatch tool shows that traders are confident that the Fed will keep its key borrowing rates in the range of 4.25%-4.50% in the coming three policy meetings.
Silver price gathers strength to return above the north-side sloping trendline near $30.85, which is plotted from the 29 February 2024 low of $22.30 on a daily timeframe.
The white metal discovered strong buying interest near the 200-day Exponential Moving Average (EMA), around $29.45, and has now extended its upside above the 20-day EMA, which is around $30.26. This suggests that the overall trend has turned bullish.
The 14-day Relative Strength Index (RSI) rises to near 60.00. A fresh bullish momentum would trigger if it manages to break above 60.00.
Silver is a precious metal highly traded among investors. It has been historically used as a store of value and a medium of exchange. Although less popular than Gold, traders may turn to Silver to diversify their investment portfolio, for its intrinsic value or as a potential hedge during high-inflation periods. Investors can buy physical Silver, in coins or in bars, or trade it through vehicles such as Exchange Traded Funds, which track its price on international markets.
Silver prices can move due to a wide range of factors. Geopolitical instability or fears of a deep recession can make Silver price escalate due to its safe-haven status, although to a lesser extent than Gold’s. As a yieldless asset, Silver tends to rise with lower interest rates. Its moves also depend on how the US Dollar (USD) behaves as the asset is priced in dollars (XAG/USD). A strong Dollar tends to keep the price of Silver at bay, whereas a weaker Dollar is likely to propel prices up. Other factors such as investment demand, mining supply – Silver is much more abundant than Gold – and recycling rates can also affect prices.
Silver is widely used in industry, particularly in sectors such as electronics or solar energy, as it has one of the highest electric conductivity of all metals – more than Copper and Gold. A surge in demand can increase prices, while a decline tends to lower them. Dynamics in the US, Chinese and Indian economies can also contribute to price swings: for the US and particularly China, their big industrial sectors use Silver in various processes; in India, consumers’ demand for the precious metal for jewellery also plays a key role in setting prices.
Silver prices tend to follow Gold’s moves. When Gold prices rise, Silver typically follows suit, as their status as safe-haven assets is similar. The Gold/Silver ratio, which shows the number of ounces of Silver needed to equal the value of one ounce of Gold, may help to determine the relative valuation between both metals. Some investors may consider a high ratio as an indicator that Silver is undervalued, or Gold is overvalued. On the contrary, a low ratio might suggest that Gold is undervalued relative to Silver.
On a Move Lower
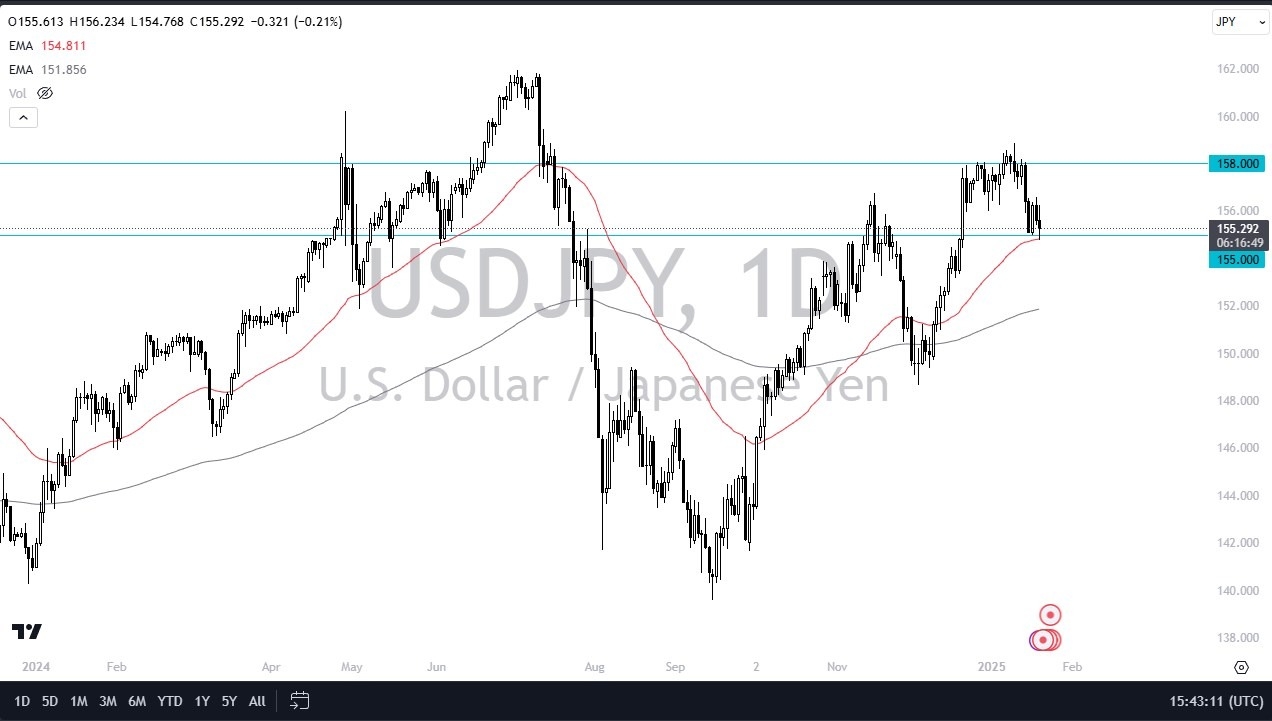
If the market were to break down below the 50 day EMA, then we could see this market go looking to the 153 yen level. On the other hand, if we can break above the 156.50 yen level, then it opens up a move to the 158 yen level. I suspect that in the next couple of days will probably be a lot more of this chop that we are looking at right now.
Furthermore, we have a lot of questions about the US dollar in general because Trump is on the warpath already talking about tariffs on Mexico and Canada, and while that doesn’t directly affect Japan, it does directly affect the US dollar. So, expect more noise and more chaos, but really, once we get through this week, we should have a little bit more in the way of confirmation. All things being equal, this is a market that isn’t in an uptrend. I do prefer the upside for no other reason than getting paid at the end of every day.

Want to trade our USD/JPY forex analysis and predictions? Here’s a list of forex brokers in Japan to check out.
Lumen Technologies’ stock price (LUMN) returned lower in the intraday levels, amid the dominance of the downward correctional trend in the short term, with negative pressure due to trading below the 50-day SMA, coupled with negative signals from the RSI after reaching overbought levels compared to the stock’s movements, hinting at negative divergence.
Therefore we expect more losses for the stock, provided it settles firmly below the resistance of $5.90, and targeting the support of $4.52.
Trend forecast for today: Bearish
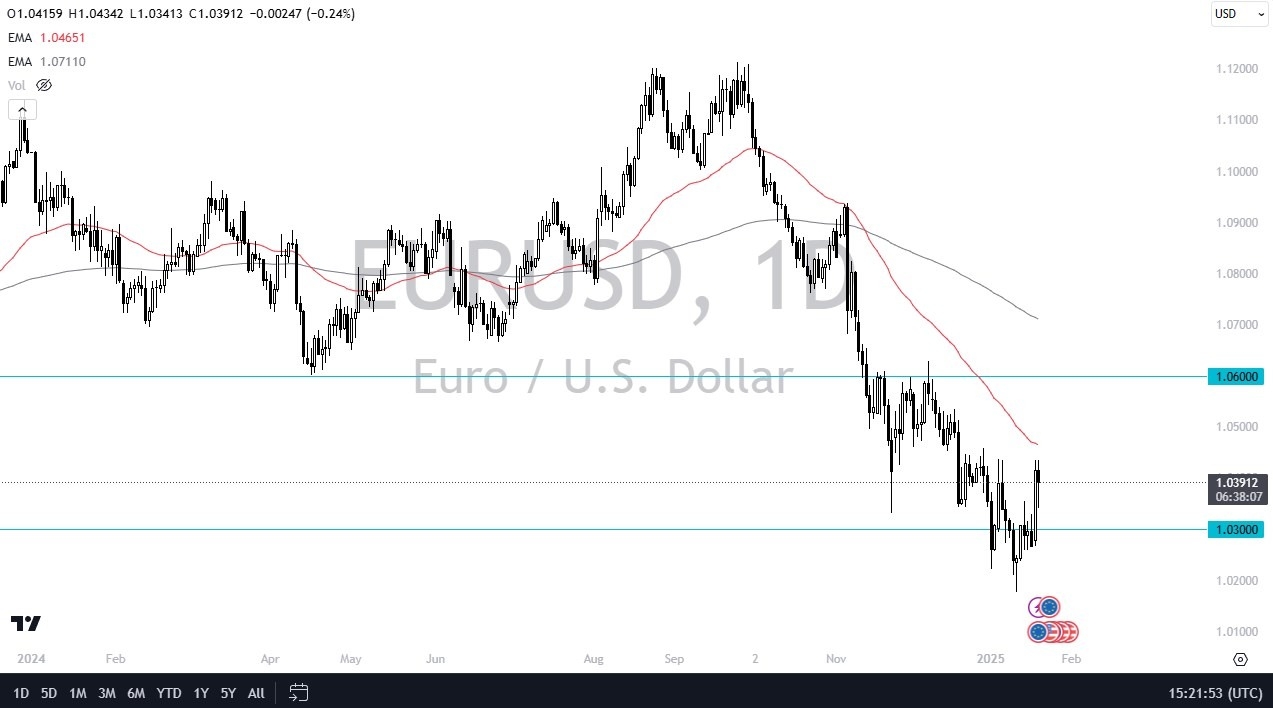
There are a lot of opportunities here though, and this might send the Euro a little higher, but I think there are plenty of reasons to think that the upside is somewhat limited. The 50-day EMA causes a bit of a barrier, and if we can break above there, then we have the 1.06 level offering a barrier as well. And in fact, it’s really not until we get above there that I take any rally seriously. I’ll be looking to buy cheap US dollars, in other words, short this market.
There is quite a bit of interest near the 1.03 level, but until there’s reason to believe that Europe is going to get its house in order, I just don’t have any interest in buying this pair. I think a bounce, and then a shorting opportunity is what you’re looking for. And that’s actually been the case for a moment here. So, with the US dollar being so overbought against so many other currencies, I think it makes sense that we see the Euro, the Australian dollar, the British pound all rise a bit before shorting starts again as interest rates in America continue to be stubbornly strong.
Ready to trade our free trading signals? We’ve made a list of the best European brokers to trade with worth using.
Subsequently, a bearish weekly reversal triggered today, Tuesday, as crude fell below last week’s low of 77.30. This was the first time in seven weeks that a prior weekly low was broken to the downside and reflects the possibility that crude may have topped for now and heading into a correction. Nonetheless, support for the day was seen at 76.15 and it was followed by an intraday bounce. Interesting to see support was seen at the intersection of two trendlines.
Both the longer-term rising line across the bottom of the symmetrical triangle pattern and the more recent rising trendline for the near-term uptrend. Further, the 50-Week MA (not shown) is at 76.37, also in today’s support zone. Crude oil closed above the 50-Week line for the first time since July 2024 two weeks ago. This is the first pullback to test the 50-Week line as support.
It is possible that today’s low completes a pullback before crude is ready to proceed higher. If that is the case, then a decisive breakout above today’s high of 78.32 would provide a daily bullish reversal signal. The first barrier then confronted would be last week’s high of 80.76. If that high can be exceeded and crude stays above it, a breakout above the trendline and triangle formation will be confirmed.
Otherwise, the expectation is for a deeper pullback first. A decline below today’s low of 76.15 would trigger a bearish continuation of the retracement. Price areas to watch for support on the way down include the 38.2% Fibonacci retracement and 200-Day MA at 75.54 and 75.42, respectively. A little lower is the 20-Day MA at 74.75 and the 50% retracement at 73.93.
For a look at all of today’s economic events, check out our economic calendar.