The main category of Forex News.
You can use the search box below to find what you need.
[wd_asp id=1]
The main category of Forex News.
You can use the search box below to find what you need.
[wd_asp id=1]
Ethereum price (ETHUSD) shows bullish bias after leaning on 3222.00$ level in the previous sessions, to keep the bullish trend scenario active on the intraday basis, waiting to gather positive momentum that assist to push the price to breach 3425.50$ and confirm rallying towards 3680.00$ as a next main target.
Holding above 3222.00$ is important to the continuation of the expected decline, as breaking it represents negative factor that will push the price to suffer additional losses that reach 3017.30$.
The expected trading range for today is between 3200.00$ support and 3460.00$ resistance.
Trend forecast: Bullish
Gold price extends its three-day bullish momentum into Wednesday, hitting the highest level in two months at $2,750. A renewed risk-aversion wave appears to put a fresh bid under the Gold price as markets digest US President Donald Trump’s latest tariff threats.
Citing President Trump, Reuters reported earlier in the Asian session, “we are talking about a 10% tariff on China because they sell fentanyl.” Trump said the tariffs will be effective from February 1. He added that the “European Union will be in for tariffs.”
Risk sentiment turned soured as trade war fears intensified on these threats, with Chinese Vice Premier Ding Xuexiang warning that there are “no winners” in a trade war, speaking at the World Economic Forum (WEF) in Davos on Tuesday. The sell-off in Chinese stocks on looming US tariffs revived the flight to safety theme, lifting the safe havens – the US Dollar and the Gold price.
However, it remains to be seen if Gold price sustains the three-day winning streak as risk flows could return as most of these tariffs announced by Trump were priced in, while traders could cheer the US President’s announcement of artificial intelligence (AI) infrastructure investment. Late Tuesday, Trump announced that OpenAI, SoftBank and Oracle will form a joint venture called Stargate and invest up to $500 billion in AI infrastructure.
Meanwhile, “streaming giant Netflix on January 21 released its October-December quarter results, reporting that it added close to 19 million subscribers during the holiday period to surpass 300 million subs in total,” AFP reported. This news could also comfort investors amid mounting trade war fears.
Furthermore, the tepid recovery in the US Treasury bond yields could outweigh the dovish US Federal Reserve (Fed) interest rate cut expectations, capping the upside in the non-yielding Gold price. Markets are pricing in a total easing of 37 basis points (bps) from the Fed this year, with the first-rate cut not fully priced until July, per Refinitive.
That said, fresh tariffs talks and policies from Trump will likely play a pivotal role in impacting the broad market sentiment, eventually influencing the USD and the Gold price.
The daily chart shows that Gold price remains on track to test the record high of $2,790 or the symmetrical triangle target, measured at $2,785.
Gold price charted a symmetrical triangle breakout earlier this month while it holds comfortably above all the major daily simple moving averages (SMA), supporting the bullish case.
The 14-day Relative Strength Index (RSI) continues to grind higher above the midline, currently near 67, keeping buyers hopeful.
Gold price must scale the $2,750 psychological barrier on a daily closing basis to challenge the November 2024 high of $2,762.
The next target is aligned near the aforementioned resistance near $2,790.
On the flip side, Gold price could test the $2,700 round level, below which the 21-day SMA at $2,666 will be threatened.
The 50-day SMA and the 100-day SMA converge at $2,650 seems to be the last line of defense for Gold buyers.
Gold has played a key role in human’s history as it has been widely used as a store of value and medium of exchange. Currently, apart from its shine and usage for jewelry, the precious metal is widely seen as a safe-haven asset, meaning that it is considered a good investment during turbulent times. Gold is also widely seen as a hedge against inflation and against depreciating currencies as it doesn’t rely on any specific issuer or government.
Central banks are the biggest Gold holders. In their aim to support their currencies in turbulent times, central banks tend to diversify their reserves and buy Gold to improve the perceived strength of the economy and the currency. High Gold reserves can be a source of trust for a country’s solvency. Central banks added 1,136 tonnes of Gold worth around $70 billion to their reserves in 2022, according to data from the World Gold Council. This is the highest yearly purchase since records began. Central banks from emerging economies such as China, India and Turkey are quickly increasing their Gold reserves.
Gold has an inverse correlation with the US Dollar and US Treasuries, which are both major reserve and safe-haven assets. When the Dollar depreciates, Gold tends to rise, enabling investors and central banks to diversify their assets in turbulent times. Gold is also inversely correlated with risk assets. A rally in the stock market tends to weaken Gold price, while sell-offs in riskier markets tend to favor the precious metal.
The price can move due to a wide range of factors. Geopolitical instability or fears of a deep recession can quickly make Gold price escalate due to its safe-haven status. As a yield-less asset, Gold tends to rise with lower interest rates, while higher cost of money usually weighs down on the yellow metal. Still, most moves depend on how the US Dollar (USD) behaves as the asset is priced in dollars (XAU/USD). A strong Dollar tends to keep the price of Gold controlled, whereas a weaker Dollar is likely to push Gold prices up.
The stock not only achieved this historic milestone, but also continued its record brilliance and remarkable performance, reaching unprecedented levels in November and December of 2024.
However, the stock experienced a slight decline at the beginning of 2025 trading sessions due to correction activities and profit-taking, coinciding with investors’ aversion to risk before the inauguration of the elected U.S. President “Donald Trump” on January 20.
Driven by the rise in managed assets to unprecedented levels, which surprised global markets and enhanced its reputation as the world’s largest asset manager.
Throughout 2024, BlackRock’s managed assets recorded a series of record levels, driven by strong cash flows into the company’s funds, especially funds focused on sustainable investment.
This trend reflects the increasing interest of global investors in investing in assets that adhere to Environmental, Social, and Governance (ESG) standards, a field in which BlackRock has led in innovation and expanding products.
Additionally, technology played a vital role in boosting market confidence in the company, as BlackRock continued to invest in developing the “Aladdin” platform, which is a leading analytical tool for risk management and portfolio analysis.
The company also benefited from expansion into emerging markets, focusing its strategy on providing integrated investment solutions to meet the needs of major institutions.
These factors, along with the recovery of global markets and increasing investor appetite for risk, contributed to pushing the stock towards achieving unprecedented levels, making it a focal point for investors around the world.
As investors enter 2025 with high expectations, the main question remains: Can BlackRock’s stock maintain this strong performance or even achieve further rises to new historical levels?
BlackRock was founded in 1988 by a group of financial experts led by “Larry Fink,” and it is today considered the world’s largest asset management company. The company’s headquarters are located in New York City, United States.
BlackRock focuses on providing investment management and risk management services to institutional clients and individuals around the world.
The company manages a diverse range of financial instruments, including equities, bonds, and Exchange-Traded Funds (ETFs), among which its iShares brand is one of the most well-known in this field.
By 2024, BlackRock’s managed assets surpassed the $10 trillion mark, reflecting its dominant strength in the financial sector and its ability to attract massive financial flows from various global markets.
The Aladdin platform is one of the company’s most prominent achievements, an integrated system for risk management and portfolio analysis.
This tool is used by over 200 financial institutions, enhancing BlackRock’s position as a leader in providing advanced technological solutions.
Larry Fink serves as the CEO, and he is renowned for guiding BlackRock towards global expansion and innovation. Under his leadership, the company has become a key player in shaping the future of investment and risk management.
Larry Fink is the CEO and founder of BlackRock, the world’s largest asset manager. Born on November 2, 1952, in Los Angeles, California, he studied political science at the University of California, Los Angeles before obtaining an MBA from UCLA.
He began his career at First Boston Bank, where he worked on developing the mortgage-backed securities market, then founded BlackRock in 1988. Under his leadership, BlackRock transformed from a small company into a financial empire managing over $10 trillion in assets, and is a leading company in financial innovation, including the development of the Aladdin platform and Exchange-Traded Funds.
Fink is considered one of the biggest advocates for sustainable investment and social responsibility (ESG), encouraging companies and investors to focus on environmental and social standards in their strategies.
Thanks to his vision, Larry Fink’s name appears on lists of the most influential figures in the world. Additionally, BlackRock is skillfully managed, guiding the company towards strategic expansions in global markets, making him one of the foremost financial leaders of the 21st century.
iShares is among the most prominent brands offered by BlackRock, encompassing a range of ETFs that allow investors to access a variety of assets, including equities, bonds, and emerging markets.
These funds provide opportunities for diversification and achieving stable returns across multiple markets.
BlackRock offers a wide range of mutual funds that include various investment strategies, including investments in equities, bonds, alternative assets, and sustainable products.
These funds allow investors to allocate their portfolios according to their financial goals and potential risks.
BlackRock is a leading company in sustainable investment, offering many funds that focus on Environmental, Social, and Governance (ESG) standards.
These products meet the needs of investors seeking to make a positive social and environmental impact through their investments.
BlackRock’s real estate funds allow investors to invest in diverse real estate assets worldwide.
These products include global real estate funds and investments in tangible assets, providing diversification opportunities for investors.
Aladdin (Asset, Liability, Debt and Derivative Investment Network) is an integrated system for risk management and portfolio analysis, developed and managed by BlackRock.
It is considered one of the company’s key technological assets and is widely used by financial institutions and investors worldwide.
BlackRock also offers actively managed funds, where a professional management team makes investment decisions based on thorough market analysis.
These funds aim to achieve performance that outperforms benchmark indices.
BlackRock provides investment strategies in bonds, including government bonds, high-yield bonds, short-term and long-term bonds, as well as emerging market bonds.
These products enable investors to diversify their investments and achieve steady returns.
BlackRock offers alternative investments, including private markets, private equity, commodities, and other alternative assets.
These products help investors diversify their portfolios and achieve non-traditional returns.
As part of its expansion into the digital asset market, BlackRock introduced a Bitcoin ETF, allowing investors to trade Bitcoin within a regulated financial framework.
This fund is one of BlackRock’s most prominent products in the digital currency sector, providing investors the opportunity to access the world’s largest cryptocurrency within traditional investment frameworks.
At the beginning of 2024, BlackRock managed assets valued at $9.1 trillion. By the third quarter of the same year, these assets had risen to $11.48 trillion, reflecting an increase of $2.38 trillion.
This growth represents an approximately 26% increase during the first nine months of 2024.
This increase is attributed to strong investment inflows, with investors adding $221 billion to BlackRock’s assets during the third quarter of 2024.
Additionally, private markets contributed to this growth, reflecting the diversification of investment strategies adopted by the company.
These figures demonstrate BlackRock’s ability to attract investments and maintain investor confidence, enhancing its position as the world’s largest asset manager.
Aladdin (Asset, Liability, Debt and Derivative Investment Network) is an integrated system for risk management and portfolio analysis, developed and managed by BlackRock.
It is considered one of the company’s key technological assets and is widely used by financial institutions and investors worldwide.
With the continuous evolution in financial technology and the increasing demand for tools that integrate artificial intelligence and advanced analytics, Aladdin is expected to remain at the forefront of risk management and investment analysis platforms, further enhancing BlackRock’s position as a leading company in this field.
The BlackRock Bitcoin Fund is an investment product offered by BlackRock, the world’s largest asset manager, targeting investment in Bitcoin.
This fund aims to provide an easy and secure way for traditional investors to gain direct exposure to Bitcoin’s price without the need to own or manage the digital currency directly.
| Key Q3 Financial Results | Value | Change Compared to Q3 2023 |
|---|---|---|
| Revenue | $5.20 billion | Up by 15% |
| Net Income | $1.63 billion | Up by 1.7% |
| Profit Margin | 31% | Down from 36% |
| Earnings Per Share | $11.02 | Up from $10.75 |
The decline in profit margin is attributed to increased expenses.
Brief Analyses and Forecasts for BlackRock’s Stock:
Factors affecting BlackRock’s stock forecasts in 2025:-
BlackRock’s stock is currently trading around $1,000. In light of most forecasts indicating an upward trend in 2025, we believe that levels between $850 and $750 are appropriate for investment, with a target above $1,200 in 2025 and approaching $2,000 by the end of 2026.
Investing in BlackRock is one of the most prominent opportunities that investors in the technology sector are interested in. Here are some common ways to invest in BlackRock:
Buying BlackRock shares (BLK) on the stock exchange is the most straightforward way to invest. BlackRock is listed on the New York Stock Exchange, and its shares can be purchased through a trading account at financial brokerage firms.
Be aware of the market fluctuations associated with BlackRock’s shares, as they often experience sharp price volatility.
Investing in BlackRock indirectly through ETFs or mutual funds that include BlackRock shares within their portfolios is possible.
This type of investment helps diversify the portfolio and reduce risks associated with owning a single stock.
Some investors prefer to hold BlackRock shares long-term to benefit from the company’s potential growth in the future.
Long-term investment strategies are based on the belief that the company will continue leading the technology sector.
Investors can also use speculation or day trading strategies to take advantage of daily fluctuations in BlackRock’s stock price.
However, this type of trading requires expertise and a good understanding of the market due to the high risks involved.
Investment Tips for BlackRock:
In light of recent developments in other global markets, especially after Donald Trump’s victory in the U.S. elections, it is not entirely out of the question for BlackRock’s stock to rise to $1,500 by the end of 2025.
Yes, the rise of BlackRock’s stock is expected to continue next year, as most major institutions, banks, and experts are confident that BlackRock’s stock is in a rising market.
BlackRock’s stock began an upward wave in the last quarter of 2022 from the $503.12 area and reached historic record levels, recently hitting $1,082.45. From there, the stock started to decline, undergoing a downward correction of the aforementioned rise. We observe that the price tested the first correction level, 23.6% Fibonacci at $945.73, and bounced up from there in an attempt to compensate for some recent losses.
The price is stabilizing below the 50-day exponential moving average, which forms a strong resistance against the price, while the Stochastic indicator loses its positive momentum significantly, enhancing the chances of facing more negative pressures. It is noted that breaking the mentioned corrective level will force the price to undergo further downward correction, heading towards visiting the $861.15 areas after surpassing the first corrective level.
In studying the instant timeframes, we find that the price completed a head and shoulders pattern, encouraging the stock to decline and perform the proposed downward correction. It is noted that the price managed to achieve the full target of this pattern, meeting the first corrective level, which led to recent gains and a recovery in the instant term before determining its next short and medium-term fate.
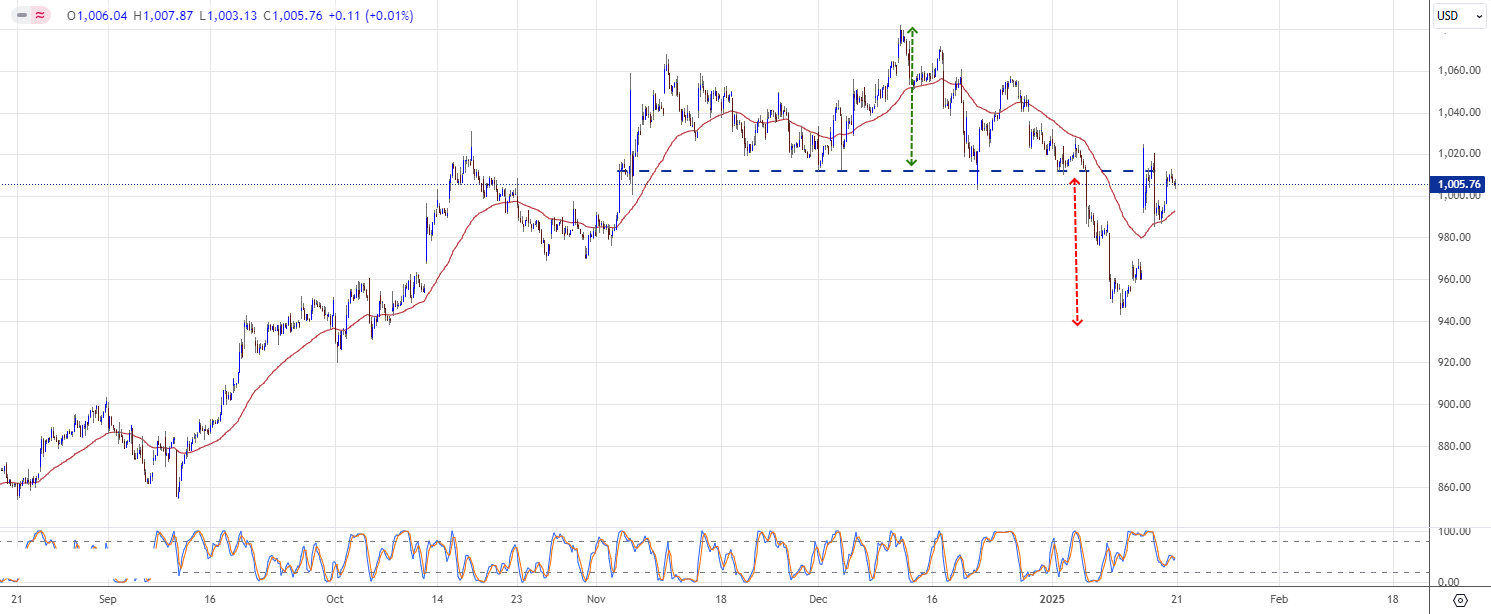
On the other hand, we observe that there is a descending channel organizing the downward corrective wave. Movement within it, according to the proposed scenario in the following chart, indicates opportunities to surpass the $945.73 level and perform further downward correction in the short term.
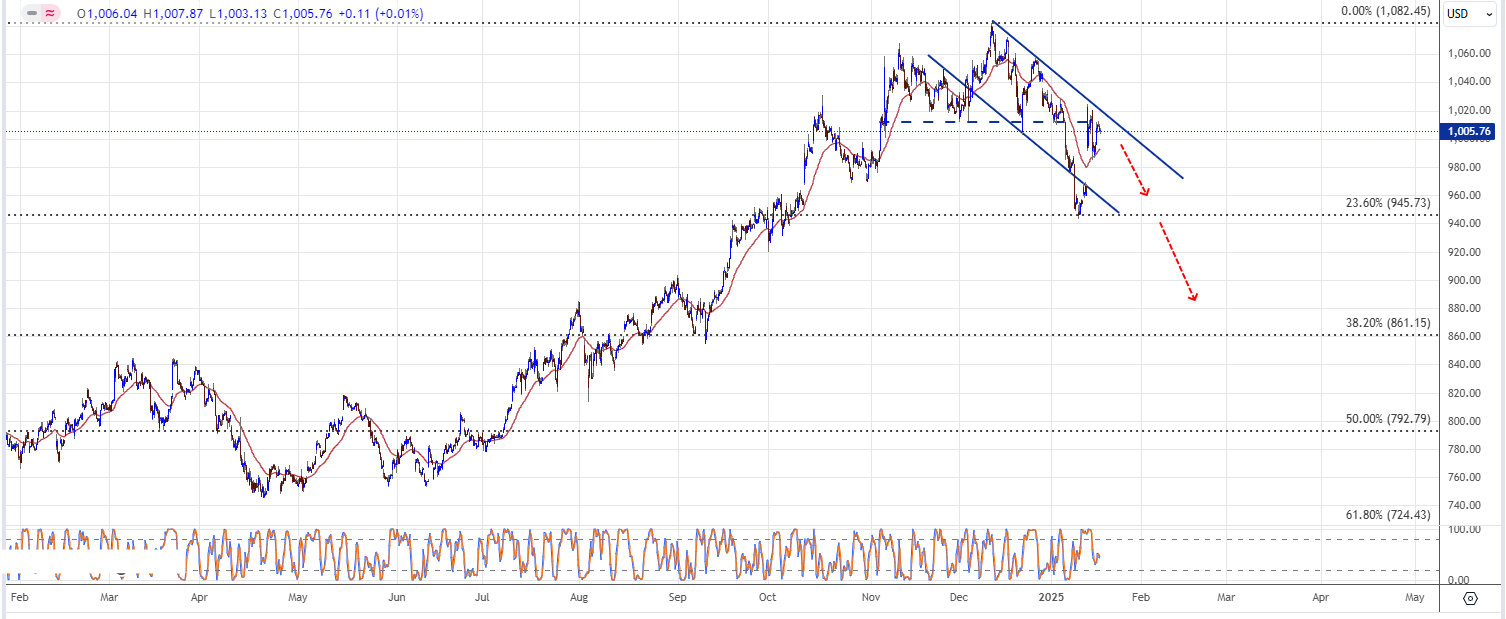
In summary, we indicate that the expected trend for the upcoming period is downward based on the negative technical factors mentioned above. However, it should be considered that breaking the $1,015.00 and then $1,035.00 levels will stop the downward correction and lead the price to resume the main upward trend again, aiming to achieve additional gains and record new historic levels surpassing the $1,082.45 barrier.
In studying the instant timeframes, we find that the price completed a head and shoulders pattern, encouraging the stock to decline and perform the proposed downward correction. It is noted that the price managed to achieve the full target of this pattern, meeting the first corrective level, which led to recent gains and a recovery in the instant term before determining its next short and medium-term fate.
On the other hand, we observe that there is a descending channel organizing the downward corrective wave. Movement within it, according to the proposed scenario in the following chart, indicates opportunities to surpass the $945.73 level and perform further downward correction in the short term.
In summary, we indicate that the expected trend for the upcoming period is downward based on the negative technical factors mentioned above. However, it should be considered that breaking the $1,015.00 and then $1,035.00 levels will stop the downward correction and lead the price to resume the main upward trend again, aiming to achieve additional gains and record new historic levels surpassing the $1,082.45 barrier.
Conversely, it is crucial to note that failing to confirm the breach of $78.90 and a downward rebound breaking the $74.60 level will force the price to turn downward, incurring new losses that could reach areas of $63.40 in the short term.
The GBPJPY pair confirmed getting rid of the negative pressures after touching 190.50 level yesterday, to notice reacting to stochastic positivity by surpassing 191.80 barrier and attempt to cover more previously suffered losses by settling near 192.30.
Note that forming continuous support at 189.30 will confirm the price surrender to the bullish track on the near-term and medium-term basis, to expect rallying towards 192.90 soon followed by attempting to press on the additional resistance at 194.10.
The expected trading range for today is between 191.45 and 192.90
Trend forecast: Bullish
The stock not only achieved this historic milestone, but also continued its record brilliance and remarkable performance, reaching unprecedented levels in November and December of 2024.
However, the stock experienced a slight decline at the beginning of 2025 trading sessions due to correction activities and profit-taking, coinciding with investors’ aversion to risk before the inauguration of the elected U.S. President “Donald Trump” on January 20.
Driven by the rise in managed assets to unprecedented levels, which surprised global markets and enhanced its reputation as the world’s largest asset manager.
Throughout 2024, BlackRock’s managed assets recorded a series of record levels, driven by strong cash flows into the company’s funds, especially funds focused on sustainable investment.
This trend reflects the increasing interest of global investors in investing in assets that adhere to Environmental, Social, and Governance (ESG) standards, a field in which BlackRock has led in innovation and expanding products.
Additionally, technology played a vital role in boosting market confidence in the company, as BlackRock continued to invest in developing the “Aladdin” platform, which is a leading analytical tool for risk management and portfolio analysis.
The company also benefited from expansion into emerging markets, focusing its strategy on providing integrated investment solutions to meet the needs of major institutions.
These factors, along with the recovery of global markets and increasing investor appetite for risk, contributed to pushing the stock towards achieving unprecedented levels, making it a focal point for investors around the world.
As investors enter 2025 with high expectations, the main question remains: Can BlackRock’s stock maintain this strong performance or even achieve further rises to new historical levels?
BlackRock was founded in 1988 by a group of financial experts led by “Larry Fink,” and it is today considered the world’s largest asset management company. The company’s headquarters are located in New York City, United States.
BlackRock focuses on providing investment management and risk management services to institutional clients and individuals around the world.
The company manages a diverse range of financial instruments, including equities, bonds, and Exchange-Traded Funds (ETFs), among which its iShares brand is one of the most well-known in this field.
By 2024, BlackRock’s managed assets surpassed the $10 trillion mark, reflecting its dominant strength in the financial sector and its ability to attract massive financial flows from various global markets.
The Aladdin platform is one of the company’s most prominent achievements, an integrated system for risk management and portfolio analysis.
This tool is used by over 200 financial institutions, enhancing BlackRock’s position as a leader in providing advanced technological solutions.
Larry Fink serves as the CEO, and he is renowned for guiding BlackRock towards global expansion and innovation. Under his leadership, the company has become a key player in shaping the future of investment and risk management.
Larry Fink is the CEO and founder of BlackRock, the world’s largest asset manager. Born on November 2, 1952, in Los Angeles, California, he studied political science at the University of California, Los Angeles before obtaining an MBA from UCLA.
He began his career at First Boston Bank, where he worked on developing the mortgage-backed securities market, then founded BlackRock in 1988. Under his leadership, BlackRock transformed from a small company into a financial empire managing over $10 trillion in assets, and is a leading company in financial innovation, including the development of the Aladdin platform and Exchange-Traded Funds.
Fink is considered one of the biggest advocates for sustainable investment and social responsibility (ESG), encouraging companies and investors to focus on environmental and social standards in their strategies.
Thanks to his vision, Larry Fink’s name appears on lists of the most influential figures in the world. Additionally, BlackRock is skillfully managed, guiding the company towards strategic expansions in global markets, making him one of the foremost financial leaders of the 21st century.
iShares is among the most prominent brands offered by BlackRock, encompassing a range of ETFs that allow investors to access a variety of assets, including equities, bonds, and emerging markets.
These funds provide opportunities for diversification and achieving stable returns across multiple markets.
BlackRock offers a wide range of mutual funds that include various investment strategies, including investments in equities, bonds, alternative assets, and sustainable products.
These funds allow investors to allocate their portfolios according to their financial goals and potential risks.
BlackRock is a leading company in sustainable investment, offering many funds that focus on Environmental, Social, and Governance (ESG) standards.
These products meet the needs of investors seeking to make a positive social and environmental impact through their investments.
BlackRock’s real estate funds allow investors to invest in diverse real estate assets worldwide.
These products include global real estate funds and investments in tangible assets, providing diversification opportunities for investors.
Aladdin (Asset, Liability, Debt and Derivative Investment Network) is an integrated system for risk management and portfolio analysis, developed and managed by BlackRock.
It is considered one of the company’s key technological assets and is widely used by financial institutions and investors worldwide.
BlackRock also offers actively managed funds, where a professional management team makes investment decisions based on thorough market analysis.
These funds aim to achieve performance that outperforms benchmark indices.
BlackRock provides investment strategies in bonds, including government bonds, high-yield bonds, short-term and long-term bonds, as well as emerging market bonds.
These products enable investors to diversify their investments and achieve steady returns.
BlackRock offers alternative investments, including private markets, private equity, commodities, and other alternative assets.
These products help investors diversify their portfolios and achieve non-traditional returns.
As part of its expansion into the digital asset market, BlackRock introduced a Bitcoin ETF, allowing investors to trade Bitcoin within a regulated financial framework.
This fund is one of BlackRock’s most prominent products in the digital currency sector, providing investors the opportunity to access the world’s largest cryptocurrency within traditional investment frameworks.
At the beginning of 2024, BlackRock managed assets valued at $9.1 trillion. By the third quarter of the same year, these assets had risen to $11.48 trillion, reflecting an increase of $2.38 trillion.
This growth represents an approximately 26% increase during the first nine months of 2024.
This increase is attributed to strong investment inflows, with investors adding $221 billion to BlackRock’s assets during the third quarter of 2024.
Additionally, private markets contributed to this growth, reflecting the diversification of investment strategies adopted by the company.
These figures demonstrate BlackRock’s ability to attract investments and maintain investor confidence, enhancing its position as the world’s largest asset manager.
Aladdin (Asset, Liability, Debt and Derivative Investment Network) is an integrated system for risk management and portfolio analysis, developed and managed by BlackRock.
It is considered one of the company’s key technological assets and is widely used by financial institutions and investors worldwide.
With the continuous evolution in financial technology and the increasing demand for tools that integrate artificial intelligence and advanced analytics, Aladdin is expected to remain at the forefront of risk management and investment analysis platforms, further enhancing BlackRock’s position as a leading company in this field.
The BlackRock Bitcoin Fund is an investment product offered by BlackRock, the world’s largest asset manager, targeting investment in Bitcoin.
This fund aims to provide an easy and secure way for traditional investors to gain direct exposure to Bitcoin’s price without the need to own or manage the digital currency directly.
| Key Q3 Financial Results | Value | Change Compared to Q3 2023 |
|---|---|---|
| Revenue | $5.20 billion | Up by 15% |
| Net Income | $1.63 billion | Up by 1.7% |
| Profit Margin | 31% | Down from 36% |
| Earnings Per Share | $11.02 | Up from $10.75 |
The decline in profit margin is attributed to increased expenses.
Brief Analyses and Forecasts for BlackRock’s Stock:
Factors affecting BlackRock’s stock forecasts in 2025:-
BlackRock’s stock is currently trading around $1,000. In light of most forecasts indicating an upward trend in 2025, we believe that levels between $850 and $750 are appropriate for investment, with a target above $1,200 in 2025 and approaching $2,000 by the end of 2026.
Investing in BlackRock is one of the most prominent opportunities that investors in the technology sector are interested in. Here are some common ways to invest in BlackRock:
Buying BlackRock shares (BLK) on the stock exchange is the most straightforward way to invest. BlackRock is listed on the New York Stock Exchange, and its shares can be purchased through a trading account at financial brokerage firms.
Be aware of the market fluctuations associated with BlackRock’s shares, as they often experience sharp price volatility.
Investing in BlackRock indirectly through ETFs or mutual funds that include BlackRock shares within their portfolios is possible.
This type of investment helps diversify the portfolio and reduce risks associated with owning a single stock.
Some investors prefer to hold BlackRock shares long-term to benefit from the company’s potential growth in the future.
Long-term investment strategies are based on the belief that the company will continue leading the technology sector.
Investors can also use speculation or day trading strategies to take advantage of daily fluctuations in BlackRock’s stock price.
However, this type of trading requires expertise and a good understanding of the market due to the high risks involved.
Investment Tips for BlackRock:
In light of recent developments in other global markets, especially after Donald Trump’s victory in the U.S. elections, it is not entirely out of the question for BlackRock’s stock to rise to $1,500 by the end of 2025.
Yes, the rise of BlackRock’s stock is expected to continue next year, as most major institutions, banks, and experts are confident that BlackRock’s stock is in a rising market.
BlackRock’s stock began an upward wave in the last quarter of 2022 from the $503.12 area and reached historic record levels, recently hitting $1,082.45. From there, the stock started to decline, undergoing a downward correction of the aforementioned rise. We observe that the price tested the first correction level, 23.6% Fibonacci at $945.73, and bounced up from there in an attempt to compensate for some recent losses.
The price is stabilizing below the 50-day exponential moving average, which forms a strong resistance against the price, while the Stochastic indicator loses its positive momentum significantly, enhancing the chances of facing more negative pressures. It is noted that breaking the mentioned corrective level will force the price to undergo further downward correction, heading towards visiting the $861.15 areas after surpassing the first corrective level.
In studying the instant timeframes, we find that the price completed a head and shoulders pattern, encouraging the stock to decline and perform the proposed downward correction. It is noted that the price managed to achieve the full target of this pattern, meeting the first corrective level, which led to recent gains and a recovery in the instant term before determining its next short and medium-term fate.
On the other hand, we observe that there is a descending channel organizing the downward corrective wave. Movement within it, according to the proposed scenario in the following chart, indicates opportunities to surpass the $945.73 level and perform further downward correction in the short term.
In summary, we indicate that the expected trend for the upcoming period is downward based on the negative technical factors mentioned above. However, it should be considered that breaking the $1,015.00 and then $1,035.00 levels will stop the downward correction and lead the price to resume the main upward trend again, aiming to achieve additional gains and record new historic levels surpassing the $1,082.45 barrier.
In studying the instant timeframes, we find that the price completed a head and shoulders pattern, encouraging the stock to decline and perform the proposed downward correction. It is noted that the price managed to achieve the full target of this pattern, meeting the first corrective level, which led to recent gains and a recovery in the instant term before determining its next short and medium-term fate.
On the other hand, we observe that there is a descending channel organizing the downward corrective wave. Movement within it, according to the proposed scenario in the following chart, indicates opportunities to surpass the $945.73 level and perform further downward correction in the short term.
In summary, we indicate that the expected trend for the upcoming period is downward based on the negative technical factors mentioned above. However, it should be considered that breaking the $1,015.00 and then $1,035.00 levels will stop the downward correction and lead the price to resume the main upward trend again, aiming to achieve additional gains and record new historic levels surpassing the $1,082.45 barrier.
Conversely, it is crucial to note that failing to confirm the breach of $78.90 and a downward rebound breaking the $74.60 level will force the price to turn downward, incurring new losses that could reach areas of $63.40 in the short term.
Silver price (XAG/USD) extends its gains for the third successive session, trading around $30.80 per troy ounce during Asian hours on Wednesday. A daily chart analysis indicates a prevailing bullish bias for the precious metal, as its price continues to rise within an ascending channel pattern.
Short-term momentum is strong, with the XAG/USD pair trading above both the nine-day and 14-day Exponential Moving Averages (EMAs). Additionally, the 14-day Relative Strength Index (RSI) is positioned above the 50 level, reinforcing the active bullish sentiment.
On the upside, the Silver price could find its initial resistance around the upper boundary of the ascending channel at $31.80. A breakout above this level could boost market sentiment and drive the XAG/USD pair toward its two-month high of $32.28, last achieved on December 9.
Immediate support is located at a nine-day EMA of $30.47, followed closely by a 14-day EMA of $30.32. Further support appears around the ascending channel’s lower boundary at $30.00. A break below this channel would cause the emergence of the bearish bias and put pressure on the XAG/USD pair to navigate the region around its four-month low of $28.74, recorded on December 19.
Silver is a precious metal highly traded among investors. It has been historically used as a store of value and a medium of exchange. Although less popular than Gold, traders may turn to Silver to diversify their investment portfolio, for its intrinsic value or as a potential hedge during high-inflation periods. Investors can buy physical Silver, in coins or in bars, or trade it through vehicles such as Exchange Traded Funds, which track its price on international markets.
Silver prices can move due to a wide range of factors. Geopolitical instability or fears of a deep recession can make Silver price escalate due to its safe-haven status, although to a lesser extent than Gold’s. As a yieldless asset, Silver tends to rise with lower interest rates. Its moves also depend on how the US Dollar (USD) behaves as the asset is priced in dollars (XAG/USD). A strong Dollar tends to keep the price of Silver at bay, whereas a weaker Dollar is likely to propel prices up. Other factors such as investment demand, mining supply – Silver is much more abundant than Gold – and recycling rates can also affect prices.
Silver is widely used in industry, particularly in sectors such as electronics or solar energy, as it has one of the highest electric conductivity of all metals – more than Copper and Gold. A surge in demand can increase prices, while a decline tends to lower them. Dynamics in the US, Chinese and Indian economies can also contribute to price swings: for the US and particularly China, their big industrial sectors use Silver in various processes; in India, consumers’ demand for the precious metal for jewellery also plays a key role in setting prices.
Silver prices tend to follow Gold’s moves. When Gold prices rise, Silver typically follows suit, as their status as safe-haven assets is similar. The Gold/Silver ratio, which shows the number of ounces of Silver needed to equal the value of one ounce of Gold, may help to determine the relative valuation between both metals. Some investors may consider a high ratio as an indicator that Silver is undervalued, or Gold is overvalued. On the contrary, a low ratio might suggest that Gold is undervalued relative to Silver.
Qualcomm Incorporated’s stock price (QCOM) rose in the intraday levels, confirming that it shook off the negative pressure due to piercing the downward correctional trend line in the short term, while trespassing the resistance of the 50-day SMA, coupled with positive signals from the RSI despite reaching overbought levels.
Therefore we expect more gains for the stock, provided it settles firmly above the support of $156.34, targeting the resistance of $177.6.
Trend forecast for today: Bullish
The narrowing interest rate differentials between Japan and the rest of the world has been a key theme in the improving Japanese yen forecast in the last couple of weeks. The main USD/JPY pair dropped to fresh five-week lows on Tuesday, before bouncing back to trade in the green at the time of writing, while yen pairs such as the CAD/JPY, which have been falling even more sharply because of Trump’s plans to impose tariffs on Canada’s exports to the US, remained in the red. The yen has also shown relative strength against other commodity dollars as well. Pairs such as the AUD/JPY and NZD/JPY remained on the backfoot.
With a Bank of Japan (BoJ) rate hike this week almost fully priced in, could this recent USD/JPY dip offer a buy-the-dip opportunity, or will we see a more decisive bullish trend emerge for the yen?
As US-Japan yield spreads hit five-week lows, USD/JPY followed. However, with inflation risks heightened by potential large-scale tariffs, the recent yield compression may be nearing its limit, you would think. Thus, for the USD/JPY to drop more markedly, we will need to see a hawkish rate hike from the BoJ this week, or a significant deterioration in US data.
Rates markets are currently pricing in two full 25bp hikes by the end of 2025, with the first one arriving this week. Thus, if the BoJ opts for a smaller hike or no hike at all, that could trigger significant downside for the yen.
Yesterday, there was initial optimism surrounding trade policy before Trump’s inauguration speech. But later this was overshadowed by news that the Trump Administration is likely to implement 25% tariffs on imports from Canada and Mexico starting in February. So, tariffs are still on the horizon, though not as soon as Trump had made it out to be case.
We initially saw a big relief rally in the likes of the Canadian dollar, Mexican peso, and the euro yesterday as Trump, when addressing tariffs, did not specify a timeline. In fact, he referred to himself as a “peacemaker and a unifier,” which suggests he may avoid actions that could cause significant tensions with other nations through sweeping tariffs. However, this should not have been mistaken as a softening of his stance, because later, he said his government would impose 25% tariffs on imports from both sides of its borders.
Trump intends to overhaul the trade system in order to “tariff and tax foreign countries to enrich our citizens” through the creation of an “external revenue service.” His goals to reform international trade policies clearly prioritize American industries and aim to reduce trade deficits. By imposing tariffs on imports, revenue would be redirected toward domestic economic growth and infrastructure development.
We have already seen repeated multi-year highs in the USD/CAD pair in recent months, and the Loonie hit a new high of just above 1.4500 overnight following Trump’s February 1 tariff threat, and despite its sizeable drop the prior day. Now with the USD/JPY moving into consolidation mode, the ongoing weakness in the CAD means the CAD/JPY pair could be poised for a breakdown – Canadian CPI data permitting. CPI is expected to drop 0.7% m/m.

The CAD/JPY has tried to break below its bullish trend line, but so far, the bears haven’t been quite successful. However, as the yield spread between Japan and the rest of the world narrows, while risks of tariffs for Canada’s exports grow, we could see the CAD/JPY break lower and potentially head down to the next support levels situated at 106.00 and then 105.00.

With the US dollar still remaining largely supported against other currencies, the USD/JPY may not be the best yen cross for those who are bullish on the Japanese currency. Still, given the narrowing yield spreads, I do think the upside is fairly limited for the USD/JPY from here.
USD/JPY’s dip overnight was brought around the minor horizontal support at 155.00. However, if rates resume lower and we go below this level, then you have a short-term uptrend that was established from September, around 144.00, to keep an eye on, followed by the 200-day moving average around 152.80 area.
For traders who are bullish the USD/JPY, they will now want to see rates breaking key short-term resistance around 156.00-156.75 area. A decisive break here would signal bullish sentiment, potentially opening the door for follow-up technical buying towards 160.00. But this is not my base case scenario.
Source for all charts used in this article: TradingView.com
— Written by Fawad Razaqzada, Market Analyst
Follow Fawad on Twitter @Trader_F_R
On the upside, a bullish reversal would be indicated on a rally above today’s high of 3.91. Natural gas would then be heading up into a potential resistance zone defined by the prior six days of price history. The bull trend does not continue until there is a rally above the recent trend high of 4.37. In the meantime, natural gas needs to contend with a possible deeper pullback as trend support is being threatened.
The medium-term outlook for natural gas remains bullish given the breakout of a large symmetrical pattern in the second half of November. That breakout was accompanied by a bullish trend continuation signal and followed by a trend reversal signal on the advance above the lower swing high of 3.64 on December 20. These are all bullish signals for the medium-term.
In the short term, natural gas could still correct further as a normal component of a bullish trend continuation pattern of an advance followed by profit taking and a pullback. However, until the lower end of the support zone noted above at 3.64 is broken to the downside, the possibility of a continuation higher remains.
A continuation of the bearish correction on a decisive drop below 3.64 will put natural gas in a position to test support around a price zone from 3.52 to 3.51. That zone consists of the 127.2% extended target for a small falling ABCD pattern and the 61.8% Fibonacci retracement level, respectively. Moreover, last week’s high of 4.33 generated a lower swing low and possible second top of a double top pattern.
For a look at all of today’s economic events, check out our economic calendar.
The narrowing interest rate differentials between Japan and the rest of the world has been a key theme in the improving Japanese yen forecast in the last couple of weeks. The main USD/JPY pair dropped to fresh five-week lows on Tuesday, before bouncing back to trade in the green at the time of writing, while yen pairs such as the CAD/JPY, which have been falling even more sharply because of Trump’s plans to impose tariffs on Canada’s exports to the US, remained in the red. The yen has also shown relative strength against other commodity dollars as well. Pairs such as the AUD/JPY and NZD/JPY remained on the backfoot.
With a Bank of Japan (BoJ) rate hike this week almost fully priced in, could this recent USD/JPY dip offer a buy-the-dip opportunity, or will we see a more decisive bullish trend emerge for the yen?
As US-Japan yield spreads hit five-week lows, USD/JPY followed. However, with inflation risks heightened by potential large-scale tariffs, the recent yield compression may be nearing its limit, you would think. Thus, for the USD/JPY to drop more markedly, we will need to see a hawkish rate hike from the BoJ this week, or a significant deterioration in US data.
Rates markets are currently pricing in two full 25bp hikes by the end of 2025, with the first one arriving this week. Thus, if the BoJ opts for a smaller hike or no hike at all, that could trigger significant downside for the yen.
Yesterday, there was initial optimism surrounding trade policy before Trump’s inauguration speech. But later this was overshadowed by news that the Trump Administration is likely to implement 25% tariffs on imports from Canada and Mexico starting in February. So, tariffs are still on the horizon, though not as soon as Trump had made it out to be case.
We initially saw a big relief rally in the likes of the Canadian dollar, Mexican peso, and the euro yesterday as Trump, when addressing tariffs, did not specify a timeline. In fact, he referred to himself as a “peacemaker and a unifier,” which suggests he may avoid actions that could cause significant tensions with other nations through sweeping tariffs. However, this should not have been mistaken as a softening of his stance, because later, he said his government would impose 25% tariffs on imports from both sides of its borders.
Trump intends to overhaul the trade system in order to “tariff and tax foreign countries to enrich our citizens” through the creation of an “external revenue service.” His goals to reform international trade policies clearly prioritize American industries and aim to reduce trade deficits. By imposing tariffs on imports, revenue would be redirected toward domestic economic growth and infrastructure development.
We have already seen repeated multi-year highs in the USD/CAD pair in recent months, and the Loonie hit a new high of just above 1.4500 overnight following Trump’s February 1 tariff threat, and despite its sizeable drop the prior day. Now with the USD/JPY moving into consolidation mode, the ongoing weakness in the CAD means the CAD/JPY pair could be poised for a breakdown – Canadian CPI data permitting. CPI is expected to drop 0.7% m/m.

The CAD/JPY has tried to break below its bullish trend line, but so far, the bears haven’t been quite successful. However, as the yield spread between Japan and the rest of the world narrows, while risks of tariffs for Canada’s exports grow, we could see the CAD/JPY break lower and potentially head down to the next support levels situated at 106.00 and then 105.00.

With the US dollar still remaining largely supported against other currencies, the USD/JPY may not be the best yen cross for those who are bullish on the Japanese currency. Still, given the narrowing yield spreads, I do think the upside is fairly limited for the USD/JPY from here.
USD/JPY’s dip overnight was brought around the minor horizontal support at 155.00. However, if rates resume lower and we go below this level, then you have a short-term uptrend that was established from September, around 144.00, to keep an eye on, followed by the 200-day moving average around 152.80 area.
For traders who are bullish the USD/JPY, they will now want to see rates breaking key short-term resistance around 156.00-156.75 area. A decisive break here would signal bullish sentiment, potentially opening the door for follow-up technical buying towards 160.00. But this is not my base case scenario.
Source for all charts used in this article: TradingView.com
— Written by Fawad Razaqzada, Market Analyst
Follow Fawad on Twitter @Trader_F_R