The main category of Forex News.
You can use the search box below to find what you need.
[wd_asp id=1]
The main category of Forex News.
You can use the search box below to find what you need.
[wd_asp id=1]
On the upside, a bullish reversal would be indicated on a rally above today’s high of 3.91. Natural gas would then be heading up into a potential resistance zone defined by the prior six days of price history. The bull trend does not continue until there is a rally above the recent trend high of 4.37. In the meantime, natural gas needs to contend with a possible deeper pullback as trend support is being threatened.
The medium-term outlook for natural gas remains bullish given the breakout of a large symmetrical pattern in the second half of November. That breakout was accompanied by a bullish trend continuation signal and followed by a trend reversal signal on the advance above the lower swing high of 3.64 on December 20. These are all bullish signals for the medium-term.
In the short term, natural gas could still correct further as a normal component of a bullish trend continuation pattern of an advance followed by profit taking and a pullback. However, until the lower end of the support zone noted above at 3.64 is broken to the downside, the possibility of a continuation higher remains.
A continuation of the bearish correction on a decisive drop below 3.64 will put natural gas in a position to test support around a price zone from 3.52 to 3.51. That zone consists of the 127.2% extended target for a small falling ABCD pattern and the 61.8% Fibonacci retracement level, respectively. Moreover, last week’s high of 4.33 generated a lower swing low and possible second top of a double top pattern.
For a look at all of today’s economic events, check out our economic calendar.
The narrowing interest rate differentials between Japan and the rest of the world has been a key theme in the improving Japanese yen forecast in the last couple of weeks. The main USD/JPY pair dropped to fresh five-week lows on Tuesday, before bouncing back to trade in the green at the time of writing, while yen pairs such as the CAD/JPY, which have been falling even more sharply because of Trump’s plans to impose tariffs on Canada’s exports to the US, remained in the red. The yen has also shown relative strength against other commodity dollars as well. Pairs such as the AUD/JPY and NZD/JPY remained on the backfoot.
With a Bank of Japan (BoJ) rate hike this week almost fully priced in, could this recent USD/JPY dip offer a buy-the-dip opportunity, or will we see a more decisive bullish trend emerge for the yen?
As US-Japan yield spreads hit five-week lows, USD/JPY followed. However, with inflation risks heightened by potential large-scale tariffs, the recent yield compression may be nearing its limit, you would think. Thus, for the USD/JPY to drop more markedly, we will need to see a hawkish rate hike from the BoJ this week, or a significant deterioration in US data.
Rates markets are currently pricing in two full 25bp hikes by the end of 2025, with the first one arriving this week. Thus, if the BoJ opts for a smaller hike or no hike at all, that could trigger significant downside for the yen.
Yesterday, there was initial optimism surrounding trade policy before Trump’s inauguration speech. But later this was overshadowed by news that the Trump Administration is likely to implement 25% tariffs on imports from Canada and Mexico starting in February. So, tariffs are still on the horizon, though not as soon as Trump had made it out to be case.
We initially saw a big relief rally in the likes of the Canadian dollar, Mexican peso, and the euro yesterday as Trump, when addressing tariffs, did not specify a timeline. In fact, he referred to himself as a “peacemaker and a unifier,” which suggests he may avoid actions that could cause significant tensions with other nations through sweeping tariffs. However, this should not have been mistaken as a softening of his stance, because later, he said his government would impose 25% tariffs on imports from both sides of its borders.
Trump intends to overhaul the trade system in order to “tariff and tax foreign countries to enrich our citizens” through the creation of an “external revenue service.” His goals to reform international trade policies clearly prioritize American industries and aim to reduce trade deficits. By imposing tariffs on imports, revenue would be redirected toward domestic economic growth and infrastructure development.
We have already seen repeated multi-year highs in the USD/CAD pair in recent months, and the Loonie hit a new high of just above 1.4500 overnight following Trump’s February 1 tariff threat, and despite its sizeable drop the prior day. Now with the USD/JPY moving into consolidation mode, the ongoing weakness in the CAD means the CAD/JPY pair could be poised for a breakdown – Canadian CPI data permitting. CPI is expected to drop 0.7% m/m.

The CAD/JPY has tried to break below its bullish trend line, but so far, the bears haven’t been quite successful. However, as the yield spread between Japan and the rest of the world narrows, while risks of tariffs for Canada’s exports grow, we could see the CAD/JPY break lower and potentially head down to the next support levels situated at 106.00 and then 105.00.

With the US dollar still remaining largely supported against other currencies, the USD/JPY may not be the best yen cross for those who are bullish on the Japanese currency. Still, given the narrowing yield spreads, I do think the upside is fairly limited for the USD/JPY from here.
USD/JPY’s dip overnight was brought around the minor horizontal support at 155.00. However, if rates resume lower and we go below this level, then you have a short-term uptrend that was established from September, around 144.00, to keep an eye on, followed by the 200-day moving average around 152.80 area.
For traders who are bullish the USD/JPY, they will now want to see rates breaking key short-term resistance around 156.00-156.75 area. A decisive break here would signal bullish sentiment, potentially opening the door for follow-up technical buying towards 160.00. But this is not my base case scenario.
Source for all charts used in this article: TradingView.com
— Written by Fawad Razaqzada, Market Analyst
Follow Fawad on Twitter @Trader_F_R
Gold prices (XAU/USD) maintained their upward momentum unchanged on Tuesday, entering their four consecutive week with gains.
This time, the precious metal advanced north of the $2,740 mark per ounce troy backed by fresh threats by President Trump to impose 25% tariffs on Canadian and Mexican imports, starting as soon as February 1.
That said, the yellow metal extened its auspicious start to the week as US investors returned to their desks following the Martin Luther King Jr. holiday and Inauguration Day on Monday.
Contributing to the second consecutive daily advance, the US Dollar (USD) could not sustain the earlier bid bias, losing momentum afterwards and triggering the second consecutive daily pullback in the US Dollar Index (DXY), all after the initial impact of potential tariffs on Canada and Mexico in February ran out of steam.
Looking ahead, the spotlight is likely to stay on developments from the White House in a week with relatively few major economic data releases. Meanwhile, traders are also gearing up for the Federal Reserve’s January 28–29 meeting, where interest rates are expected to remain unchanged.
Gold remains firmly in focus as political events and central bank decisions loom, setting the stage for potential volatility in the days ahead.
Gold’s next big target on the upside is $2,745, its 2025 high reached on January 21. Beyond that, traders will be eyeing the all-time high of $2,790, recorded on October 31. Should these levels be breached, Fibonacci projections point to potential milestones at $3,009, $3,123, and $3,288.
On the downside, the first line of defense lies at December’s low of $2,582, followed by November’s low of $2,536. Further support sits at the 200-day moving average of $2,513, with deeper corrections potentially targeting $2,471 (the September low) and $2,353 (the weekly low from July).
If the selloff intensifies, the next significant levels to watch are $2,286, the June low, and $2,277, the May low. The ultimate downside marker for now is $1,984, the 2024 low from February 14, which would represent a significant retracement from current levels.
Gold daily chart
After spending the European session under bearish pressure, EUR/USD gains traction and recovers toward 1.0400 in the American trading hours.
The table below shows the percentage change of Euro (EUR) against listed major currencies this week. Euro was the strongest against the US Dollar.
| USD | EUR | GBP | JPY | CAD | AUD | NZD | CHF | |
|---|---|---|---|---|---|---|---|---|
| USD | -1.07% | -0.89% | -0.39% | -0.51% | -0.90% | -0.94% | -0.47% | |
| EUR | 1.07% | 0.12% | 0.60% | 0.46% | 0.24% | 0.02% | 0.48% | |
| GBP | 0.89% | -0.12% | 0.42% | 0.33% | 0.13% | -0.11% | 0.36% | |
| JPY | 0.39% | -0.60% | -0.42% | -0.11% | -0.46% | -0.65% | -0.25% | |
| CAD | 0.51% | -0.46% | -0.33% | 0.11% | -0.33% | -0.44% | 0.03% | |
| AUD | 0.90% | -0.24% | -0.13% | 0.46% | 0.33% | -0.31% | 0.17% | |
| NZD | 0.94% | -0.02% | 0.11% | 0.65% | 0.44% | 0.31% | 0.28% | |
| CHF | 0.47% | -0.48% | -0.36% | 0.25% | -0.03% | -0.17% | -0.28% |
The heat map shows percentage changes of major currencies against each other. The base currency is picked from the left column, while the quote currency is picked from the top row. For example, if you pick the Euro from the left column and move along the horizontal line to the US Dollar, the percentage change displayed in the box will represent EUR (base)/USD (quote).
In the early Asian session on Tuesday, US President Donald Trump said that they could impose tariffs on China if they make a TikTok deal and China doesn’t approve it. Additionally, he said that they are planning to impose 25% tariff on imports from Mexico and Canada as early as February 1. These remarks caused markets to adopt a cautious stance and allowed the US Dollar to benefit from safe-haven flows.
The bullish opening in Wall Street, however, made it difficult for the USD to gather further strength and opened the door for a recovery in EUR/USD. At the time of press, major equity indexes in the US were up between 0.3% and 0.5%.
In case risk rally picks up steam in the remainder of the session, EUR/USD could extend its recovery. On the flip side, a bearish reversal in stock markets could cap EUR/USD’s upside.
Meanwhile, the data on Tuesday showed the headline German ZEW Economic Sentiment Index declined to 10.3 in January from 15.7 in December, missing the market consensus of 15.3. On a positive note, the Eurozone ZEW Economic Sentiment Index improved to 18 from 17 in December.
On Wednesday, European Central Bank President Christine Lagarde will participate in the dialogue ‘Beyond Crisis: Unlocking Europe’s Potential’ during the World Economic Forum in Davos, Switzerland.
The Relative Strength Index (RSI) indicator on the 4-hour chart holds above 60, suggesting that the bullish bias remains intact.
The pair could face immediate resistance at 1.0390-1.0400, where the 200-period Simple Moving Average (SMA) meets the Fibonacci 50% retracement of the latest downtrend. If EUR/USD manages to flip this area into support, 1.0440 (Fibonacci 61.8% retracement) could be seen as next resistance before 1.0500 (round level, Fibonacci 78.6% retracement).
On the downside, 1.0350 (Fibonacci 38.2% retracement) aligns as first support ahead of 1.0320 (100-period SMA) and 1.0290 (Fibonacci 23.6% retracement).
The Euro is the currency for the 19 European Union countries that belong to the Eurozone. It is the second most heavily traded currency in the world behind the US Dollar. In 2022, it accounted for 31% of all foreign exchange transactions, with an average daily turnover of over $2.2 trillion a day. EUR/USD is the most heavily traded currency pair in the world, accounting for an estimated 30% off all transactions, followed by EUR/JPY (4%), EUR/GBP (3%) and EUR/AUD (2%).
The European Central Bank (ECB) in Frankfurt, Germany, is the reserve bank for the Eurozone. The ECB sets interest rates and manages monetary policy. The ECB’s primary mandate is to maintain price stability, which means either controlling inflation or stimulating growth. Its primary tool is the raising or lowering of interest rates. Relatively high interest rates – or the expectation of higher rates – will usually benefit the Euro and vice versa. The ECB Governing Council makes monetary policy decisions at meetings held eight times a year. Decisions are made by heads of the Eurozone national banks and six permanent members, including the President of the ECB, Christine Lagarde.
Eurozone inflation data, measured by the Harmonized Index of Consumer Prices (HICP), is an important econometric for the Euro. If inflation rises more than expected, especially if above the ECB’s 2% target, it obliges the ECB to raise interest rates to bring it back under control. Relatively high interest rates compared to its counterparts will usually benefit the Euro, as it makes the region more attractive as a place for global investors to park their money.
Data releases gauge the health of the economy and can impact on the Euro. Indicators such as GDP, Manufacturing and Services PMIs, employment, and consumer sentiment surveys can all influence the direction of the single currency. A strong economy is good for the Euro. Not only does it attract more foreign investment but it may encourage the ECB to put up interest rates, which will directly strengthen the Euro. Otherwise, if economic data is weak, the Euro is likely to fall. Economic data for the four largest economies in the euro area (Germany, France, Italy and Spain) are especially significant, as they account for 75% of the Eurozone’s economy.
Another significant data release for the Euro is the Trade Balance. This indicator measures the difference between what a country earns from its exports and what it spends on imports over a given period. If a country produces highly sought after exports then its currency will gain in value purely from the extra demand created from foreign buyers seeking to purchase these goods. Therefore, a positive net Trade Balance strengthens a currency and vice versa for a negative balance.
Futures have breached two pivotal 50% support levels at $3.850 and $4.043, positioning the market for further declines. A potential test of the January 3 low at $3.330 looms as the next downside target. A recovery above $3.850 would signal the first signs of strength, with a move through $4.053 reinforcing a bullish shift. However, a break below $3.736 would further confirm downside momentum. These technical markers are essential for traders looking to time entry and exit points effectively.
Although an Arctic blast has gripped the central and eastern U.S., driving temperatures as low as northern Florida, traders have largely dismissed the event’s immediate impact. Unlike other markets, natural gas professionals often sell rallies, guided by short-term forecasts. The futures market’s two-week window has rendered the current cold snap irrelevant, as milder weather predictions for late January have already been factored into pricing. Last week’s rally to $4.369 was met with selling pressure, reflecting this forward-looking strategy.
Recent data from the Energy Information Administration (EIA) underscores robust heating demand, with a storage withdrawal of 258 Bcf, nearly double the five-year average. While this signals short-term strength in demand, domestic storage levels remain 77 Bcf above the seasonal average, mitigating supply concerns. Liquefied natural gas (LNG) exports continue to provide a bullish backdrop, supported by European demand amid depleted inventories. However, signs of softening LNG flow and declining power generation demand temper the market’s upside potential.
Last week’s close at $3.948, following a high of $4.369, marked a bearish reversal pattern, often preceding extended declines. Traders should heed this signal, as it indicates waning buying interest and reinforces the bearish impact of technical and fundamental factors aligning. Profit-taking and milder weather forecasts have compounded the market’s retreat, underlining its sensitivity to rapid sentiment shifts.
Natural gas futures are likely to face additional downward pressure, with support at $3.330 as the next critical level. However, volatility remains a risk, as unexpected weather developments or surging LNG demand could reignite buying interest. For now, the market leans bearish, emphasizing the importance of close monitoring of weather updates and storage data to navigate the near term effectively.
More Information in our Economic Calendar.
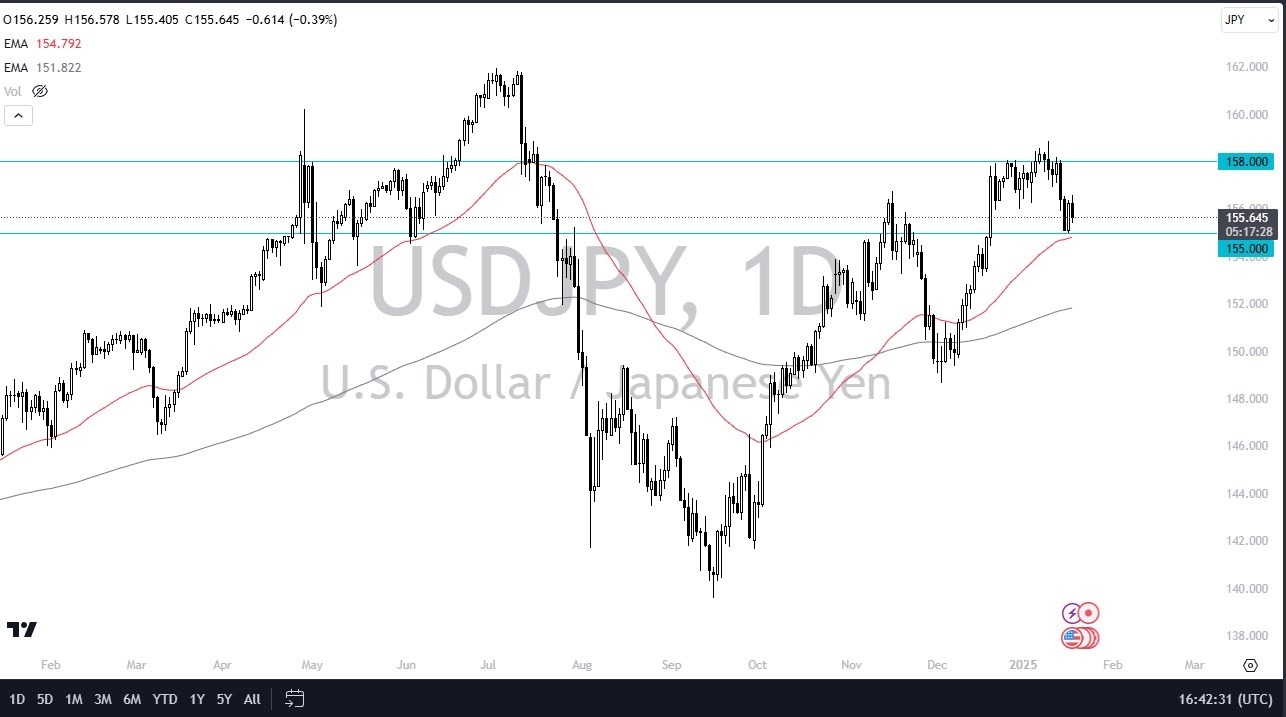
The technical analysis for this pair is rather bullish, and it’s worth noting that the 50 Day EMA sits just below the ¥155 level and is rising. We have tested this over the course of the last couple of trading sessions, and it looks like it is trying to hold. In fact, it’s probably worth noting that we are bouncing a bit from the lows of the session, so I think you will continue to see a lot of people watching this pair for the idea of a continued interest rate differential that is favoring the greenback.
The ¥155 level has been important multiple times, and it now offers a significant amount of support. The ¥158 level above is a significant support, and I think we will bounce around between now and the announcement from the Bank of Japan on Friday about the interest rate situation there. All things being equal, I think this is a market that will continue to favor the carry trade overall, but the Japanese may shake things up on Friday with their press conference or the rate decision. Nonetheless, regardless of what they do, the interest rate differential between the two currencies will continue to favor the US dollar over the longer term. Because of this, I am more than willing to buy dips.
Going forward, I think this is a market that will eventually break out to the upside, unless of course something drastic happens in Japan. If we were to break down below the ¥155 level, then it’s possible that we could drop down to the ¥153.50 level, a minor support level in the past.

Want to trade our USD/JPY forex analysis and predictions? Here’s a list of forex brokers in Japan to check out.
Silver price (XAG/USD) drops slightly to near $30.50 in Tuesday’s European session. The white metal faces pressures as the US Dollar (USD) rebounds strongly after President Donald Trump confirmed that the plan of tariff hikes on foreign countries is delayed not denied. On his first day at the White House, Trump mentioned that the proposal of universal tariff hikes is on the table, but “We are not ready for that yet”.
The US Dollar Index (DXY), which tracks the Greenback’s value against six major currencies, rebounds sharply from its almost two-week low around 108.00, which it posted on Monday. Historically, a higher US Dollar weighs on precious metals, such as Silver, by making them expensive for investors.
The Greenback plummeted on Tuesday after reports from the Wall Street Journal (WSJ) showed that tariff hikes were absent in a presidential memo. However, the memo indicated that Trump has directed federal agencies to study trade policies and evaluate trade relationships with China and other North American economies.
Meanwhile, the downside in the Silver price has been limited by falling bond yields. Lower yields on interest-bearing assets reduce the opportunity cost of non-yielding assets, such as Silver, which improves their appeal. 10-year US Treasury yields decline to 4.56%. US Treasury yields have slumped as trader expect that the Federal Reserve (Fed) could cut interest rates in the policy meeting in May.
According to the CME FedWatch tool, the probability for the Fed to reduce interest rates in May has eased to 53% from 63% a week ago.
Silver price struggles near the upward-sloping trendline around $30.80, which is plotted from 29 February 2024 low of $22.30 on a daily timeframe.
The white metal discovered strong buying interest near the 200-day Exponential Moving Average (EMA) around $29.45 and but struggles to sustain above the 50-day EMA, which is around $30.30.
The 14-day Relative Strength Index (RSI) faces pressure near 60.00. A fresh bullish momentum would trigger if it manages to break above 60.00.
Silver is a precious metal highly traded among investors. It has been historically used as a store of value and a medium of exchange. Although less popular than Gold, traders may turn to Silver to diversify their investment portfolio, for its intrinsic value or as a potential hedge during high-inflation periods. Investors can buy physical Silver, in coins or in bars, or trade it through vehicles such as Exchange Traded Funds, which track its price on international markets.
Silver prices can move due to a wide range of factors. Geopolitical instability or fears of a deep recession can make Silver price escalate due to its safe-haven status, although to a lesser extent than Gold’s. As a yieldless asset, Silver tends to rise with lower interest rates. Its moves also depend on how the US Dollar (USD) behaves as the asset is priced in dollars (XAG/USD). A strong Dollar tends to keep the price of Silver at bay, whereas a weaker Dollar is likely to propel prices up. Other factors such as investment demand, mining supply – Silver is much more abundant than Gold – and recycling rates can also affect prices.
Silver is widely used in industry, particularly in sectors such as electronics or solar energy, as it has one of the highest electric conductivity of all metals – more than Copper and Gold. A surge in demand can increase prices, while a decline tends to lower them. Dynamics in the US, Chinese and Indian economies can also contribute to price swings: for the US and particularly China, their big industrial sectors use Silver in various processes; in India, consumers’ demand for the precious metal for jewellery also plays a key role in setting prices.
Silver prices tend to follow Gold’s moves. When Gold prices rise, Silver typically follows suit, as their status as safe-haven assets is similar. The Gold/Silver ratio, which shows the number of ounces of Silver needed to equal the value of one ounce of Gold, may help to determine the relative valuation between both metals. Some investors may consider a high ratio as an indicator that Silver is undervalued, or Gold is overvalued. On the contrary, a low ratio might suggest that Gold is undervalued relative to Silver.
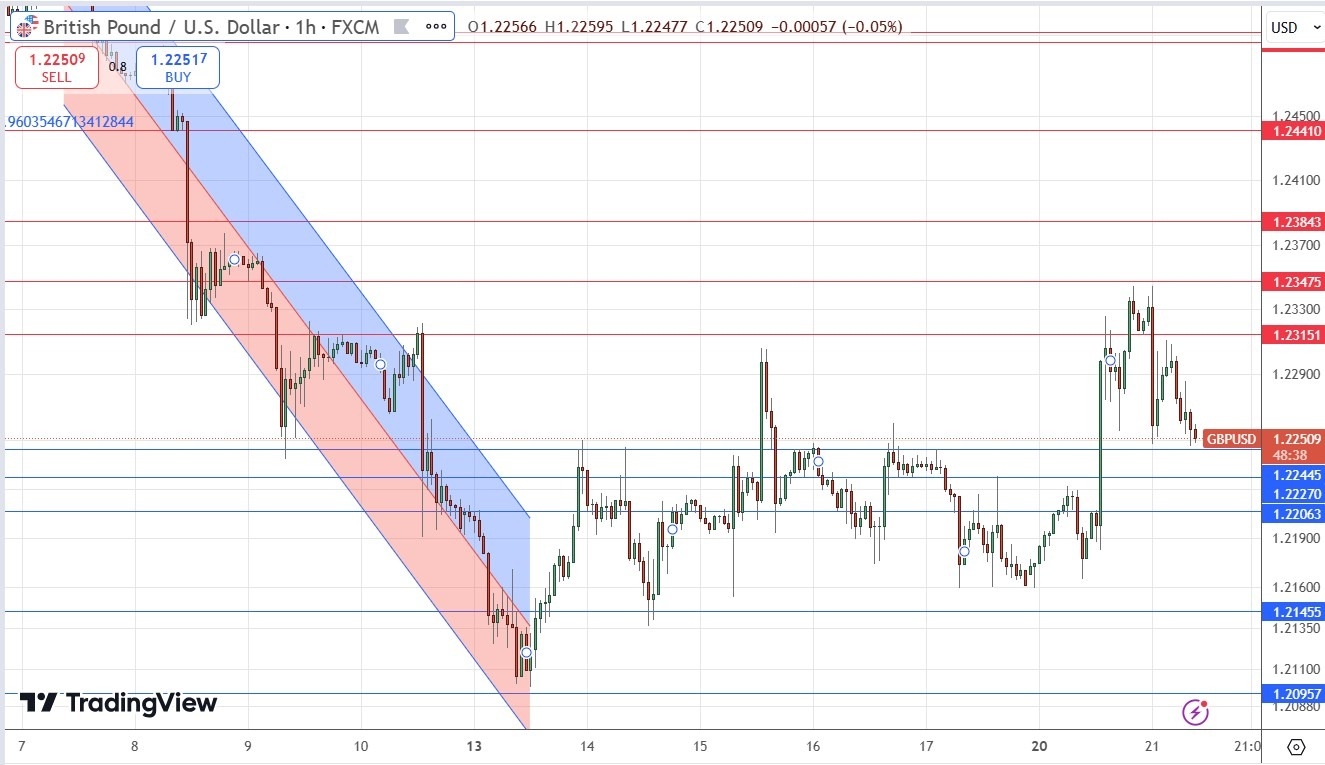
My previous GBP/USD signal last Tuesday produced a profitable short trade from the bearish reversal at the resistance level at $1.2245.
The best method to identify a classic “price action reversal” is for an hourly candle to close, such as a pin bar, a doji, an outside or even just an engulfing candle with a higher close. You can exploit these levels or zones by watching the price action that occurs at the given levels.
I wrote in my previous GBP/USD forecast last week that the price was facing a very pivotal resistance zone centred on $1.2250. This was a good call, as this level held, and the resistance level just 5 pips below it held to the pip, producing a profitable short trade.
The technical picture has become more bullish one week later now, with the price consolidating and occasionally rising as it flattens out and leaves the area of the descending price channel represented by the linear regression analysis which is shown within the price chart below.
The US Dollar is in a long-term bullish trend, but this appears to have paused even though President Trump has now taken office and is mulling tariffs on some of the USA’s trading partners which would typically boost the greenback. The British Pound has also been weak lately on poor economic data from the UK and the new British government’s struggle for credibility with the markets over its economic projections. However, these issues appear to be taking a back seat.
Technically, we see a cluster of three support levels close to the current price, and this supportive area is likely to hold today and might drive the price higher. Nevertheless, a long trade here is certainly counter trend, so should be taken with caution and with conservative profit-taking.
I am prepared to take a long trade today from any bounce at any one of the three identified support levels.
Ready to trade our free Forex signals? Here is our Forex brokers list for your review.
Walgreens Boots Alliance’s stock price (WBA) fell in the intraday levels on profit-taking, while venting off overbought saturation in the RSI, amid the dominance of the upward correctional wave in the short term, with positive pressure due to trading above the 50-day SMA.
Therefore we expect the price to return higher and target the resistance of $15.54, provided it settles firmly above the support of $11.11.
Trend forecast for today: Likely Bullish
The narrowing interest rate differentials between Japan and the rest of the world has been a key theme in the improving Japanese yen forecast in the last couple of weeks. The main USD/JPY pair dropped to fresh five-week lows on Tuesday, before bouncing back to trade in the green at the time of writing, while yen pairs such as the CAD/JPY, which have been falling even more sharply because of Trump’s plans to impose tariffs on Canada’s exports to the US, remained in the red. The yen has also shown relative strength against other commodity dollars as well. Pairs such as the AUD/JPY and NZD/JPY remained on the backfoot.
With a Bank of Japan (BoJ) rate hike this week almost fully priced in, could this recent USD/JPY dip offer a buy-the-dip opportunity, or will we see a more decisive bullish trend emerge for the yen?
As US-Japan yield spreads hit five-week lows, USD/JPY followed. However, with inflation risks heightened by potential large-scale tariffs, the recent yield compression may be nearing its limit, you would think. Thus, for the USD/JPY to drop more markedly, we will need to see a hawkish rate hike from the BoJ this week, or a significant deterioration in US data.
Rates markets are currently pricing in two full 25bp hikes by the end of 2025, with the first one arriving this week. Thus, if the BoJ opts for a smaller hike or no hike at all, that could trigger significant downside for the yen.
Yesterday, there was initial optimism surrounding trade policy before Trump’s inauguration speech. But later this was overshadowed by news that the Trump Administration is likely to implement 25% tariffs on imports from Canada and Mexico starting in February. So, tariffs are still on the horizon, though not as soon as Trump had made it out to be case.
We initially saw a big relief rally in the likes of the Canadian dollar, Mexican peso, and the euro yesterday as Trump, when addressing tariffs, did not specify a timeline. In fact, he referred to himself as a “peacemaker and a unifier,” which suggests he may avoid actions that could cause significant tensions with other nations through sweeping tariffs. However, this should not have been mistaken as a softening of his stance, because later, he said his government would impose 25% tariffs on imports from both sides of its borders.
Trump intends to overhaul the trade system in order to “tariff and tax foreign countries to enrich our citizens” through the creation of an “external revenue service.” His goals to reform international trade policies clearly prioritize American industries and aim to reduce trade deficits. By imposing tariffs on imports, revenue would be redirected toward domestic economic growth and infrastructure development.
We have already seen repeated multi-year highs in the USD/CAD pair in recent months, and the Loonie hit a new high of just above 1.4500 overnight following Trump’s February 1 tariff threat, and despite its sizeable drop the prior day. Now with the USD/JPY moving into consolidation mode, the ongoing weakness in the CAD means the CAD/JPY pair could be poised for a breakdown.

The CAD/JPY has tried to break below its bullish trend line, but so far, the bears haven’t been quite successful. However, as the yield spread between Japan and the rest of the world narrows, while risks of tariffs for Canada’s exports grow, we could see the CAD/JPY break lower and potentially head down to the next support levels situated at 106.00 and then 105.00.

With the US dollar still remaining largely supported against other currencies, the USD/JPY may not be the best yen cross for those who are bullish on the Japanese currency. Still, given the narrowing yield spreads, I do think the upside is fairly limited for the USD/JPY from here.
USD/JPY’s dip overnight was brought around the minor horizontal support at 155.00. However, if rates resume lower and we go below this level, then you have a short-term uptrend that was established from September, around 144.00, to keep an eye on, followed by the 200-day moving average around 152.80 area.
For traders who are bullish the USD/JPY, they will now want to see rates breaking key short-term resistance around 156.00-156.75 area. A decisive break here would signal bullish sentiment, potentially opening the door for follow-up technical buying towards 160.00. But this is not my base case scenario.
Source for all charts used in this article: TradingView.com
— Written by Fawad Razaqzada, Market Analyst
Follow Fawad on Twitter @Trader_F_R