The main category of Forex News.
You can use the search box below to find what you need.
[wd_asp id=1]
The main category of Forex News.
You can use the search box below to find what you need.
[wd_asp id=1]
The AUDCAD price faced some positive pressures recently, to postpone the negative trades by forming temporary correctional bullish rebound and face 0.9030 barrier, noting that the frequent stability below 0.9085 resistance line and the MA55 crawl below it confirm the continuation of the negativity for the near-term and medium-term trades.
Also, stochastic reach to the overbought areas confirms getting rid of the positive pressures and provides the chance to gather the negative momentum again to ease the mission of renewing the negative attempts and target many negative stations that start at 0.8930 followed by reaching the next main target at 0.8800.
The expected trading range for today is between 0.8930 and 0.9045
Trend forecast: Bearish
The AUDCAD price faced some positive pressures recently, to postpone the negative trades by forming temporary correctional bullish rebound and face 0.9030 barrier, noting that the frequent stability below 0.9085 resistance line and the MA55 crawl below it confirm the continuation of the negativity for the near-term and medium-term trades.
Also, stochastic reach to the overbought areas confirms getting rid of the positive pressures and provides the chance to gather the negative momentum again to ease the mission of renewing the negative attempts and target many negative stations that start at 0.8930 followed by reaching the next main target at 0.8800.
The expected trading range for today is between 0.8930 and 0.9045
Trend forecast: Bearish
Platinum price started to get the positive momentum after stochastic exit from the oversold areas, forming some bullish waves to approach 955.00$ obstacle, assuring the importance of surpassing this obstacle to open the way to record many gains by rallying towards 983.00$ level first, followed by reaching 1005.00$ on the near-term basis.
The risks of changing the bullish trend will appear in case the price formed sharp decline to settle below 920.00$ level, to return to fluctuate within the minor bearish channel that appears on the chart.
The expected trading range for today is between 930.00$ and 965.00$
Trend forecast: Bullish
Platinum price started to get the positive momentum after stochastic exit from the oversold areas, forming some bullish waves to approach 955.00$ obstacle, assuring the importance of surpassing this obstacle to open the way to record many gains by rallying towards 983.00$ level first, followed by reaching 1005.00$ on the near-term basis.
The risks of changing the bullish trend will appear in case the price formed sharp decline to settle below 920.00$ level, to return to fluctuate within the minor bearish channel that appears on the chart.
The expected trading range for today is between 930.00$ and 965.00$
Trend forecast: Bullish
Silver (XAG/USD) attracts some dip-buying near the $30.20 area during the Asian session on Tuesday and looks to build on the overnight bounce from the vicinity of the 100-period Exponential Moving Average (EMA) on the 4-hour chart. The white metal, however, eases from a two-day high touched in the last hour and currently trades around the $30.60-$30.55 region, up 0.25% for the day.
Looking at the broader picture, the recent move up witnessed over the past four weeks or so, from the $28.75-$28.70 region or a multi-month low touched in December, has been along an upward-sloping channel. This, along with the fact that oscillators on the daily chart have just started gaining positive traction, favors the XAG/USD bulls and supports prospects for a further near-term appreciating move towards the $31.00 mark.
A subsequent move up is likely to confront resistance near the top boundary of the aforementioned channel, currently pegged near the $31.25 region. A sustained breakout above the said barrier has the potential to lift the XAG/USD towards the $32.00 mark, with some intermediate hurdle near the $31.45-$31.50 region. The momentum could extend further towards the December swing high, around the $32.25-$32.30 area.
On the flip side, the $30.00 psychological mark – comprising the 100-period EMA on the 4-hour chart and the lower end of the ascending channel – might continue to act as immediate support. A convincing break below might shift the bias in favor of bearish traders and make the XAG/USD vulnerable to accelerate the fall towards the $29.50 region en route to the $29.00 mark and the $28.75-$28.70 region, or the multi-month low.
Silver is a precious metal highly traded among investors. It has been historically used as a store of value and a medium of exchange. Although less popular than Gold, traders may turn to Silver to diversify their investment portfolio, for its intrinsic value or as a potential hedge during high-inflation periods. Investors can buy physical Silver, in coins or in bars, or trade it through vehicles such as Exchange Traded Funds, which track its price on international markets.
Silver prices can move due to a wide range of factors. Geopolitical instability or fears of a deep recession can make Silver price escalate due to its safe-haven status, although to a lesser extent than Gold’s. As a yieldless asset, Silver tends to rise with lower interest rates. Its moves also depend on how the US Dollar (USD) behaves as the asset is priced in dollars (XAG/USD). A strong Dollar tends to keep the price of Silver at bay, whereas a weaker Dollar is likely to propel prices up. Other factors such as investment demand, mining supply – Silver is much more abundant than Gold – and recycling rates can also affect prices.
Silver is widely used in industry, particularly in sectors such as electronics or solar energy, as it has one of the highest electric conductivity of all metals – more than Copper and Gold. A surge in demand can increase prices, while a decline tends to lower them. Dynamics in the US, Chinese and Indian economies can also contribute to price swings: for the US and particularly China, their big industrial sectors use Silver in various processes; in India, consumers’ demand for the precious metal for jewellery also plays a key role in setting prices.
Silver prices tend to follow Gold’s moves. When Gold prices rise, Silver typically follows suit, as their status as safe-haven assets is similar. The Gold/Silver ratio, which shows the number of ounces of Silver needed to equal the value of one ounce of Gold, may help to determine the relative valuation between both metals. Some investors may consider a high ratio as an indicator that Silver is undervalued, or Gold is overvalued. On the contrary, a low ratio might suggest that Gold is undervalued relative to Silver.
Platinum price started to get the positive momentum after stochastic exit from the oversold areas, forming some bullish waves to approach 955.00$ obstacle, assuring the importance of surpassing this obstacle to open the way to record many gains by rallying towards 983.00$ level first, followed by reaching 1005.00$ on the near-term basis.
The risks of changing the bullish trend will appear in case the price formed sharp decline to settle below 920.00$ level, to return to fluctuate within the minor bearish channel that appears on the chart.
The expected trading range for today is between 930.00$ and 965.00$
Trend forecast: Bullish
Brent oil price shows positive trades by today’s open, affected by stochastic positivity, noticing that the price closed yesterday below 80.10$ level, to support the chances of continuing the decline on the intraday basis, as it starts bearish correction for the rise measured from 71.23$ to 82.82$, waiting to head towards 78.39$ as a next correctional target.
Holding below 80.85$ keeps the negative scenario valid, as breaching it represents the key to return to the bullish track and head to achieve gains that start by visiting the recently recorded high at 82.82$.
The expected trading range for today is between 78.60$ support and 81.60$ resistance.
Trend forecast: Bearish
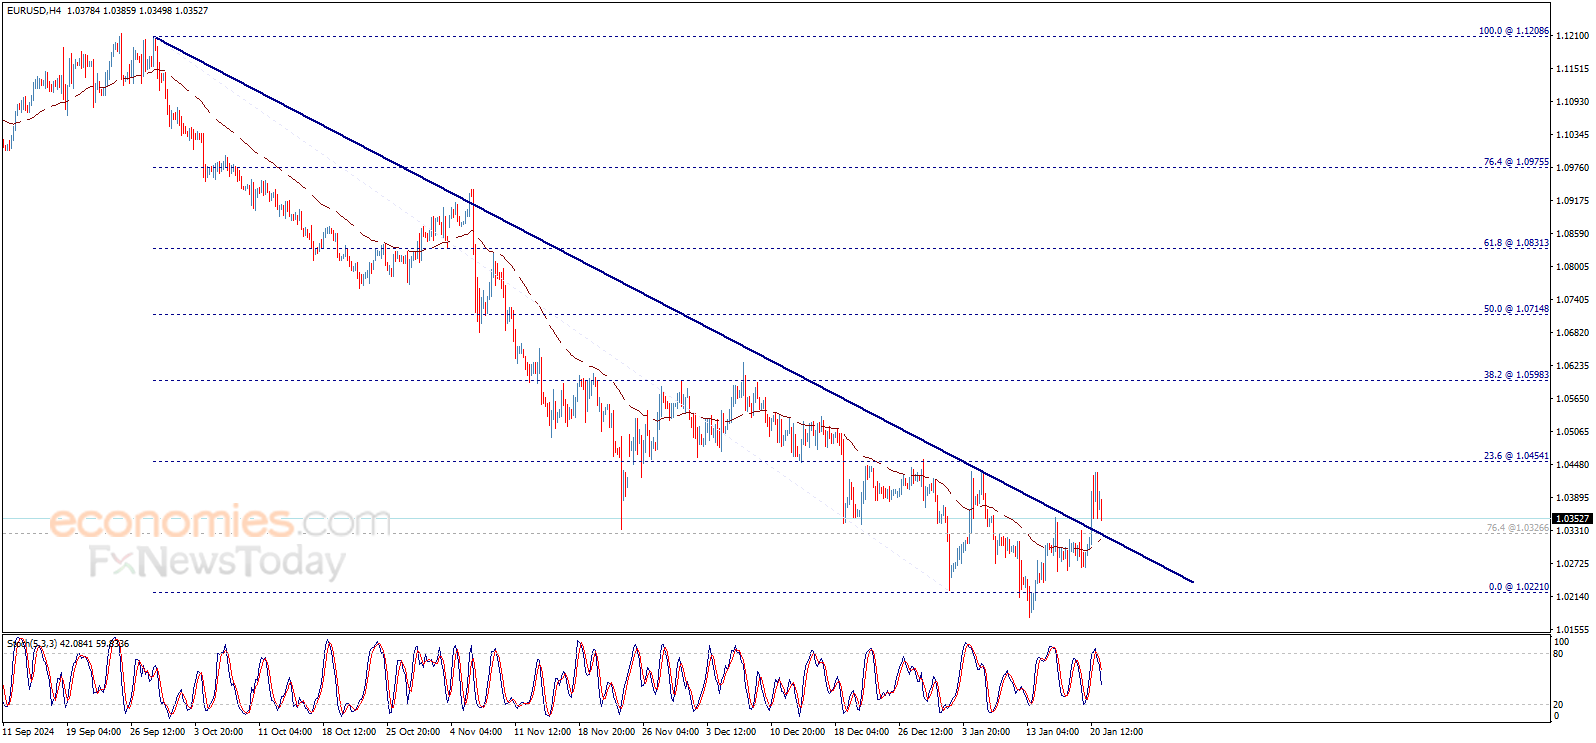
The EURUSD price continued to rise yesterday to approach 1.0455$ level, waiting for more rise as a bullish correction for the decline measured from 1.1208$ to 1.0221$, noting that breaching 1.0455$ will push the price towards 1.0600$ as a next correctional target.
Therefore, the bullish trend will be suggested for today, taking into consideration that breaking 1.0325$ will stop the bullish wave and push the price to return to the main bearish track again.
The expected trading range for today is between 1.0320$ support and 1.0480$ resistance
Trend forecast: Bullish
Gold price builds on its rebound to retest monthly highs of $2,725 early Tuesday. Gold buyers are back in action alongside US President Donald Trump’s tariff threats, fuelling risk-off sentiment across the financial markets.
Gold price risks volatile trading
Trump said: “We’re thinking in terms of 25% on Mexico and Canada,” effective February 1. He added that his administration “will straighten out the deficit with EU with tariffs or by them buying our oil and gas,” threatening tariffs on the old continent anytime soon.
Trump also noted that he is prepared to impose tariffs on China if Beijing doesnt approve the TikTok deal. Investors scurried for safety in the traditional safe-haven Gold price, propping up the rates close to monthly highs of $2,725.
The flight to safety theme remains supportive of Gold price and US government bonds, which weigh negatively on the US Treasury bond yields. Trump tariff threats could revive inflation concerns worldwide, providing extra support to Gold price. The bullion is considered a hedge against inflation.
However, further upside appears elusive for Gold buyers as the US Dollar (USD) has also gains on safe-haven demand, capping the USD-denominated bright metal. Additionally, expectations that the US Federal Reserve (Fed) would deliver two interest rate cuts this year after the tame December inflation data, act as a tailwind to Gold price but that could change if inflation concerns sag investors’ sentiment.
On Monday, Gold price witnessed good two-way businesses, initially extending Friday’s correction on easing Middle East tensions and profit-taking heading into Trump’s inauguration. However, during Trump’s inaugural address, the USD dipped to a nine-day low, helping Gold price stage a decent rebound above $2,700.
A 15-month-long relentless war between Israel and Hamas culminated in a ceasefire on Sunday as hundreds of trucks carrying aid entered Gaza on the first day.
In the day ahead, Gold trades will remain at the mercy of the broader market sentiment and Trump’s tariff talks, in the absence of any top-tier US economic data releases.
Gold price technical analysis: Daily chart
The short-term technical outlook remains constructive for Gold price.
This month’s symmetrical triangle breakout remains in play, while the yellow metal holds well above all the major daily simple moving averages (SMA), supporting the bullish case.
The 14-day Relative Strength Index (RSI) points north above the midline, currently near 63, adding credence to the bullish potential.
Gold price eyes acceptance above the key static resistance at $2,726 to extend the uptrend toward the $2,750 psychological barrier. The next target is aligned at the record high of $2,790.
On the downside, Gold price could test the $2,700 round level, below which the January 15 low of $2,670 will be threatened.
The 21-day SMA at $2,658 could next be on the sellers’ radars.
The uptrend in natural gas remains intact with a rising trendline providing guidance for dynamic support below the 20-Day line. It is currently near a possible support zone from 3.67 to 3.64 or so. Notice how the trendline rises through that price zone is looking directly below today’s price action on the chart. A decisive drop below 3.64 could lead to still lower prices.
That would trigger a breakdown below the trendline and a daily close below the line would be needed to confirm the bearish implications. If this occurs, then there are two lower price levels that identify potential support. The first is the completion of a 61.8% Fibonacci retracement at 3.51.
Nonetheless, it looks like there is a potentially more significant price level around the prior swing high of 3.39 as two indicators point to that price area. Notice that the 50-Day MA has just recaptured the 3.39 price level to arrive at 3.40. If the price area around the 50-Day line fails to provide support that leads to a bullish reversal, lower levels may be tested. Certainly, a full retracement back to the breakout area of a large symmetrical triangle at 3.02 looks possible if the bears take back control.
A decisive breakout above today’s high will signal strength after buyers took back control following the low of 3.76. Regardless, a continuation of that strength might be difficult given recent signs of a short-term top. Last week a new trend high of 4.37 was met with a reversal day and a weak close. A second high was then generated last Thursday at 4.33. That sets up a potential falling ABCD pattern (not shown) with an initial target at 3.70. Notice that is very close to the 50% retracement.
For a look at all of today’s economic events, check out our economic calendar.