The main category of Forex News.
You can use the search box below to find what you need.
[wd_asp id=1]
The main category of Forex News.
You can use the search box below to find what you need.
[wd_asp id=1]
The US Dollar was down more than 1.7% against the Japanese Yen at the lows off the week with USD/JPY threatening a break of a multi-week range. The immediate focus is on this pullback with multi-month uptrend support in view ahead of the extended holiday break. Battle lines drawn on the USD/JPY short-term technical charts heading into the Presidential Inauguration and the BoJ next week.
Review my latest Weekly Strategy Webinar for an in-depth breakdown of this Yen setup and more. Join live on Monday’s at 8:30am EST.
Chart Prepared by Michael Boutros, Sr. Technical Strategist; USD/JPY on TradingView
Technical Outlook: In last month’s Japanese Yen Technical Forecast we noted that a rebound off technical support in USD/JPY was, “testing the first major resistance hurdle- looking for possible inflection here. From a trading standpoint, the focus is on a breakout of the weekly opening range (149.60-151.99) for guidance with the near-term recovery vulnerable while below the 200-day moving average.”
USD/JPY broke through resistance the following day with the rally extending nearly 6.9% off the December lows into key resistance at 157.89-158.45. A break of the January opening-range yesterday has already fallen more than 2.4% off the monthly high and the immediate focus is on this pullback towards uptrend support.

Chart Prepared by Michael Boutros, Sr. Technical Strategist; USD/JPY on TradingView
A closer look at Japanese Yen price action shows USD/JPY trading within the confines of a proposed descending pitchfork extending off the monthly high with price bounding off the median-line into the close of the week. Initial resistance is being tested now at the November high-close around 156.26 with near-term bearish invalidation set to the objective monthly / yearly open at 157.19. Ultimately, a breach /close above 158.45 is needed to mark uptrend resumption / fuel the next major leg of the advance towards the April high at 160.21.
Initial support rests with the November high-day close (HDC) / 23.6% retracement of the September advance at 154.32/34 and is backed by the lower parallel / 200-day moving average around 152.80s- both levels of interest for possible downside exhaustion / price inflection IF reached. Ultimately, a break / close below the 38.2% retracement / 2022 & 2023 highs at 151.50/95 would be needed to suggest a more significant high was registered last week / a lager trend reversal is underway.

Bottom line: A break of the January opening-range threatens a deeper pullback within the multi-month advance. From a trading standpoint, losses should be limited to the 200-day moving average IF price is heading higher on this stretch with a breach / close above 158.45 needed to fuel the next major leg of the advance.
Keep in mind we are heading into an extended holiday weekend with the inauguration of President Trump and the Bank of Japan (BoJ) interest rate decision on tap next week. Stay nimble here and watch the weekly closes for guidance. Review my latest Japanese Yen Weekly Forecast for a closer look at the longer-term USD/JPY technical trade levels.

Economic Calendar – latest economic developments and upcoming event risk.
— Written by Michael Boutros, Sr Technical Strategist
Follow Michael on X @MBForex
The US Dollar was down more than 1.7% against the Japanese Yen at the lows off the week with USD/JPY threatening a break of a multi-week range. The immediate focus is on this pullback with multi-month uptrend support in view ahead of the extended holiday break. Battle lines drawn on the USD/JPY short-term technical charts heading into the Presidential Inauguration and the BoJ next week.
Review my latest Weekly Strategy Webinar for an in-depth breakdown of this Yen setup and more. Join live on Monday’s at 8:30am EST.
Chart Prepared by Michael Boutros, Sr. Technical Strategist; USD/JPY on TradingView
Technical Outlook: In last month’s Japanese Yen Technical Forecast we noted that a rebound off technical support in USD/JPY was, “testing the first major resistance hurdle- looking for possible inflection here. From a trading standpoint, the focus is on a breakout of the weekly opening range (149.60-151.99) for guidance with the near-term recovery vulnerable while below the 200-day moving average.”
USD/JPY broke through resistance the following day with the rally extending nearly 6.9% off the December lows into key resistance at 157.89-158.45. A break of the January opening-range yesterday has already fallen more than 2.4% off the monthly high and the immediate focus is on this pullback towards uptrend support.

Chart Prepared by Michael Boutros, Sr. Technical Strategist; USD/JPY on TradingView
A closer look at Japanese Yen price action shows USD/JPY trading within the confines of a proposed descending pitchfork extending off the monthly high with price bounding off the median-line into the close of the week. Initial resistance is being tested now at the November high-close around 156.26 with near-term bearish invalidation set to the objective monthly / yearly open at 157.19. Ultimately, a breach /close above 158.45 is needed to mark uptrend resumption / fuel the next major leg of the advance towards the April high at 160.21.
Initial support rests with the November high-day close (HDC) / 23.6% retracement of the September advance at 154.32/34 and is backed by the lower parallel / 200-day moving average around 152.80s- both levels of interest for possible downside exhaustion / price inflection IF reached. Ultimately, a break / close below the 38.2% retracement / 2022 & 2023 highs at 151.50/95 would be needed to suggest a more significant high was registered last week / a lager trend reversal is underway.

Bottom line: A break of the January opening-range threatens a deeper pullback within the multi-month advance. From a trading standpoint, losses should be limited to the 200-day moving average IF price is heading higher on this stretch with a breach / close above 158.45 needed to fuel the next major leg of the advance.
Keep in mind we are heading into an extended holiday weekend with the inauguration of President Trump and the Bank of Japan (BoJ) interest rate decision on tap next week. Stay nimble here and watch the weekly closes for guidance. Review my latest Japanese Yen Weekly Forecast for a closer look at the longer-term USD/JPY technical trade levels.

Economic Calendar – latest economic developments and upcoming event risk.
— Written by Michael Boutros, Sr Technical Strategist
Follow Michael on X @MBForex
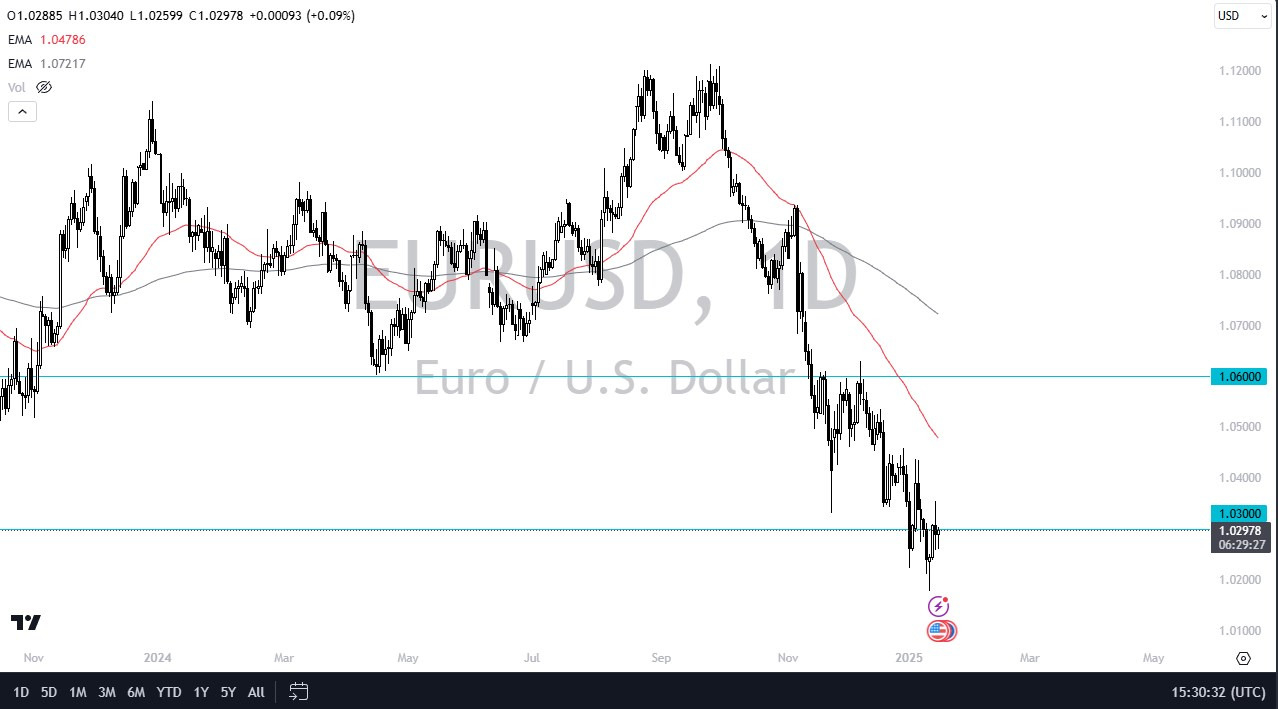
The technical analysis for the EUR/USD pair is obviously very negative, but it is also worth noting that we had ventured a little far from the 50 Day EMA, which sits right around the 1.05 level. Any rally toward that area would have be very interested in shorting this pair at the first signs of exhaustion. That’s been the case for a while, you just simply wait for the euro to get a little bit of a rally, and then you start fading. I think this will probably remain the case for some time, but it is worth noting that a little bit of patience probably goes a long way here.

To the downside, the 1.02 level is an area that I think will offer significant support, and therefore you need to pay close attention to it. If we were to break down below there, then I think the bottom falls out in the euro, and that would be the sign that we are in fact getting ready to go to the parity level. For what it is worth, I believe that the parity level will eventually be tested, but that doesn’t mean we get there easily. Furthermore, it’s also worth noting that there has to be a certain amount of profit-taking sooner or later, so that might also be a factor in this pair. I have no interest in buying the euro, and if I wanted to buy something against the US dollar, the euro would be just about at the bottom of that list.
Ready to trade our EUR/USD daily forecast? Here’s a list of some of the top forex brokers in Europe to check out.
The EUR/JPY bottomed near 159.69 and rose past 160.50 on Friday after registering two consecutive days of losses as risk appetite deteriorated. At the time of writing, the cross-pair trades at 160.82, up 0.69%.
The EUR/JPY trades sideways, capped on the downside by the Ichimoku cloud (Kumo) near the daily low and peaked at the top of the Kumo at 161.45.
Although momentum is slightly bearish, with the Relative Strength Index (RSI) below its neutral level, sellers must push the EUR/JPG beneath the bottom of the kumo toward 159.00.
A breach of the latter will exacerbate a December 3 swing low test of 156.16. On further weakness, 156.00 is up next, followed by the August 5 swing low of 154.39.
On the upside, the first resistance is 161.00, the top of the range at 161.45, and the 50-day Simple Moving Average (SMA) at 161.75. Once surpassed the next stoup would be the 162.00 mark.
The table below shows the percentage change of Euro (EUR) against listed major currencies today. Euro was the strongest against the Japanese Yen.
| USD | EUR | GBP | JPY | CAD | AUD | NZD | CHF | |
|---|---|---|---|---|---|---|---|---|
| USD | -0.02% | 0.31% | 0.51% | 0.05% | -0.12% | 0.01% | 0.24% | |
| EUR | 0.02% | 0.33% | 0.61% | 0.06% | -0.09% | 0.04% | 0.26% | |
| GBP | -0.31% | -0.33% | 0.27% | -0.26% | -0.41% | -0.29% | -0.07% | |
| JPY | -0.51% | -0.61% | -0.27% | -0.52% | -0.70% | -0.56% | -0.34% | |
| CAD | -0.05% | -0.06% | 0.26% | 0.52% | -0.18% | -0.03% | 0.19% | |
| AUD | 0.12% | 0.09% | 0.41% | 0.70% | 0.18% | 0.14% | 0.35% | |
| NZD | -0.01% | -0.04% | 0.29% | 0.56% | 0.03% | -0.14% | 0.22% | |
| CHF | -0.24% | -0.26% | 0.07% | 0.34% | -0.19% | -0.35% | -0.22% |
The heat map shows percentage changes of major currencies against each other. The base currency is picked from the left column, while the quote currency is picked from the top row. For example, if you pick the Euro from the left column and move along the horizontal line to the US Dollar, the percentage change displayed in the box will represent EUR (base)/USD (quote).
Image © Adobe Images
The Pound to Dollar exchange rate will end the year higher, according to the consensus. However, analysts at HSBC reckon this is way too optimistic.
Investment bank forecasters reckon the current trend of GBP/USD weakness will ultimately run its course and a decisive turnaround will see the pair track higher again through the second half of the year.
An overvalued dollar is expected to reach an exhaustion point, while memories of GBP outperformance in 2023 and 2024 remain strong in analysts’ minds, leading them to project more of the same in 2025. (For a look at the consensus forecasts taken around the turn of the year, see here.)
However, HSBC analyst Daragh Maher says the GBP setup is increasingly dovish, and the consensus will be disappointed.
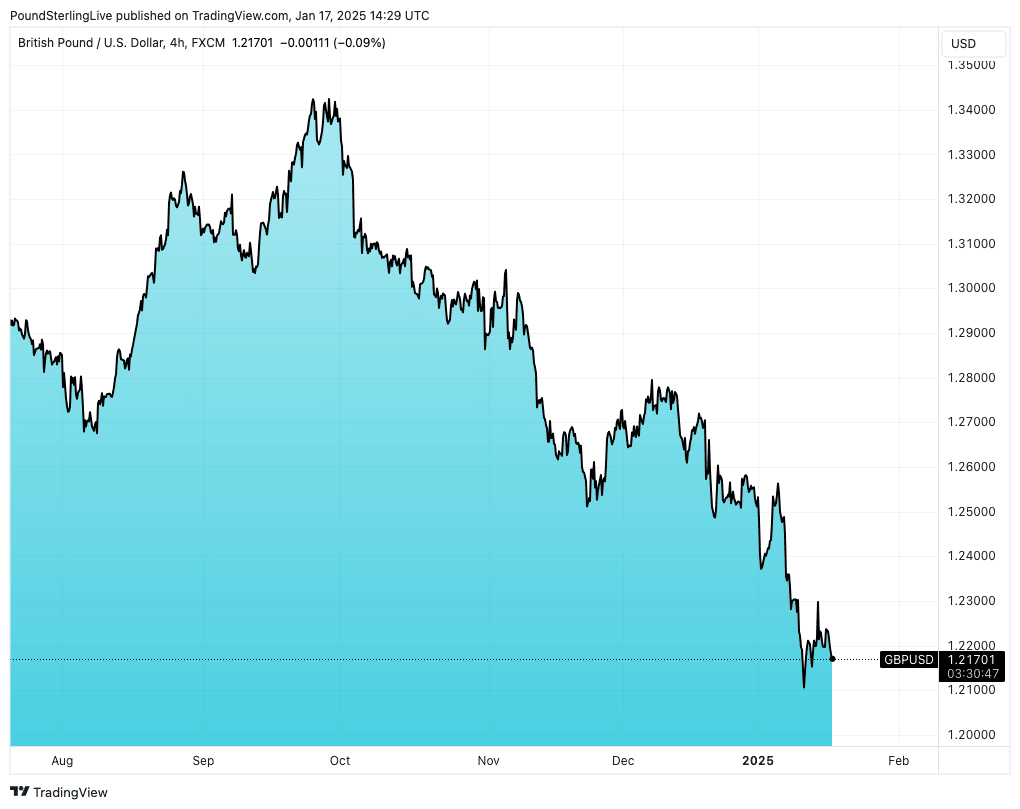
Following news that UK retail sales shrank in December, defying expectations for expansion, the Pound extended its 2025 decline against the Dollar to 1.2161. “Another day, and another dovish nugget for GBP to digest,” opines Maher.
He says there are clear structural issues now in play for the currency:
“This time around it was softer than expected UK retail sales. While softer than expected UK inflation carried ambiguous implications for GBP as a currency caught between structural fiscal concerns and cyclical unease, weaker activity signals are simply negative.”
Pound Sterling has lost 4% of its value against the U.S. Dollar already in 2025 as a multi-month downtrend extends steadily to the next big round number target of 1.20.
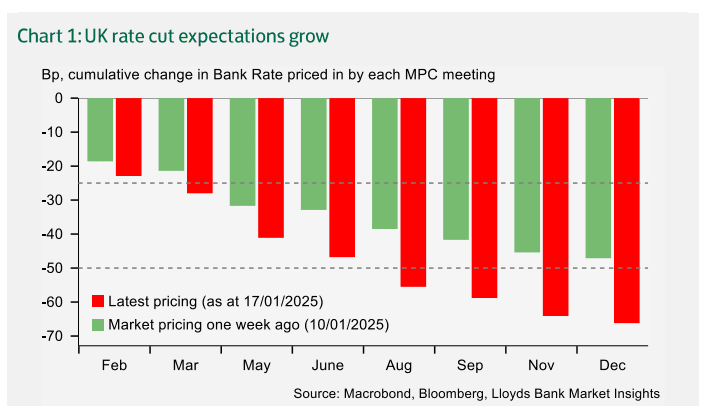
Above: Rate cut bets are growing, but the market isn’t yet even priced for three cuts this year, suggesting there is ample scope to grow. Image courtesy of Lloyds Bank.

The case is building for the Bank of England to accelerate the pace it cuts interest rate cuts, but the problem for GBP is that the market is still behind the curve.
“November GDP data confirmed that the economy is stagnating. Today’s unexpected drop in retail sales during December
suggests little respite. In the space of two weeks, the market probability of a 6 February BoE rate cut has gone from 60% to over 90%. But we suspect there is scope for a further dovish reappraisal with not even three 25bp cuts fully priced in,” notes Maher.
British Pound outperformance in 2024 was driven by an expectation that the Bank of England would cut rates at a slower pace than other major central banks amidst a robust economy and still-elevated inflation.
“A consensus among FX forecasters, taken only a week ago when spot GBP-USD was 1.2150, is that it will finish the year at 1.26. This seems notably optimistic to us,” notes Maher.
For a look at the consensus forecasts taken around the turn of the year, see here.
The US Dollar was down more than 1.7% against the Japanese Yen at the lows off the week with USD/JPY threatening a break of a multi-week range. The immediate focus is on this pullback with multi-month uptrend support in view ahead of the extended holiday break. Battle lines drawn on the USD/JPY short-term technical charts heading into the Presidential Inauguration and the BoJ next week.
Review my latest Weekly Strategy Webinar for an in-depth breakdown of this Yen setup and more. Join live on Monday’s at 8:30am EST.
Chart Prepared by Michael Boutros, Sr. Technical Strategist; USD/JPY on TradingView
Technical Outlook: In last month’s Japanese Yen Technical Forecast we noted that a rebound off technical support in USD/JPY was, “testing the first major resistance hurdle- looking for possible inflection here. From a trading standpoint, the focus is on a breakout of the weekly opening range (149.60-151.99) for guidance with the near-term recovery vulnerable while below the 200-day moving average.”
USD/JPY broke through resistance the following day with the rally extending nearly 6.9% off the December lows into key resistance at 157.89-158.45. A break of the January opening-range yesterday has already fallen more than 2.4% off the monthly high and the immediate focus is on this pullback towards uptrend support.

Chart Prepared by Michael Boutros, Sr. Technical Strategist; USD/JPY on TradingView
A closer look at Japanese Yen price action shows USD/JPY trading within the confines of a proposed descending pitchfork extending off the monthly high with price bounding off the median-line into the close of the week. Initial resistance is being tested now at the November high-close around 156.26 with near-term bearish invalidation set to the objective monthly / yearly open at 157.19. Ultimately, a breach /close above 158.45 is needed to mark uptrend resumption / fuel the next major leg of the advance towards the April high at 160.21.
Initial support rests with the November high-day close (HDC) / 23.6% retracement of the September advance at 154.32/34 and is backed by the lower parallel / 200-day moving average around 152.80s- both levels of interest for possible downside exhaustion / price inflection IF reached. Ultimately, a break / close below the 38.2% retracement / 2022 & 2023 highs at 151.50/95 would be needed to suggest a more significant high was registered last week / a lager trend reversal is underway.

Bottom line: A break of the January opening-range threatens a deeper pullback within the multi-month advance. From a trading standpoint, losses should be limited to the 200-day moving average IF price is heading higher on this stretch with a breach / close above 158.45 needed to fuel the next major leg of the advance.
Keep in mind we are heading into an extended holiday weekend with the inauguration of President Trump and the Bank of Japan (BoJ) interest rate decision on tap next week. Stay nimble here and watch the weekly closes for guidance. Review my latest Japanese Yen Weekly Forecast for a closer look at the longer-term USD/JPY technical trade levels.

Economic Calendar – latest economic developments and upcoming event risk.
— Written by Michael Boutros, Sr Technical Strategist
Follow Michael on X @MBForex
While the major indices rallied, FX markets were fairly contained in the first half of Friday’s session, with the EUR/USD trading flat around the 1.03 handle. Other euro crosses were all higher as risk appetite improved further with some of the major European indices such as the German DAX and UK’s FTSE 100 hitting new record highs. The improvement in sentiment has been driven this week by a sharp drop in global bond yields, owing to weaker-than-expected inflation data from both the US and UK. We also had some surprisingly strong Chinese data overnight, which helped to reduce fears about China’s economy. What’s more, the ceasefire in Gaza has also helped to soothe investor concerns. But with Trump set to take office on Monday, we could see the return of heightened volatility again. After all, he has promised implementing drastic policies from day one. So, the short-term EUR/USD forecast is subject to increased risks from Trump’s unexpected
The People’s Bank of China will set the 1- and 5-year Loan Prime Rate (LPR) hours before Donald Trump officially takes office. This is a benchmark lending rate to influence short-term interest rates as part of its monetary policy strategy. After months of sub-par growth, and negative inflation, China has been stuck in a deflationary environment. Throughout last year, the PBOC and China’s government were quite busy unleashing various stimulus measures to revive the economy. Judging by the latest data released overnight, it seems like efforts paid some dividends. GDP grew 5.4% in the final quarter of 2024 compared to a year earlier, exceeding analysts’ expectations and marking the fastest pace of growth in 6 quarters. Industrial production and retail sales also beat. The key takeaway point is that China met its growth objective. But with Trump’s return, we could see Chinese exports suffer amid raised tariffs in the coming months and so volatility could return to markets. However, at this meeting, the PBOC may decide against increasing its stimulus measures, and keep rates on hold. But it may still surprise given the ongoing slump in the stock market, yuan and its bond yields.
The PMI data will be released on Friday, January 24, from around the world. Perhaps most important to the EUR/USD forecast will be those from the Eurozone. Global growth concerns have been among factors behind the softness in some of the major currencies such as the euro, pound and yuan. The Purchasing Manager’s Indices are leading indicators of economic health. The rationale is that businesses react quickly to market conditions, and their purchasing managers hold some of the most current insights into the company’s view of the economy. Therefore, if we see some improvement, it should at least help to relief some selling pressure on the single currency.

Source: TradingView.com
The near-term technical EUR/USD forecast remains tilted to the downside. The question remains whether the pair will test and possibly break below the parity (1.000) level in the coming weeks. So far, the 1.0200 level has provided decent support.
Meanwhile, in terms of resistance levels to watch, 1.0300-1.0340 now marks a key resistance zone. This area had previously served as support, so we may see some pressure come back into the market from around this zone. The bearish trend line comes in just above this zone, too. While below these levels, the path of least resistance on the EUR/USD remains to the downside. A potential break above here would be a bullish development – we will cross that bridge if and when we get there.
— Written by Fawad Razaqzada, Market Analyst
Follow Fawad on Twitter @Trader_F_R
Silver price trades negatively to press on the key support 30.63$, which urges caution from the upcoming trading, as the price needs to hold above this level to keep the positive scenario active for today, which its next target located at 31.63$, reminding you that breaking the mentioned support will push the price to suffer intraday losses and visit 29.63$ mainly.
The expected trading range for today is between 30.50$ support and 31.40$ resistance.
Trend forecast: Bullish
The GBPJPY pair continued to form negative trades since yesterday, to notice approaching the target at 189.30 that forms the key to confirm the continuation of the negativity for the upcoming period.
Note that getting continuous negative momentum by the major indicators will ease the mission to break the current obstacle, to keep our bearish overview to target 188.10 level followed by reaching the major support at 186.90, while breaching 191.40 will postpone the decline and form correctional bullish trades on the near-term and medium-term basis.
The expected trading range for today is between 188.10 and 190.70
Trend forecast: Bearish
Silver (XAG/USD) attracts some sellers on Friday and for now, seems to have snapped a three-day winning streak to the $31.00 neighborhood, or over a one-month high touched the previous day. The white metal remains depressed through the first half of the European session and currently trades around the $30.60-$30.55 area, down 0.70% for the day.
From a technical perspective, the recent move-up witnessed since the beginning of this month stalls near a confluence hurdle comprising the 100-day Simple Moving Average (SMA) and the top end of a descending channel extending from a multi-year top touched in October. A sustained breakout through the said barrier should pave the way for a further near-term appreciating move for the XAG/USD.
Given that oscillators on the daily chart are holding comfortably in positive territory and are away from being in the overbought zone, the commodity might then accelerate the momentum towards the $31.70 hurdle. The subsequent move-up should allow the XAG/USD to reclaim the $32.00 round-figure mark and climb further towards testing the December monthly swing high, around the $32.30-$32.35 region.
On the flip side, any further decline could be seen as a buying opportunity near the $30.40-$30.35 region, which, in turn, should help limit the downside near the $30.00 psychological mark. A convincing break below the latter might prompt technical selling and drag the XAG/USD towards the $29.55-$29.50 support en route to the $29.00 mark and the $28.75-$28.70 area, or a multi-month low touched in December.
Silver is a precious metal highly traded among investors. It has been historically used as a store of value and a medium of exchange. Although less popular than Gold, traders may turn to Silver to diversify their investment portfolio, for its intrinsic value or as a potential hedge during high-inflation periods. Investors can buy physical Silver, in coins or in bars, or trade it through vehicles such as Exchange Traded Funds, which track its price on international markets.
Silver prices can move due to a wide range of factors. Geopolitical instability or fears of a deep recession can make Silver price escalate due to its safe-haven status, although to a lesser extent than Gold’s. As a yieldless asset, Silver tends to rise with lower interest rates. Its moves also depend on how the US Dollar (USD) behaves as the asset is priced in dollars (XAG/USD). A strong Dollar tends to keep the price of Silver at bay, whereas a weaker Dollar is likely to propel prices up. Other factors such as investment demand, mining supply – Silver is much more abundant than Gold – and recycling rates can also affect prices.
Silver is widely used in industry, particularly in sectors such as electronics or solar energy, as it has one of the highest electric conductivity of all metals – more than Copper and Gold. A surge in demand can increase prices, while a decline tends to lower them. Dynamics in the US, Chinese and Indian economies can also contribute to price swings: for the US and particularly China, their big industrial sectors use Silver in various processes; in India, consumers’ demand for the precious metal for jewellery also plays a key role in setting prices.
Silver prices tend to follow Gold’s moves. When Gold prices rise, Silver typically follows suit, as their status as safe-haven assets is similar. The Gold/Silver ratio, which shows the number of ounces of Silver needed to equal the value of one ounce of Gold, may help to determine the relative valuation between both metals. Some investors may consider a high ratio as an indicator that Silver is undervalued, or Gold is overvalued. On the contrary, a low ratio might suggest that Gold is undervalued relative to Silver.