The main category of Forex News.
You can use the search box below to find what you need.
[wd_asp id=1]
The main category of Forex News.
You can use the search box below to find what you need.
[wd_asp id=1]
The GBPJPY pair continued to form negative trades since yesterday, to notice approaching the target at 189.30 that forms the key to confirm the continuation of the negativity for the upcoming period.
Note that getting continuous negative momentum by the major indicators will ease the mission to break the current obstacle, to keep our bearish overview to target 188.10 level followed by reaching the major support at 186.90, while breaching 191.40 will postpone the decline and form correctional bullish trades on the near-term and medium-term basis.
The expected trading range for today is between 188.10 and 190.70
Trend forecast: Bearish
Silver (XAG/USD) attracts some sellers on Friday and for now, seems to have snapped a three-day winning streak to the $31.00 neighborhood, or over a one-month high touched the previous day. The white metal remains depressed through the first half of the European session and currently trades around the $30.60-$30.55 area, down 0.70% for the day.
From a technical perspective, the recent move-up witnessed since the beginning of this month stalls near a confluence hurdle comprising the 100-day Simple Moving Average (SMA) and the top end of a descending channel extending from a multi-year top touched in October. A sustained breakout through the said barrier should pave the way for a further near-term appreciating move for the XAG/USD.
Given that oscillators on the daily chart are holding comfortably in positive territory and are away from being in the overbought zone, the commodity might then accelerate the momentum towards the $31.70 hurdle. The subsequent move-up should allow the XAG/USD to reclaim the $32.00 round-figure mark and climb further towards testing the December monthly swing high, around the $32.30-$32.35 region.
On the flip side, any further decline could be seen as a buying opportunity near the $30.40-$30.35 region, which, in turn, should help limit the downside near the $30.00 psychological mark. A convincing break below the latter might prompt technical selling and drag the XAG/USD towards the $29.55-$29.50 support en route to the $29.00 mark and the $28.75-$28.70 area, or a multi-month low touched in December.
Silver is a precious metal highly traded among investors. It has been historically used as a store of value and a medium of exchange. Although less popular than Gold, traders may turn to Silver to diversify their investment portfolio, for its intrinsic value or as a potential hedge during high-inflation periods. Investors can buy physical Silver, in coins or in bars, or trade it through vehicles such as Exchange Traded Funds, which track its price on international markets.
Silver prices can move due to a wide range of factors. Geopolitical instability or fears of a deep recession can make Silver price escalate due to its safe-haven status, although to a lesser extent than Gold’s. As a yieldless asset, Silver tends to rise with lower interest rates. Its moves also depend on how the US Dollar (USD) behaves as the asset is priced in dollars (XAG/USD). A strong Dollar tends to keep the price of Silver at bay, whereas a weaker Dollar is likely to propel prices up. Other factors such as investment demand, mining supply – Silver is much more abundant than Gold – and recycling rates can also affect prices.
Silver is widely used in industry, particularly in sectors such as electronics or solar energy, as it has one of the highest electric conductivity of all metals – more than Copper and Gold. A surge in demand can increase prices, while a decline tends to lower them. Dynamics in the US, Chinese and Indian economies can also contribute to price swings: for the US and particularly China, their big industrial sectors use Silver in various processes; in India, consumers’ demand for the precious metal for jewellery also plays a key role in setting prices.
Silver prices tend to follow Gold’s moves. When Gold prices rise, Silver typically follows suit, as their status as safe-haven assets is similar. The Gold/Silver ratio, which shows the number of ounces of Silver needed to equal the value of one ounce of Gold, may help to determine the relative valuation between both metals. Some investors may consider a high ratio as an indicator that Silver is undervalued, or Gold is overvalued. On the contrary, a low ratio might suggest that Gold is undervalued relative to Silver.
The EURJPY pair ended yesterday by providing negative close below 160.15 level, to provide new negative signal that allows us to suggest more negative attempts to target 159.10 followed by reaching 157.85 on the medium-term basis.
Also, 160.85 level forms additional barrier, and the major indicators continue to provide the negative momentum, to support the negative overview and wait to touch the previously suggested negative stations.
The expected trading range for today is between 159.10 and 160.70
Trend forecast: Bearish
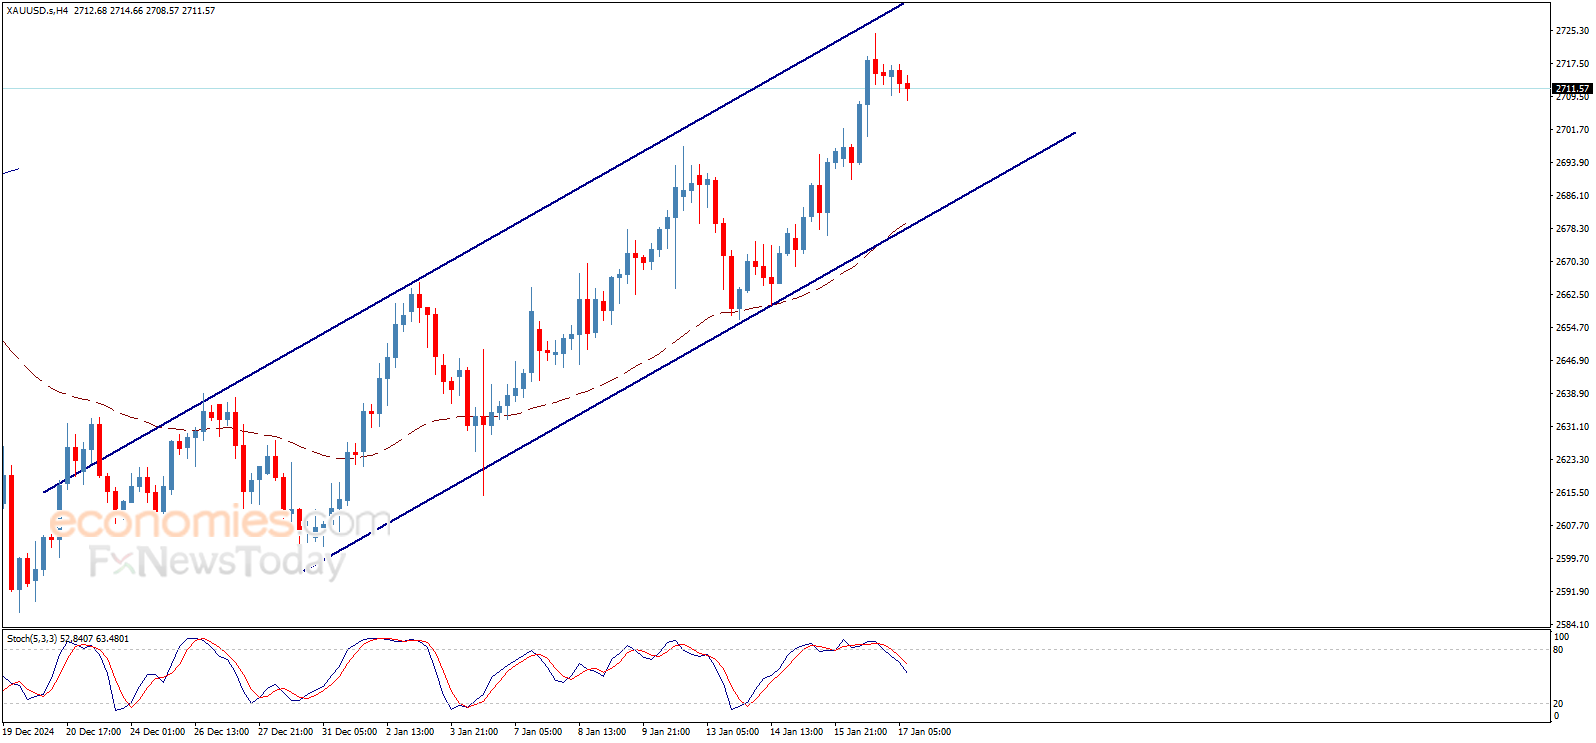
Gold price shows some slight bearish bias to head towards potential test to 2700.00$ barrier, waiting to get positive motive that push the price to resume the main bullish wave, which its targets begin by surpassing 2730.00$ to confirm opening the way to head towards 2790.00$.
On the other hand, we should note that breaking 2680.00$ will stop the bullish wave and force the price to turn to decline.
The expected trading range for today is between 2700.00$ support and 2740.00$ resistance.
Trend forecast: Bullish
The EURJPY pair ended yesterday by providing negative close below 160.15 level, to provide new negative signal that allows us to suggest more negative attempts to target 159.10 followed by reaching 157.85 on the medium-term basis.
Also, 160.85 level forms additional barrier, and the major indicators continue to provide the negative momentum, to support the negative overview and wait to touch the previously suggested negative stations.
The expected trading range for today is between 159.10 and 160.70
Trend forecast: Bearish
Bitcoin price (BTCUSD) opened today’s trading with clear positivity to surpass 100000.00$ barrier and confirm the continuation of the bullish trend domination on the intraday basis, and the way is open to achieve our next waited target at 103500.00$, noting that surpassing this level will push the price to head towards the historical high at 108350.45$ as a next main station.
Therefore, we will continue to suggest the bullish trend for the upcoming period, noting that breaking 99695.00$ will put the price under negative pressure and might target the key support 95195.00$ before any new attempt to rise.
The expected trading range for today is between 99500.00$ support and 104500.00$ resistance.
Trend forecast: Bullish
Gold price shows some slight bearish bias to head towards potential test to 2700.00$ barrier, waiting to get positive motive that push the price to resume the main bullish wave, which its targets begin by surpassing 2730.00$ to confirm opening the way to head towards 2790.00$.
On the other hand, we should note that breaking 2680.00$ will stop the bullish wave and force the price to turn to decline.
The expected trading range for today is between 2700.00$ support and 2740.00$ resistance.
Trend forecast: Bullish
Silver price (XAG/USD) holds steady after three consecutive days of gains, trading near $30.80 per troy ounce during the Asian session on Friday. The industrial demand for the grey metal may rise further, supported by strong economic data from China.
China’s Industrial Production grew by 6.2% year-over-year in December, exceeding market expectations and the 5.4% growth rate recorded in November. This marks the fastest industrial output growth since April, driven largely by stronger manufacturing activity following stimulus measures introduced in September.
Additionally, China’s Gross Domestic Product (GDP) expanded by 5.4% YoY in Q4 2024, up from 4.6% in Q3. Quarterly, the economy grew by 1.6% in Q4, aligning with market forecasts, compared to a 0.9% increase in the previous quarter.
The price of the non-yielding metal found support amid rising expectations that the Federal Reserve (Fed) will lower interest rates this year. This dovish outlook for the Fed gained traction following weaker-than-expected US Retail Sales data released on Thursday. Retail sales rose by 0.4% month-over-month (MoM) in December, totaling $729.2 billion. This figure fell short of market expectations for a 0.6% increase and was lower than the previous month’s 0.8% rise (revised from 0.7%).
Furthermore, softer-than-expected underlying inflation in the US has fueled speculation that the Fed could implement two rate cuts this year. The core Consumer Price Index (CPI), which excludes volatile food and energy prices, rose by 3.2% year-over-year (YoY) in December, slightly below both the previous month’s 3.3% increase and market forecasts of 3.3%. Monthly, the core CPI grew by 0.2%, compared to a 0.3% rise in the prior month.
Silver, a non-interest-bearing asset, finds additional support as US Treasury bond yields for the 2-year and 10-year notes stand at 4.23% and 4.60%, respectively, at the time of writing. Both yields are on track for a weekly decline of over 3%.
The US Dollar Index (DXY), which measures the USD’s performance against six major currencies, hovers near 109.00 and remains subdued for the fifth consecutive session. A weaker USD makes Silver more affordable for buyers using foreign currencies, boosting demand for the precious metal.
In addition, expectations of lower interest rates extend to the United Kingdom (UK), where economic data showed mixed signals. British GDP grew by 0.1% month-over-month (MoM) in November 2024, rebounding from contractions of 0.1% in both October and September. However, this growth fell short of the anticipated 0.2% increase.
Silver is a precious metal highly traded among investors. It has been historically used as a store of value and a medium of exchange. Although less popular than Gold, traders may turn to Silver to diversify their investment portfolio, for its intrinsic value or as a potential hedge during high-inflation periods. Investors can buy physical Silver, in coins or in bars, or trade it through vehicles such as Exchange Traded Funds, which track its price on international markets.
Silver prices can move due to a wide range of factors. Geopolitical instability or fears of a deep recession can make Silver price escalate due to its safe-haven status, although to a lesser extent than Gold’s. As a yieldless asset, Silver tends to rise with lower interest rates. Its moves also depend on how the US Dollar (USD) behaves as the asset is priced in dollars (XAG/USD). A strong Dollar tends to keep the price of Silver at bay, whereas a weaker Dollar is likely to propel prices up. Other factors such as investment demand, mining supply – Silver is much more abundant than Gold – and recycling rates can also affect prices.
Silver is widely used in industry, particularly in sectors such as electronics or solar energy, as it has one of the highest electric conductivity of all metals – more than Copper and Gold. A surge in demand can increase prices, while a decline tends to lower them. Dynamics in the US, Chinese and Indian economies can also contribute to price swings: for the US and particularly China, their big industrial sectors use Silver in various processes; in India, consumers’ demand for the precious metal for jewellery also plays a key role in setting prices.
Silver prices tend to follow Gold’s moves. When Gold prices rise, Silver typically follows suit, as their status as safe-haven assets is similar. The Gold/Silver ratio, which shows the number of ounces of Silver needed to equal the value of one ounce of Gold, may help to determine the relative valuation between both metals. Some investors may consider a high ratio as an indicator that Silver is undervalued, or Gold is overvalued. On the contrary, a low ratio might suggest that Gold is undervalued relative to Silver.
Important DisclaimersThe content provided on the website includes general news and publications, our personal analysis and opinions, and contents provided by third parties, which are intended for educational and research purposes only. It does not constitute, and should not be read as, any recommendation or advice to take any action whatsoever, including to make any investment or buy any product. When making any financial decision, you should perform your own due diligence checks, apply your own discretion and consult your competent advisors. The content of the website is not personally directed to you, and we does not take into account your financial situation or needs.The information contained in this website is not necessarily provided in real-time nor is it necessarily accurate. Prices provided herein may be provided by market makers and not by exchanges.Any trading or other financial decision you make shall be at your full responsibility, and you must not rely on any information provided through the website. FX Empire does not provide any warranty regarding any of the information contained in the website, and shall bear no responsibility for any trading losses you might incur as a result of using any information contained in the website.The website may include advertisements and other promotional contents, and FX Empire may receive compensation from third parties in connection with the content. FX Empire does not endorse any third party or recommends using any third party’s services, and does not assume responsibility for your use of any such third party’s website or services.FX Empire and its employees, officers, subsidiaries and associates, are not liable nor shall they be held liable for any loss or damage resulting from your use of the website or reliance on the information provided on this website.Risk DisclaimersThis website includes information about cryptocurrencies, contracts for difference (CFDs) and other financial instruments, and about brokers, exchanges and other entities trading in such instruments. Both cryptocurrencies and CFDs are complex instruments and come with a high risk of losing money. You should carefully consider whether you understand how these instruments work and whether you can afford to take the high risk of losing your money.FX Empire encourages you to perform your own research before making any investment decision, and to avoid investing in any financial instrument which you do not fully understand how it works and what are the risks involved.
The USDCHF price continued to decline to break the intraday bullish channel’s support line, to head towards achieving expected decline in the upcoming sessions, targeting testing 0.9035 – 0.9014 levels.
Therefore, the bearish bias will be suggested for today, noting that the expected decline is temporary, waiting to resume the main bullish trend, taking into consideration that breaching 0.9145 will stop the suggested negative scenario and push the price to rise again.
The expected trading range for today is between 0.9035 support and 0.9180 resistance.
Trend forecast: Bearish temporarily