The main category of Forex News.
You can use the search box below to find what you need.
[wd_asp id=1]
The main category of Forex News.
You can use the search box below to find what you need.
[wd_asp id=1]
The EURUSD price continues to fluctuate within tight range, and still around the EMA50, noticing that stochastic loses its positive momentum clearly, waiting to motivate the price to resume the expected bearish trend for the upcoming period, which its targets begin by breaking 1.0220$ to open the way to head towards 1.0100$.
We remind you that breaching 1.0325$ will stop the negative scenario to push the price towards starting bullish correction on the intraday basis.
The expected trading range for today is between 1.0210$ support and 1.0365$ resistance
Trend forecast: Bearish
Gold’s price has paused its three-day uptrend to monthly highs of $2,725 as buyers catch a breather ahead of the weekend and US President-elect Donald Trump’s inaugural ceremony on Monday.
Gold price has entered a bullish consolidation phase and could risk a near-term correction before resuming the uptrend toward all-time highs of $2,790. The bright metal fails to find any inspiration from stronger-than-expected China’s Gross Domestic Product (GDP) for the fourth quarter (Q4) of 2024, which came in at 5.4% over the year, compared to the 5.% estimates and the previous reading of 4.6%. Chinese Retail Sales and Industrial Production data also surpassed forecasts. China is the world’s top Gold consumer.
Chinese economy achieved its 5% growth target in the final quarter of last week but that optimism seems to be overshadowed by concerns over China’s property market and looming tariffs proposed by US President-elect Trump.
However, the downside in Gold price remains cushioned by reinforced expectations that the US Federal Reserve (Fed) will deliver two interest rate cuts this year, following the tame December inflation data released earlier this week. Dovish Fed bets continue to exert downward pressure on the US Treasury bond yields and the US Dollar (USD), underpinning the non-interest-bearing Gold price.
Mixed US Retail Sales and disappointing Initial Jobless Claims data, released on Thursday, added to the market expectations for Fed rate cuts. Initial Claims for state unemployment benefits rose to a seasonally adjusted 217,000 for the week ended Jan. 11, the Labor Department said on Thursday, missing the expected 210,000 figure.
However, Fed Governor Christopher Waller’s commentary exacerbated the pain in US Treasury bond yields and the Greenback. “If price pressures continue on the current path of decelerating, it’s reasonable to think rate cuts could possibly happen in the first half of the year,” Waller said in Thursday’s interview with CNBC.
Next of note for Gold traders, in terms of economic data, are the mid-tier US housing data and Industrial Production. The data could provide fresh trading incentives for Gold price. Further, the end-of-the-week flows and profit-taking on the recent long positions could also act as headwinds for the bullion.
The short-term technical outlook for Gold price continues to favor of Gold buyers as the previous week’s symmetrical triangle breakout remains in play and the yellow metal holds well above all the major daily simple moving averages (SMA).
The 14-day Relative Strength Index (RSI) has flattened above the midline, currently near 63.50, suggesting that Gold price could see a brief pullback before moving higher.
Gold price eyes acceptance above the key static resistance at $2,726 to extend the uptrend toward the $2,750 psychological barrier. The next target is aligned at the record high of $2,790.
If the correction unfolds, Gold price will find initial demand at the previous day’s low of $2,690, below which the January 15 low of $2,670 will be tested.
Deeper declines will challenge the powerful support area near $2,745, where the 21-day SMA, 50-day SMA, 100-SMA and the triangle convergence meet.
Gold has played a key role in human’s history as it has been widely used as a store of value and medium of exchange. Currently, apart from its shine and usage for jewelry, the precious metal is widely seen as a safe-haven asset, meaning that it is considered a good investment during turbulent times. Gold is also widely seen as a hedge against inflation and against depreciating currencies as it doesn’t rely on any specific issuer or government.
Central banks are the biggest Gold holders. In their aim to support their currencies in turbulent times, central banks tend to diversify their reserves and buy Gold to improve the perceived strength of the economy and the currency. High Gold reserves can be a source of trust for a country’s solvency. Central banks added 1,136 tonnes of Gold worth around $70 billion to their reserves in 2022, according to data from the World Gold Council. This is the highest yearly purchase since records began. Central banks from emerging economies such as China, India and Turkey are quickly increasing their Gold reserves.
Gold has an inverse correlation with the US Dollar and US Treasuries, which are both major reserve and safe-haven assets. When the Dollar depreciates, Gold tends to rise, enabling investors and central banks to diversify their assets in turbulent times. Gold is also inversely correlated with risk assets. A rally in the stock market tends to weaken Gold price, while sell-offs in riskier markets tend to favor the precious metal.
The price can move due to a wide range of factors. Geopolitical instability or fears of a deep recession can quickly make Gold price escalate due to its safe-haven status. As a yield-less asset, Gold tends to rise with lower interest rates, while higher cost of money usually weighs down on the yellow metal. Still, most moves depend on how the US Dollar (USD) behaves as the asset is priced in dollars (XAU/USD). A strong Dollar tends to keep the price of Gold controlled, whereas a weaker Dollar is likely to push Gold prices up.
The USDJPY price provided additional negative trades yesterday to touch 38.2% Fibonacci correction level for the rise measured from 148.64 to 158.87, and the price needs to confirm the continuation of the decline and achieve additional bearish correction that its next target reaches 153.75.
Until now, the bearish trend still suggested for the upcoming period, supported by the negative pressure formed by the EMA50, reminding you that breaching 156.45 will stop the correctional bearish scenario to push the price to return to the main bullish track again.
The expected trading range for today is between 154.50 support and 156.10 resistance
Trend forecast: Bearish
Investing.com — Morgan Stanley (NYSE:) has revised its forecast for U.S. prices in 2025. The bank’s analysts attribute this change to the ongoing LNG expansion cycle and the increasing heating demand due to what is projected to be the coldest January in a decade.
The bank now predicts that prices at Henry Hub will average $4.15 per million British thermal units (mmBtu) this year, a rise from the previous estimate of $3.75/mmBtu.
Additionally, Morgan Stanley has reduced its storage estimate for the end of March from 1.84 trillion cubic feet (Tcf) to 1.55 Tcf. This represents a decrease of about 17% below the 5-year average.
The analysts noted that winter weather has been a beneficial factor so far, but it remains an unpredictable element for the 2025 outlook. If February and March bring milder weather, inventories could remain at around 1.8 Tcf.
However, if the winter withdrawal season concludes with colder-than-normal conditions, stock levels could drop to approximately 1.3 Tcf, they said.
This article was generated with the support of AI and reviewed by an editor. For more information see our T&C.
Technical Analysis
The technical analysis for this market is rather dire, and the candlestick on Wednesday will have done nothing to change that attitude. After all, the US dollar got hammered after the CPI number, but you can see that we have turned right back around to show weakness here. This is mainly due to the fact that the European Union is in a complete state of chaos as far as the economic situation is concerned. In fact, I saw something just yesterday that blew my mind. 16 years ago, the United States and the European Union were roughly the same size economies. Since then, the European Union added Croatia, which in theory is a small economic player, but it should add to the overall size of the economy. As things stand right now, the US economy is 50% bigger than Europe! This is how bad the EU economic decisions over the last several years have been, not the least of which is that they have decided they don’t need energy.
With that being the case, I do believe that the euro goes to parity, and after the price action on Wednesday, I am even more convinced of this. The question is whether or not parity will hold. I certainly think that if we get there it’s likely that we will see a significant bounce, but that is something that I would probably sell into. In fact, any time this pair bounces, it’s time to start selling again.

Ready to trade our free trading signals? We’ve made a list of the best European brokers to trade with worth using.
Gold price shows new positive trades to start the attempts to breach 2700.00$ level, reinforcing the expectations of continuing the bullish trend for the rest of the day, reminding you that our next target is located at 2725.00$.
The bullish channel organizes the suggested bullish wave, which will remain valid unless breaking 2672.00$ and holding with a daily close below it.
The expected trading range for today is between 2680.00$ support and 2720.00$ resistance.
Trend forecast: Bullish
Gold soared after economic data from the United States (US) showed that consumer spending remained solid, while the number of people filing for unemployment benefits rose. This weighed on US Treasury yields and boosted the precious metal, which traded above the $2,700 figure for the first time since December last year.
The yellow metal and the Greenback are trending up after Retail Sales for December rose by 0.4% MoM, missing the mark, but an upward revision of November figures to 0.8% showed the economy remains robust. On the negative front, Initial Jobless Claims for the week ending January 11 increased by 217K from 201K in the previous week, missing estimates of 210K.
Even though Retail Sales were solid and the US Treasury yield remained firm, Bullion buyers remained in charge, driving prices higher. Wednesday’s US inflation figures increased the chances that the Federal Reserve (Fed) will further ease policy in 2025.
Market participants are pricing in near-even odds that the Fed would cut rates twice by the end of 2025 and see the first reduction in June.
Recent Fed speaking has shown that officials remained concerned about the upcoming Trump administration’s policies, some of which, like applying tariffs, are inflation-prone.
Ahead this week the economic docket will feature housing data and the release of US Industrial Production data.
Gold’s uptrend is set to continue, but buyers will face key resistance at $2,726, the December 12 high. A breach of the latter will expose $2,750 and the record high of $2,790. Conversely, if XAU/USD slips below $2,700, a pullback is seen toward the January 13 swing low of $2,656.
Momentum favors further upside, as the Relative Strength Index (RSI) depicts.
Gold has played a key role in human’s history as it has been widely used as a store of value and medium of exchange. Currently, apart from its shine and usage for jewelry, the precious metal is widely seen as a safe-haven asset, meaning that it is considered a good investment during turbulent times. Gold is also widely seen as a hedge against inflation and against depreciating currencies as it doesn’t rely on any specific issuer or government.
Central banks are the biggest Gold holders. In their aim to support their currencies in turbulent times, central banks tend to diversify their reserves and buy Gold to improve the perceived strength of the economy and the currency. High Gold reserves can be a source of trust for a country’s solvency. Central banks added 1,136 tonnes of Gold worth around $70 billion to their reserves in 2022, according to data from the World Gold Council. This is the highest yearly purchase since records began. Central banks from emerging economies such as China, India and Turkey are quickly increasing their Gold reserves.
Gold has an inverse correlation with the US Dollar and US Treasuries, which are both major reserve and safe-haven assets. When the Dollar depreciates, Gold tends to rise, enabling investors and central banks to diversify their assets in turbulent times. Gold is also inversely correlated with risk assets. A rally in the stock market tends to weaken Gold price, while sell-offs in riskier markets tend to favor the precious metal.
The price can move due to a wide range of factors. Geopolitical instability or fears of a deep recession can quickly make Gold price escalate due to its safe-haven status. As a yield-less asset, Gold tends to rise with lower interest rates, while higher cost of money usually weighs down on the yellow metal. Still, most moves depend on how the US Dollar (USD) behaves as the asset is priced in dollars (XAU/USD). A strong Dollar tends to keep the price of Gold controlled, whereas a weaker Dollar is likely to push Gold prices up.
The Japanese Yen rallied more than 0.9% against the U.S. Dollar since the start of the week with USD/JPY pulling back from technical resistance on the heels of yesterday’s CPI print. Support is in view and the focus is on possible price inflection ahead- decision time for the bulls. Battle lines drawn on the USD/JPY weekly technical chart.
Review my latest Weekly Strategy Webinar for an in-depth breakdown of this Yen setup and more. Join live on Monday’s at 8:30am EST.
Chart Prepared by Michael Boutros, Sr. Technical Strategist; USD/JPY on TradingView
Technical Outlook: In last month’s Japanese Yen Technical Forecast we noted that USD/JPY was, “approaching major technical resistance, and the focus is on possible inflection into this threshold. From a trading standpoint, look to reduce portions of long-exposure / raise protective stops on a test of 157.16/89- losses should be limited to 152 IF price is heading higher on this stretch with a close above this pivot zone needed to mark resumption of the September uptrend.”
USD/JPY registered an intraday high at 158.08 the following week with price holding below uptrend resistance for five consecutive weeks. Key resistance now adjusted to the April high-close / January high at 158.45/88– a breach / weekly close above this threshold is needed to mark uptrend resumption towards subsequent resistance objectives at the 1990 high / 2024 high-week close (HWC) at 160.40/74, and the 2024 swing high at 161.95– look for a larger reaction there IF reached.
Initial weekly support is now in view at the November high-close near the 155-handle. Note that basic channel support converges on this level over the next few weeks and a break below this slope is needed to suggest a more significant high was registered last week / a larger reversal is underway. Subsequent support objectives seen at the 2022 /2023 highs & the 52-week moving average at 151.95-152.13 and the 2022 high-close / 2023 HWC at 148.74-149.360– both levels of interest for possible downside exhaustion / price inflection IF reached.

Bottom line: USD/JPY turned from long-term uptrend resistance this week with the price now approaching initial trend support. From a trading standpoint, losses should be limited to channel support IF price is heading higher on this stretch with a close above 158.88 needed to mark uptrend resumption.
Keep in mind we are heading into an extended holiday weekend with the inauguration of President Trump and the Bank of Japan (BoJ) interest rate decision on tap next week. Stay nimble here into support and watch the weekly closes for guidance. I’ll publish an updated Japanese Yen Short-term Outlook once we get further clarity on the near-term USD/JPY technical trade levels.

Economic Calendar – latest economic developments and upcoming event risk.
— Written by Michael Boutros, Sr Technical Strategist
Follow Michael on X @MBForex
Spot Gold keeps advancing on Thursday, posting fresh highs above the $2,720.00 level in the mid-American session. The market mood soured ahead of the United States (US) opening, as macroeconomic data was tepid while Federal Reserve (Fed) Governor Christopher Waller said that interest rate cuts could come sooner and faster than expected if the disinflation trend holds up. As a result, investors lifted bets for an interest rate cut in May.
Earlier in the day, the United States reported that Retail Sales rose a modest 0.4% in December, below the 0.6% expected and the previously revised 0.8%. At the same time, Initial Jobless Claims for the week ended January 10 increased by 217K, worse than the 210K expected. The US Dollar (USD) lost ground with the news, as Wall Street struggles to post gains.
Market players will now shift the focus to China, as the country will publish early in Asia Q4 Gross Domestic Product (GDP) figures. Additionally, China will release December Industrial Production and Retail Sales.
Technical readings in the daily chart support additional XAU/USD gains. The pair extends gains above its moving averages, with bullish 20 and 100 Simple Moving Averages (SMA) converging at around $2,643, both gaining upward traction. At the same time, technical indicators extended their advances within positive levels, with room to extend their advance in the upcoming sessions.
In the near term, and according to the 4-hour chart, Gold is overbought yet there are no signs of upward exhaustion. The 20 SMA accelerated its advance far below the current level, while the 100 SMA is about to cross above the 200 SMA, both far below the shorter one. Finally, technical indicators have partially lost their positive momentum but keep heading north despite developing at extreme levels. A relevant resistance comes at around $2,725, with gains beyond it exposing the all-time high in the $2,790 region.
Support levels: 2,712.90 2,700.00 2,685.05
Resistance levels: 2,725.00 2,738.15 2,751.10
According to Forex trading, dollar bulls needed an inflation reading that exceeded consensus to maintain their momentum, but they received news of an unexpected slowdown in core US inflation. The US dollar had retreated after the US core consumer price index (CPI) fell to 3.2% year-on-year from 3.3% (exp: 3.3%), marking the first decline since July. Overall, US core inflation, which consists of core inflation minus rents, remains elevated but is still trending down. Also, reported was that core consumer price inflation rose to 2.9% year-on-year in December from 2.7%, which was in line with expectations and helped to bolster expectations for a rate cut in June.
Expectations for US Federal Reserve Policies
Influenced by the announcement of US inflation figures, US Treasury yields declined, stocks rose, and money market prices showed that traders had increased their bets on the next US interest rate cut by the Federal Reserve in June, with a possible second cut in the second half of 2025. Overall, the data comes amid signs that the US dollar is at a peak and is trading above its fundamental drivers. This overvalued assessment was driven by a series of US economic data that came in above consensus, which now leaves room for further upside at a particularly high level. Consequently, this makes the US dollar vulnerable to data releases that meet or fall short of expectations.
According to reliable trading platforms, the US Dollar Index – a measure of the US dollar’s strength against a basket of currencies – is now more than 25% above its 25-year average and at a level we have only seen briefly since the 1980s. According to Forex analysts at Societe Generale, the overvalued US dollar assessment seems to reflect the policies of incoming US President Donald Trump that are leading the market. Furthermore, the risk is that what he offers fails to meet expectations.
However, there is also limited scope for significant US interest rate cuts, given the strength of the US economy, suggesting that a defeat for the dollar is unlikely either.
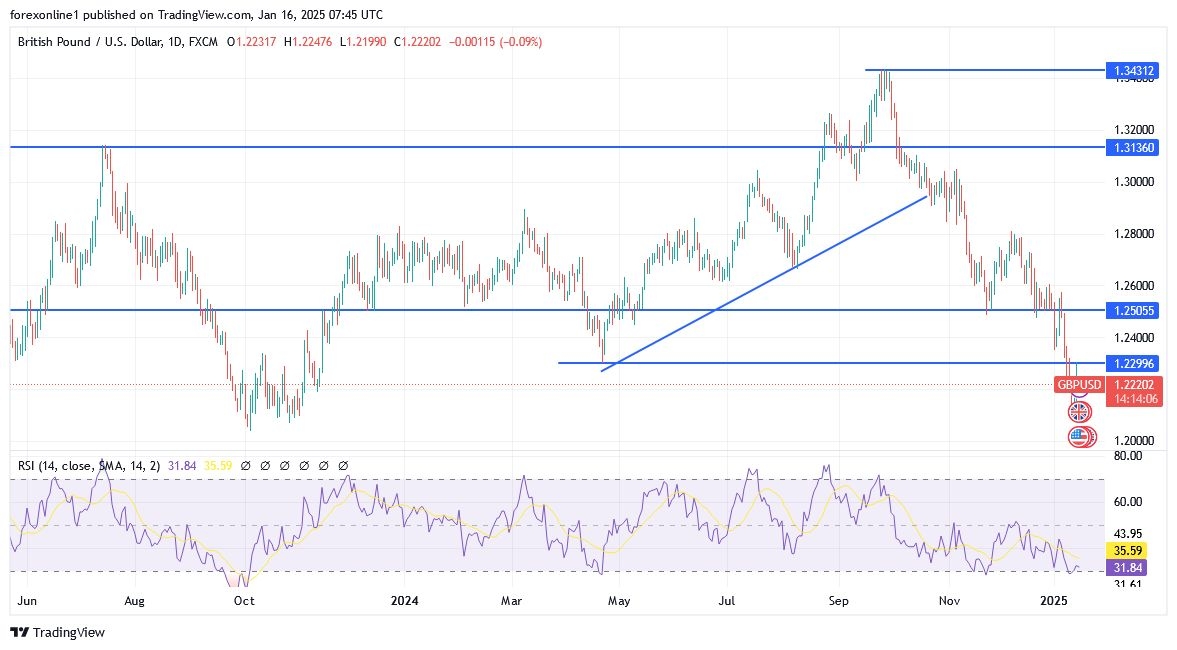
Dear TradersUp follower, the British financial crisis will remain a negative pressure factor for investor sentiment towards the British pound in the coming period, threatening any gains against the US dollar and other major currencies.
Dear reader, according to trading on the daily chart, the general trend of the GBP/USD pair is still bearish. As mentioned before, we expected that the gains of the GBP/USD pair will remain vulnerable to a rapid collapse. Furthermore, we still prefer to sell the GBP/USD from every upward level. Currently, the closest resistance levels for the currency pair are 1.2330, 1.2420, and 1.2500, respectively. The technical indicators, the Relative Strength Index and the MACD, are still bearish.
Today, the pound will be affected by the announcement of the British economic growth reading and the industrial sector. The US dollar will be affected by the announcement of US retail sales figures, weekly jobless claims and the Philadelphia Fed manufacturing index.
Ready to trade our daily Forex forecast? Here’s a list of some of the top forex brokers UK to check out.