The main category of Forex News.
You can use the search box below to find what you need.
[wd_asp id=1]
The main category of Forex News.
You can use the search box below to find what you need.
[wd_asp id=1]
Gold soared after economic data from the United States (US) showed that consumer spending remained solid, while the number of people filing for unemployment benefits rose. This weighed on US Treasury yields and boosted the precious metal, which traded above the $2,700 figure for the first time since December last year.
The yellow metal and the Greenback are trending up after Retail Sales for December rose by 0.4% MoM, missing the mark, but an upward revision of November figures to 0.8% showed the economy remains robust. On the negative front, Initial Jobless Claims for the week ending January 11 increased by 217K from 201K in the previous week, missing estimates of 210K.
Even though Retail Sales were solid and the US Treasury yield remained firm, Bullion buyers remained in charge, driving prices higher. Wednesday’s US inflation figures increased the chances that the Federal Reserve (Fed) will further ease policy in 2025.
Market participants are pricing in near-even odds that the Fed would cut rates twice by the end of 2025 and see the first reduction in June.
Recent Fed speaking has shown that officials remained concerned about the upcoming Trump administration’s policies, some of which, like applying tariffs, are inflation-prone.
Ahead this week the economic docket will feature housing data and the release of US Industrial Production data.
Gold’s uptrend is set to continue, but buyers will face key resistance at $2,726, the December 12 high. A breach of the latter will expose $2,750 and the record high of $2,790. Conversely, if XAU/USD slips below $2,700, a pullback is seen toward the January 13 swing low of $2,656.
Momentum favors further upside, as the Relative Strength Index (RSI) depicts.
Gold has played a key role in human’s history as it has been widely used as a store of value and medium of exchange. Currently, apart from its shine and usage for jewelry, the precious metal is widely seen as a safe-haven asset, meaning that it is considered a good investment during turbulent times. Gold is also widely seen as a hedge against inflation and against depreciating currencies as it doesn’t rely on any specific issuer or government.
Central banks are the biggest Gold holders. In their aim to support their currencies in turbulent times, central banks tend to diversify their reserves and buy Gold to improve the perceived strength of the economy and the currency. High Gold reserves can be a source of trust for a country’s solvency. Central banks added 1,136 tonnes of Gold worth around $70 billion to their reserves in 2022, according to data from the World Gold Council. This is the highest yearly purchase since records began. Central banks from emerging economies such as China, India and Turkey are quickly increasing their Gold reserves.
Gold has an inverse correlation with the US Dollar and US Treasuries, which are both major reserve and safe-haven assets. When the Dollar depreciates, Gold tends to rise, enabling investors and central banks to diversify their assets in turbulent times. Gold is also inversely correlated with risk assets. A rally in the stock market tends to weaken Gold price, while sell-offs in riskier markets tend to favor the precious metal.
The price can move due to a wide range of factors. Geopolitical instability or fears of a deep recession can quickly make Gold price escalate due to its safe-haven status. As a yield-less asset, Gold tends to rise with lower interest rates, while higher cost of money usually weighs down on the yellow metal. Still, most moves depend on how the US Dollar (USD) behaves as the asset is priced in dollars (XAU/USD). A strong Dollar tends to keep the price of Gold controlled, whereas a weaker Dollar is likely to push Gold prices up.
The FTSE 100 has risen to an over five-week high after weak GDP data sent the pound lower.
UK GDP figures showed that the UK economy grew 0.1% in November, slower than the 0.2% forecast. However, this is up slightly from the 0.1% decline in output in October and September. The data confirms that growth momentum in the UK has cooled since labour came to power and confirms the country is stuck in a stagflation trap.
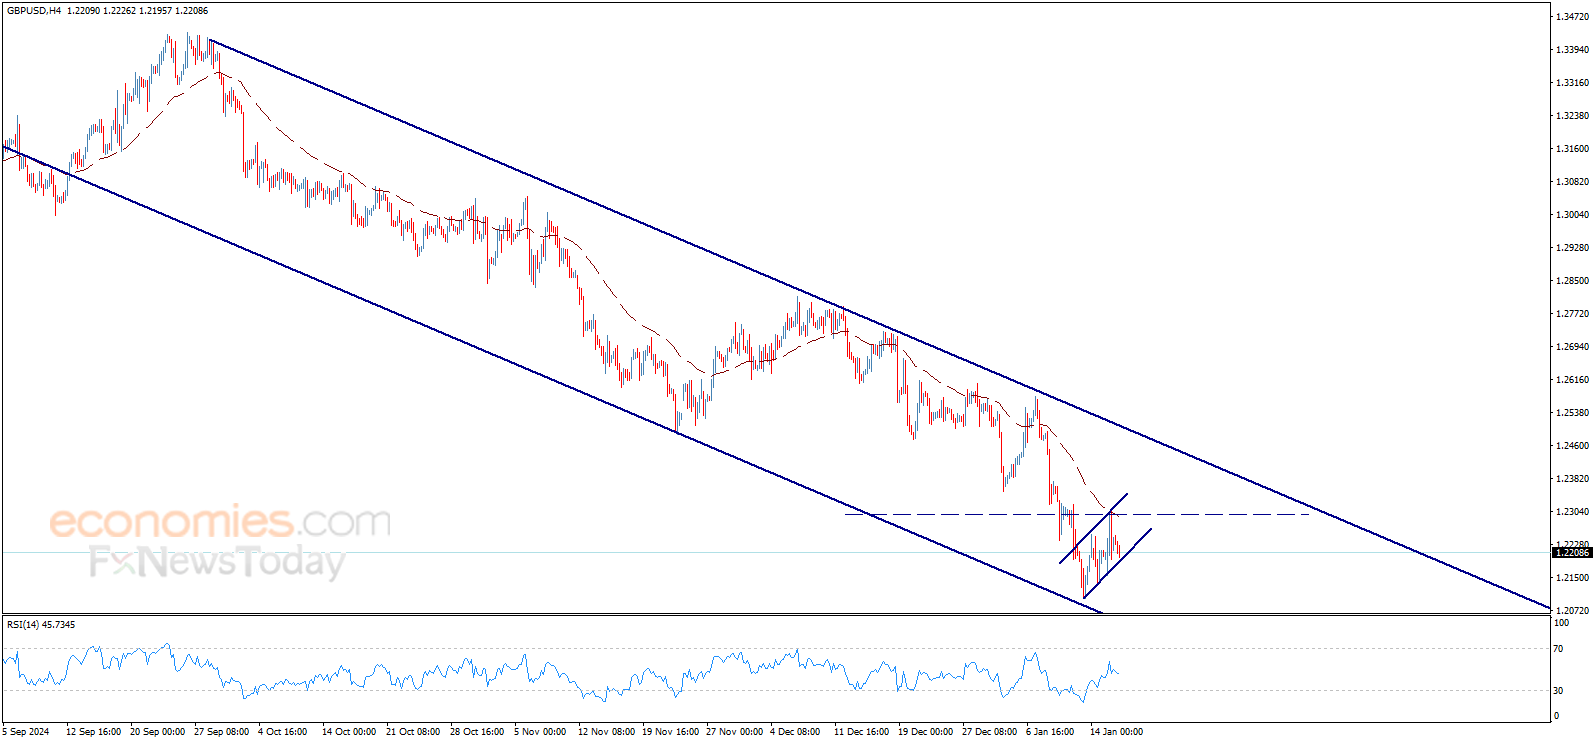
Following the data, the pound has fallen back below 1.22, paring yesterday’s gains following cooler UK and US inflation data. The weaker pound, owing to the more beneficial exchange rate, helps to boost the multinationals which make up around 80% of the FTSE.
Mining stocks are leading the gains, boosted by a rebound in iron ore prices and a rally in gold following yesterday’s US inflation data, which increased hopes of a further Fed rate cut this year.
In corporate news, Antofagasta is up 2.9% after posting higher copper and gold production in Q4, while Rio shares have climbed as the company reaffirmed its outlook and announced increased copper output.
Taylor Wimpey is leading the losses, down over 3%, after reporting UK home sales near the top end of guidance, but flagged growing costs.
Looking ahead, attention will turn to US jobless claims and retail sales later today for further clues over the health of the US economy and the outlook for Fed rate cuts.
The FTSE 100 has traded within a holding pattern since May last year. More recently the price has extended its recovery from 8000, rising above the 200 SMA at 8225 and has broken above 8325, the level that has capped gains for much of the past 9-months.
Buyers supported by the bullish breakout and the RSI above 50 will look to extend gains towards 8400 and 8480 to fresh record highs.
Support is seen at 8325. A break below here takes the price back into the holding channel and exposes the 200 SMA at 8225. Below here, 8150 comes into focus ahead of 8000.
EUR/USD is holding steady below 1.03 after modest losses yesterday amid ongoing concerns surrounding the Eurozone’s economic outlook. Dovish ECB commentary reinforces the expectations of further rate cuts while the USD rises versus major peers.
The euro is finding some support from an upward revision to German inflation, which rose 0.5% MoM in December, while core CPI rose 3.3%, up from 3%. However, the data raises stagflation concerns for the eurozone’s largest economy and reaffirms expectations of further rate cuts by the ECB.
ECB policymakers have remained dovish. This week, Finland governor Olli Rhen commented that he sees monetary policy leaving restrictive territory, most likely by midsummer. While ECB’s Philip Lane warned over keeping rates too restrictive for too long.
Attention now turns to ECB minutes, which could provide further clues about the outlook for rate cuts this year. eBay is expected to cut rates by 25 basis points at the end of this month, and three more rate cuts are expected this year.
The USD is steadying after losses versus its major peers yesterday after cooling US core inflation and falling bond yields pulled the currency lower.
US core inflation was 0.2% month on month in December down from 0.3% and annualised core inflation eased to 3.2% below the three-point 3% expected. Attention now turns to a slew of U.S. data, including jobless claims and retail sales. Solid numbers could highlight the strength of the US economy and lift the US dollar higher.

EUR/USD has been in a downward trend since September, forming a series of lower highs and lower lows before running into support at 1.0180.
The pair remains vulnerable as the bearish trend persists and the RSI is below 50. Sellers will look to take out 1.0180 support to extend losses towards parity.
Meanwhile, buyers could be encouraged by the hammer candlestick on January 13 which could point to a bullish reversal. Buyers would need to rise above 1.0330, the November low, and 1.0460 to negate the near-term downtrend. A rise above 1.0630 the December high, creates a higher high.

Goldman Sachs’ stock price (GS) rallied in the intraday levels, shaking off negative pressure from the 50-day SMA, amid the dominance of the main upward trend in the medium term, and accompanied by a surge in trading volumes, as the stock tries to tackle the pivotal resistance of $611.90, while managing to vent off overbought saturation in the RSI with positive signals streaming out of it.
Therefore we expect more gains for the price, provided the resistance of $611.90 was breached, targeting the next one at $654.54.
Trend forecast for today: Bullish
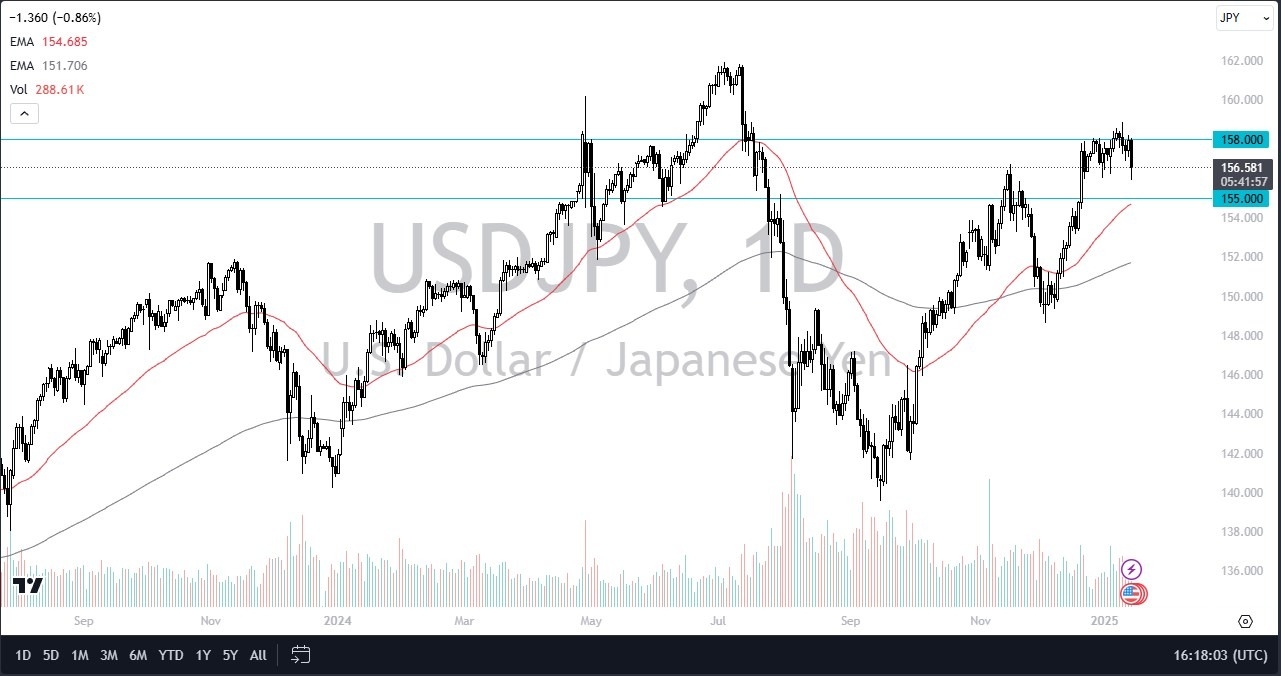
The technical analysis for this pair is still very strong, and it is probably worth noting that we have bounced enough to at least suggest that support should be held in this pair. If that’s going to be the case, then I suspect that we will find this pair reaching the ¥158 level much quicker than anticipated. With that being the case, I am still looking at this pair through the same prism that I was in the previous session, and I look at this as an opportunity to pick up “cheap US dollars”, at least until we were to break down below the ¥155 level.
It’s worth keeping in mind that the ¥155 level is also attracting the 50 Day EMA at the moment, which of course is a major technical indicator. With this, I think you have to look at the longer term trend and recognize that the markets have been bullish for some time. If we can break out above the ¥158 level, then I think it opens up the possibility of a move to the ¥160 level over the longer term. On the other hand, if we were to break down below the ¥155 level, then you might get a little bit more negative on this pair. However, you still get paid a swap at the end of every day, and that is something worth noting.

Want to trade our USD/JPY forex analysis and predictions? Here’s a list of forex brokers in Japan to check out.
Silver price (XAG/USD) moves higher to near $31.00 in Thursday’s European session. The white metal gains as traders have raised bets supporting the Federal Reserve (Fed) to deliver more than one interest rate cut this year.
According to the CME FedWatch tool, traders are pricing in two interest rate cuts this year, the first coming in June instead of September, as forecasted before the December inflation data were released.
As measured by the Consumer Price Index (CPI), headline inflation accelerated to 2.9%, as expected; however, the core reading—which excludes volatile food and energy prices—surprisingly rose at a slower pace of 3.2%.
Typically, signs of acceleration in Fed dovish bets bode well for non-yielding assets, such as Silver.
Meanwhile, the US Dollar Index (DXY), which tracks the Greenback’s value against six major currencies, ticks higher to near 109.00 but has corrected from the two-year high of 110.00. 10-year US Treasury yields edge higher to near 4.66% but have come down from its yearly high of 4.80%.
Silver price gathers strength to break above the upward-sloping trendline around $30.85, which is plotted from the 29 February 2024 low of $22.30 on a daily timeframe.
The white metal rebounded strongly after discovering strong buying interest near the 200-day Exponential Moving Average (EMA), which is around $29.45. It then climbed above the 20-day EMA, which is around $30.00, suggesting a bullish near-term trend.
The 14-day Relative Strength Index (RSI) jumps to near 60.00. A fresh bullish momentum would trigger if its manages to break above 60.00.
Silver is a precious metal highly traded among investors. It has been historically used as a store of value and a medium of exchange. Although less popular than Gold, traders may turn to Silver to diversify their investment portfolio, for its intrinsic value or as a potential hedge during high-inflation periods. Investors can buy physical Silver, in coins or in bars, or trade it through vehicles such as Exchange Traded Funds, which track its price on international markets.
Silver prices can move due to a wide range of factors. Geopolitical instability or fears of a deep recession can make Silver price escalate due to its safe-haven status, although to a lesser extent than Gold’s. As a yieldless asset, Silver tends to rise with lower interest rates. Its moves also depend on how the US Dollar (USD) behaves as the asset is priced in dollars (XAG/USD). A strong Dollar tends to keep the price of Silver at bay, whereas a weaker Dollar is likely to propel prices up. Other factors such as investment demand, mining supply – Silver is much more abundant than Gold – and recycling rates can also affect prices.
Silver is widely used in industry, particularly in sectors such as electronics or solar energy, as it has one of the highest electric conductivity of all metals – more than Copper and Gold. A surge in demand can increase prices, while a decline tends to lower them. Dynamics in the US, Chinese and Indian economies can also contribute to price swings: for the US and particularly China, their big industrial sectors use Silver in various processes; in India, consumers’ demand for the precious metal for jewellery also plays a key role in setting prices.
Silver prices tend to follow Gold’s moves. When Gold prices rise, Silver typically follows suit, as their status as safe-haven assets is similar. The Gold/Silver ratio, which shows the number of ounces of Silver needed to equal the value of one ounce of Gold, may help to determine the relative valuation between both metals. Some investors may consider a high ratio as an indicator that Silver is undervalued, or Gold is overvalued. On the contrary, a low ratio might suggest that Gold is undervalued relative to Silver.
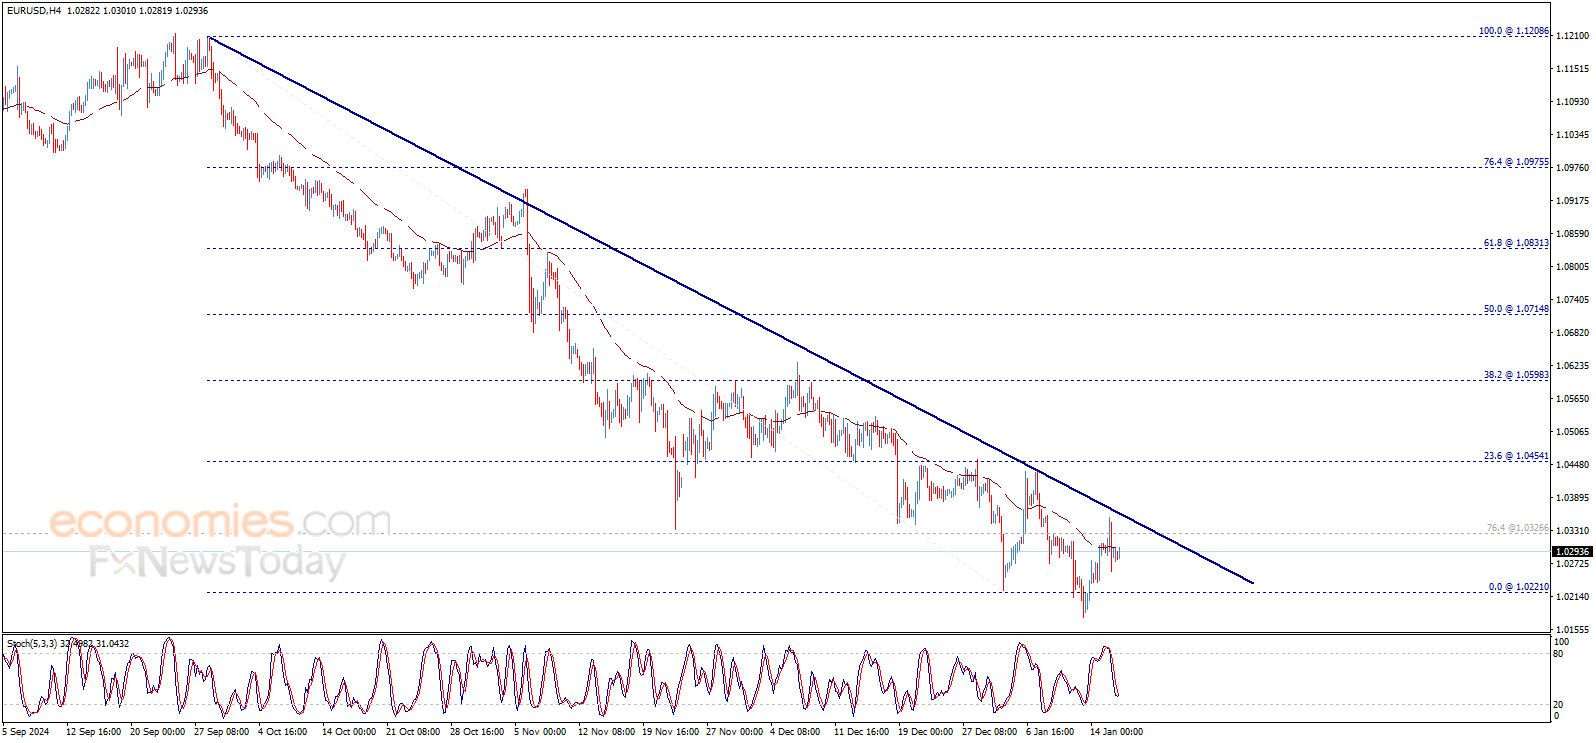
The EURUSD price didn’t show any strong move since this morning, to continue fluctuating around the EMA50, thus, no change to the expected bearish trend scenario for today, which depends on the price stability below 1.0325$, while its targets begin at 1.0220$ and extend to 1.0100$ after breaking the previous level.
The expected trading range for today is between 1.0200$ support and 1.0360$ resistance
Trend forecast: Bearish
The EURUSD price didn’t show any strong move since this morning, to continue fluctuating around the EMA50, thus, no change to the expected bearish trend scenario for today, which depends on the price stability below 1.0325$, while its targets begin at 1.0220$ and extend to 1.0100$ after breaking the previous level.
The expected trading range for today is between 1.0200$ support and 1.0360$ resistance
Trend forecast: Bearish
Ethereum price (ETHUSD) traded with clear positivity yesterday to touch our waited target at 3425.50$, noticing that the price finds good resistance there, to show some slight bearish bias, waiting to get positive motive that push the price to surpass this level and confirm opening the way to achieve more gains on the intraday and short-term basis, to head towards visiting 3570.00$ followed by 3680.00$ areas as next positive targets.
Therefore, we are waiting for positive trades in the upcoming sessions, taking into consideration that failing to breach 3425.00$ will stop the bullish wave and push the price to head towards testing 3222.00$ areas before any new positive attempt.
The expected trading range for today is between 3250.00$ support and 3520.00$ resistance.
Trend forecast: Bullish
The AUDUSD price managed to touch the main bearish channel’s resistance line, and begins to rebound bearishly to attempt to build bearish wave on the intraday and short-term basis, on its way to achieve negative targets that start at 0.6140$ and extend to 0.6075$.
Note that breaking 0.6200$ will complete forming bearish flag pattern that reinforce the expectations to decline in the upcoming period, while breaching 0.6245$ will stop the bearish trend and lead the price to start bullish correction on the intraday and short-term basis.
The expected trading range for today is between 0.6160$ support and 0.6260$ resistance
Trend forecast: Bearish
The GBPJPY pair confirmed its surrender to the domination of the bearish bias by forming many negative waves and break 191.40 level, to notice achieving some waited negative targets by touching 189.90 level.
The price might face difficulty to resume the negative attack due to stochastic consolidation above 20 level, to expect providing some sideways trades until gathering the required additional negative momentum to attack 189.30 level, which breaking it will confirm targeting new negative stations that might start at 188.10 and 186.90 levels.
The expected trading range for today is between 189.30 and 191.60
Trend forecast: Bearish