The main category of Forex News.
You can use the search box below to find what you need.
[wd_asp id=1]
The main category of Forex News.
You can use the search box below to find what you need.
[wd_asp id=1]
Gold price is trading close to the highest level in five weeks just above $2,700 in Thursday’s Asian trading. Traders look forward to a fresh batch of US economic data for the next leg higher in Gold price.
This week’s tame inflation data from the US brought back expectations of interest rate cuts by the US Federal Reserve (Fed) on the table, which provided extra legs to the correction in the US Dollar (USD) and the US Treasury bond yields from multi-month highs. This accentuated the Gold price upside, with buyers briefly recapturing the $2,700 in early Asian trades this Thursday.
Traders piled up bets on a Fed rate cut in June, pricing in rising odds of a second rate reduction in 2025 after inflation data. The report indicated the recent market expectations of pricing out of rate cuts this year were excessive.
US Consumer Price Index (CPI) advanced in line with estimates at an annual rate of 2.9% in December from November’s 2.7%. But core CPI, which excludes food and energy prices, rose by 3.2%, below forecasts for 3.3%. On Tuesday, the US annual PPI rose 3.3% in December, missing the expected 3.4% growth, while the core PPI inflation rose to 3.5% year-on-year (YoY) in the same period, compared to the market forecast of 3.8%.
The dovish Fed expectations, Chinese stimulus hopes and fading concerns over US President-elect Trump’s disruptive trade tariffs support the prevalent risk-on market mood, keeping the safe-haven US Dollar broadly subdued and Gold price at higher levels.
Looking ahead, the focus shifts to more economic data releases from the US, including the December Retail Sales and the weekly Jobless Claims, which will provide more clarity on the Fed’s interest rate trajectory beyond January. Markets have fully priced in a rate-pause decision at the Fed’s policy meeting later this month. Gold price will also remain at the mercy of any speculations surrounding Trump’s tariff plans.
The short-term technical outlook for Gold price continues to support Gold buyers, courtesy of last week’s symmetrical triangle breakout.
The 14-day Relative Strength Index (RSI) points higher above the midline, currently near 60, suggesting that Gold price remains a ‘buy-the-dips’ trade in the coming days.
Gold price must seek a daily candlestick closing above the $2,700 barrier to initiate a fresh uptrend toward the $2,750 psychological level.
Ahead of that level, the December 12 high of $2,726 will challenge bearish commitments.
Conversely, strong support is located at the January 15 low of $2,670, below which sellers must crack the $2,640 demand area.
That zone is the confluence of the 21-day Simple Moving Average (SMA), 50-day SMA, 100-SMA and the triangle convergence, making it a powerful support.
If the downside momentum accelerates, the January 6 low of $2,615 could come to buyers’ rescue.
Gold has played a key role in human’s history as it has been widely used as a store of value and medium of exchange. Currently, apart from its shine and usage for jewelry, the precious metal is widely seen as a safe-haven asset, meaning that it is considered a good investment during turbulent times. Gold is also widely seen as a hedge against inflation and against depreciating currencies as it doesn’t rely on any specific issuer or government.
Central banks are the biggest Gold holders. In their aim to support their currencies in turbulent times, central banks tend to diversify their reserves and buy Gold to improve the perceived strength of the economy and the currency. High Gold reserves can be a source of trust for a country’s solvency. Central banks added 1,136 tonnes of Gold worth around $70 billion to their reserves in 2022, according to data from the World Gold Council. This is the highest yearly purchase since records began. Central banks from emerging economies such as China, India and Turkey are quickly increasing their Gold reserves.
Gold has an inverse correlation with the US Dollar and US Treasuries, which are both major reserve and safe-haven assets. When the Dollar depreciates, Gold tends to rise, enabling investors and central banks to diversify their assets in turbulent times. Gold is also inversely correlated with risk assets. A rally in the stock market tends to weaken Gold price, while sell-offs in riskier markets tend to favor the precious metal.
The price can move due to a wide range of factors. Geopolitical instability or fears of a deep recession can quickly make Gold price escalate due to its safe-haven status. As a yield-less asset, Gold tends to rise with lower interest rates, while higher cost of money usually weighs down on the yellow metal. Still, most moves depend on how the US Dollar (USD) behaves as the asset is priced in dollars (XAU/USD). A strong Dollar tends to keep the price of Gold controlled, whereas a weaker Dollar is likely to push Gold prices up.
Energy markets experienced a strong start at the beginning of 2025, with global oil prices jumping to their highest levels in five months, registering a notable increase of an average of 10%.
This significant rise was driven by growing concerns over the potential reduction of Russian crude oil supplies to the global market, especially after the United States imposed a new round of sanctions on Russia’s energy sector.
Additionally, rising expectations of improved global demand, particularly with the strong economic growth led by the United States alongside intensive measures to stimulate the Chinese economy, contributed to this surge.
Recent decisions by the OPEC+ alliance also played a crucial role in determining the price trajectory, as an extension of production restrictions was announced to better balance supply and demand in the market.
On the other hand, geopolitical tensions in some oil-producing regions have heightened concerns among traders about supply stability. This has led to increased insurance costs for shipments, which in turn has impacted prices.
Furthermore, the decline in U.S. inventories has boosted optimism about market recovery, with recent data showing a significant drop in commercial stocks.
In light of these developments, energy experts expect the positive momentum of oil prices to continue during the first quarter of the year, with expectations of further increases if current conditions persist. However, the market remains sensitive to any sudden changes that might affect supply or demand.
This report details the main reasons behind the surge in oil prices, with a comprehensive analysis of future trends that may determine the market’s path in the coming months.
On January 10, 2025, the United States imposed a new package of sanctions on Russia’s energy sector, targeting major companies such as “Gazprom Neft” and “Surgutneftegaz,” in addition to over 180 oil tankers.
These measures aim to reduce Russia’s revenues from oil and gas exports, as part of ongoing efforts to pressure Moscow due to the ongoing war in Ukraine.
These sanctions are expected to affect Russia’s ability to export oil and gas, potentially reducing its revenues from the energy sector. They may also cause disruptions in global energy markets, given Russia’s prominent role as a major source of oil and gas.
In 2024, India and China emerged as the largest importers of Russian crude oil, benefiting from competitive prices and discounts offered by Moscow amidst Western sanctions.
This shift in oil flows reflects a reshaping of the global energy map, as Russia seeks to strengthen its relations with Asian countries to overcome the impact of Western sanctions, while countries like India and China benefit from opportunities to obtain oil at discounted prices.
Traders and analysts have stated that Russian oil exports will be severely affected by the new sanctions, pushing China and India to obtain more crude from the Middle East, Africa, and the Americas, which will drive up prices and shipping costs.
In December last year, the OPEC+ alliance announced an extension of oil production cuts by two million barrels per day for an additional year, until the end of 2026 instead of 2025, as part of its ongoing efforts to support the stability of global oil markets and enhance the balance between supply and demand.
Additionally, the eight countries contributing to the voluntary oil production cuts, amounting to 2.2 million barrels per day, decided to extend the timeline for lifting these cuts by an additional three months, so they end at the end of March 2025 instead of the previous deadline at the end of the current December.
OPEC+ members are currently implementing production cuts totaling 5.9 million barrels per day, equivalent to about 5.7% of global demand.
Harsh weather in Europe and the United States has had a notable impact on oil markets recently, as unusual weather conditions have contributed to increased demand for fuel and higher prices. The main impacts are as follows:
Major central banks in the United States, Europe, the United Kingdom, Canada, and New Zealand continue to cut interest rates and ease tight monetary policies, aiming to halt the decline in economic activity and preserve achieved gains. Low interest rates typically reduce borrowing costs, which can boost economic activity and increase demand for oil.
Chinese authorities took additional new stimulus measures during the last quarter of 2024 to support the country’s weak economic activities, which will also reflect in improved oil demand levels in the world’s largest crude importer.
Chinese authorities announced that they will adopt a “somewhat accommodative” monetary policy, according to an official statement issued by a meeting of senior Communist Party officials, a term last used in 2010 when they sought to support recovery from the global financial crisis.
According to the ruling party’s political office, the country will adopt a “sufficiently accommodative” monetary policy in 2025, alongside a more proactive fiscal policy to stimulate economic growth.
The crude oil market in 2025 faces numerous challenges that could significantly impact its prices, including the following:
Licenses:
CySEC, BaFin, FCA, SCB, CMA
74-89% of CFD retail investor accounts lose money.

Licenses:
ASIC, CySEC, CMA, STV, FSCA, FSA
Licenses:
CySEC, ASIC, IFSC, DFSA, FSA
Plus500 Futures trading is available to US residents only.

Licenses:
CySEC, ASIC, IFSC, DFSA, FCA
When applying the Fibonacci correction rule to different timeframes of oil prices, we find that there are signals suggesting the price direction towards recovering the upward trend in the medium to long term. After several attempts to reach the 50% Fibonacci level for the entire rise measured from historical lows around $0.44 to the recorded peak at $126.34, the price bounced upward and broke through a significant resistance level, as shown in the following weekly chart:
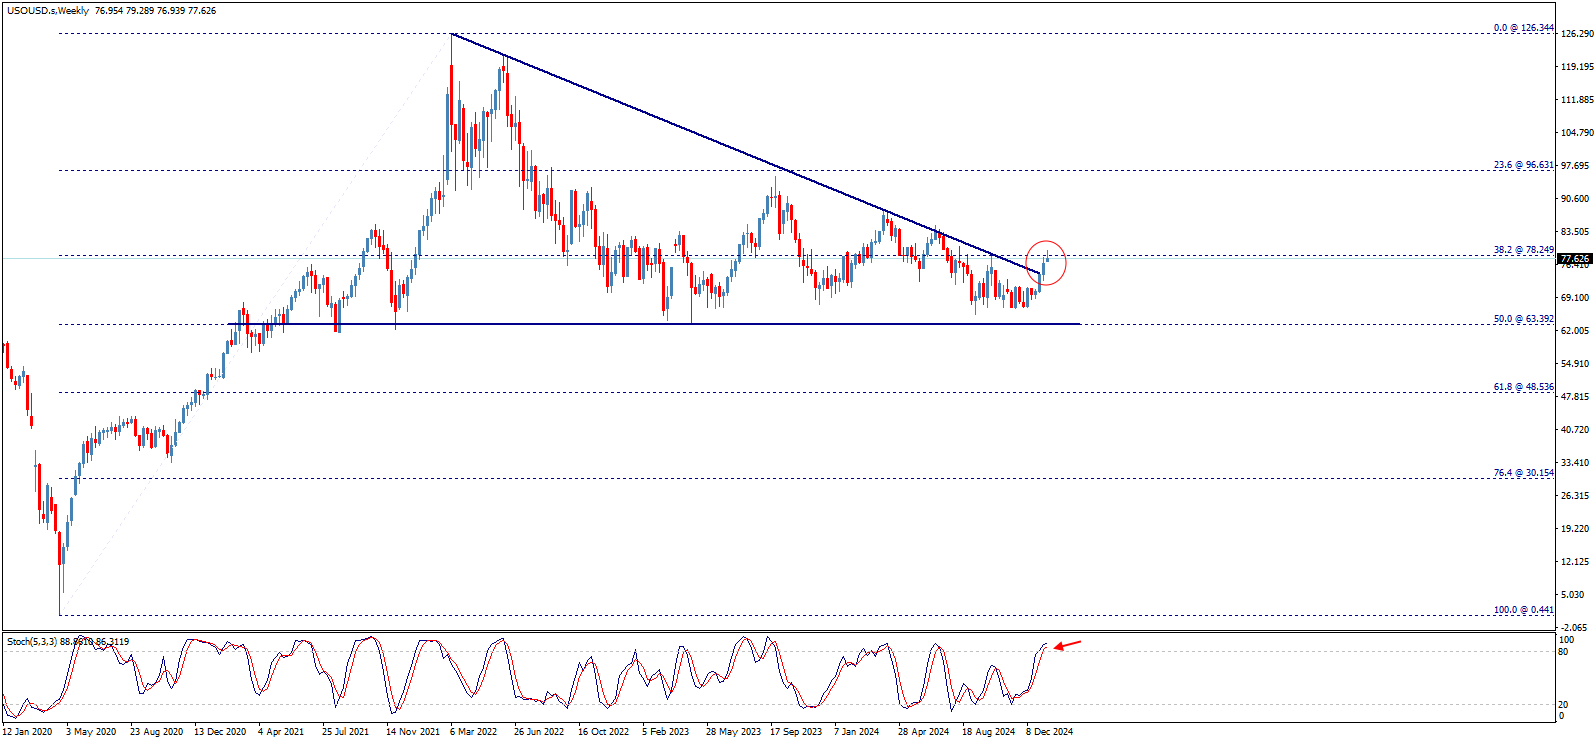
The price is attempting to break through the resistance level formed at the previously broken 38.2% Fibonacci correction level, forming a significant resistance at $78.25. Breaking this level represents a key confirmation for the continuation of the upward wave and the direction to achieve positive targets starting at $84.40 and extending to areas of $90.00 and then $96.60 in the medium term.
The Stochastic indicator shows negative signals on the weekly timeframe, which may hinder the price’s task of achieving the required breakout at $78.25 and delay the confirmation of the breakout. This indicates that we need a weekly close above this level to confirm the continued rise.
On the other hand, on the daily timeframe, we find that the price began an upward correction from the recorded low in 2023 at $63.76. We observe that the price surpassed the 23.6% Fibonacci level to build more upward waves in the short term, targeting the visit to the 85.70% level as the next corrective target.

Continuing the application of Fibonacci corrections to different timeframes, the four-hour chart shows that the upward wave initiated by the price from the $67.05 area faced temporary downward retracements, followed by a resumption of the main upward trend. This contributed to pushing the price higher by forming ascending flag patterns, as shown in the chart below. Currently, the price is undergoing a downward correction that may lead it to test the $76.40 areas before resuming the upward wave again.
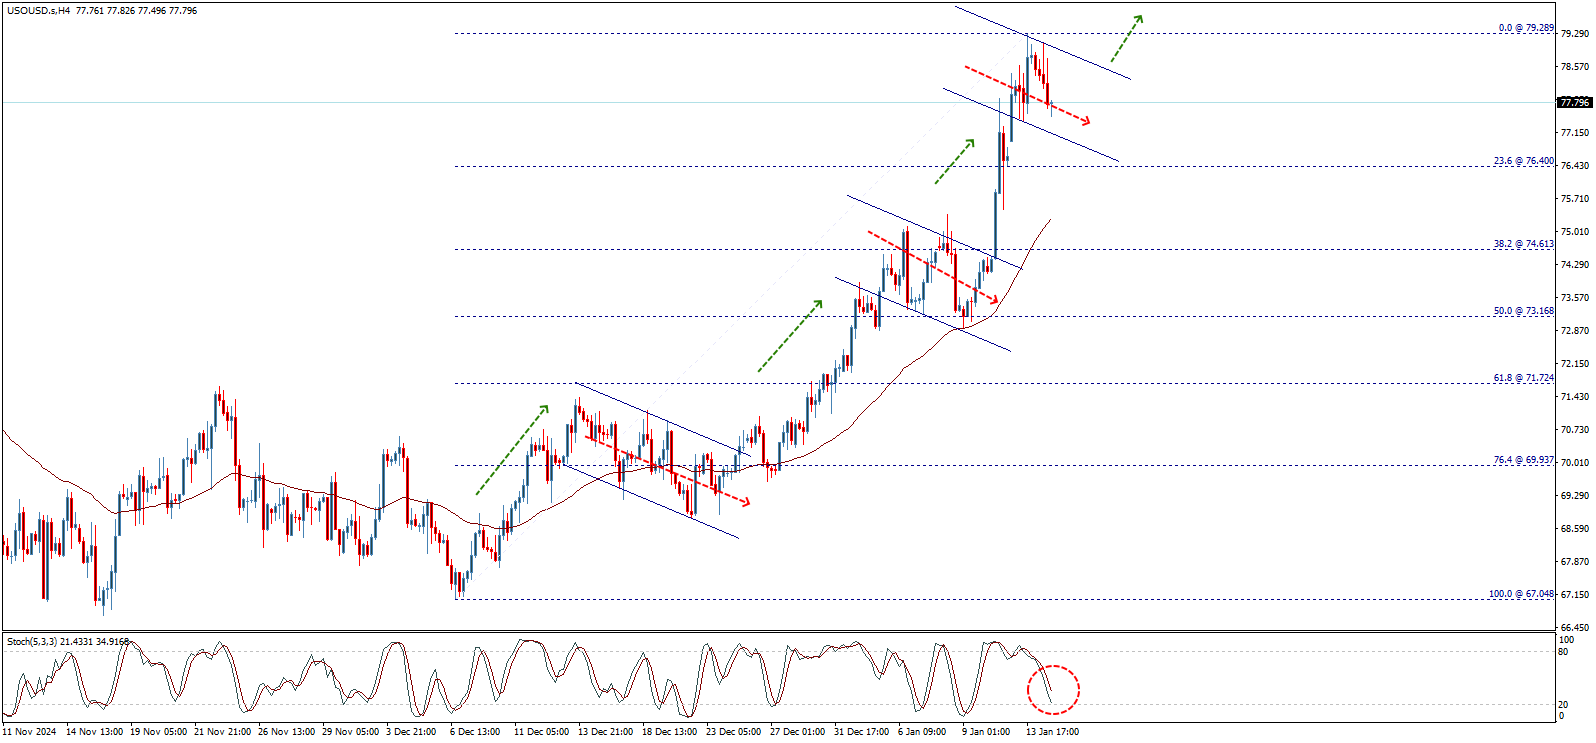
The recent trades are confined within a descending sub-channel forming a continuation flag pattern, meaning that breaking $78.90 will provide a good positive incentive supporting the continued upward trend in the upcoming period, aiming to achieve the aforementioned positive targets.
In summary, the expected overall trend for the upcoming period is upward, confirmed by breaking $78.25 and then $78.90, to receive positive incentives contributing to the surge towards levels of $84.40, then further to areas of $90.00 and $96.60.
Conversely, it is crucial to note that failing to confirm the breach of $78.90 and a downward rebound breaking the $74.60 level will force the price to turn downward, incurring new losses that could reach areas of $63.40 in the short term.
The four-hour chart shows that the upward wave initiated by the price from the $67.05 area faced temporary downward retracements, followed by a resumption of the main upward trend. This contributed to pushing the price higher by forming ascending flag patterns, as shown in the chart below. Currently, the price is undergoing a downward correction that may lead it to test the $76.40 areas before resuming the upward wave again.
In summary, the expected overall trend for the upcoming period is upward, confirmed by breaking $78.25 and then $78.90, to receive positive incentives contributing to the surge towards levels of $84.40, then further to areas of $90.00 and $96.60.
Conversely, it is crucial to note that failing to confirm the breach of $78.90 and a downward rebound breaking the $74.60 level will force the price to turn downward, incurring new losses that could reach areas of $63.40 in the short term.
In conclusion, the expected overall trend for the upcoming period is upward based on technical analysis, with necessary confirmations at $78.25 and $78.90 levels to support the continuation of the upward trend and achieve positive targets. However, attention must be paid to critical support levels at $74.60 and $63.40 in the event of negative reversals.
The overall expected trend for the upcoming period is upward based on technical analysis, with the necessity to monitor vital support and resistance levels to ensure the achievement of desired targets and avoid potential risks.
Important DisclaimersThe content provided on the website includes general news and publications, our personal analysis and opinions, and contents provided by third parties, which are intended for educational and research purposes only. It does not constitute, and should not be read as, any recommendation or advice to take any action whatsoever, including to make any investment or buy any product. When making any financial decision, you should perform your own due diligence checks, apply your own discretion and consult your competent advisors. The content of the website is not personally directed to you, and we does not take into account your financial situation or needs.The information contained in this website is not necessarily provided in real-time nor is it necessarily accurate. Prices provided herein may be provided by market makers and not by exchanges.Any trading or other financial decision you make shall be at your full responsibility, and you must not rely on any information provided through the website. FX Empire does not provide any warranty regarding any of the information contained in the website, and shall bear no responsibility for any trading losses you might incur as a result of using any information contained in the website.The website may include advertisements and other promotional contents, and FX Empire may receive compensation from third parties in connection with the content. FX Empire does not endorse any third party or recommends using any third party’s services, and does not assume responsibility for your use of any such third party’s website or services.FX Empire and its employees, officers, subsidiaries and associates, are not liable nor shall they be held liable for any loss or damage resulting from your use of the website or reliance on the information provided on this website.Risk DisclaimersThis website includes information about cryptocurrencies, contracts for difference (CFDs) and other financial instruments, and about brokers, exchanges and other entities trading in such instruments. Both cryptocurrencies and CFDs are complex instruments and come with a high risk of losing money. You should carefully consider whether you understand how these instruments work and whether you can afford to take the high risk of losing your money.FX Empire encourages you to perform your own research before making any investment decision, and to avoid investing in any financial instrument which you do not fully understand how it works and what are the risks involved.
Energy markets experienced a strong start at the beginning of 2025, with global oil prices jumping to their highest levels in five months, registering a notable increase of an average of 10%.
This significant rise was driven by growing concerns over the potential reduction of Russian crude oil supplies to the global market, especially after the United States imposed a new round of sanctions on Russia’s energy sector.
Additionally, rising expectations of improved global demand, particularly with the strong economic growth led by the United States alongside intensive measures to stimulate the Chinese economy, contributed to this surge.
Recent decisions by the OPEC+ alliance also played a crucial role in determining the price trajectory, as an extension of production restrictions was announced to better balance supply and demand in the market.
On the other hand, geopolitical tensions in some oil-producing regions have heightened concerns among traders about supply stability. This has led to increased insurance costs for shipments, which in turn has impacted prices.
Furthermore, the decline in U.S. inventories has boosted optimism about market recovery, with recent data showing a significant drop in commercial stocks.
In light of these developments, energy experts expect the positive momentum of oil prices to continue during the first quarter of the year, with expectations of further increases if current conditions persist. However, the market remains sensitive to any sudden changes that might affect supply or demand.
This report details the main reasons behind the surge in oil prices, with a comprehensive analysis of future trends that may determine the market’s path in the coming months.
On January 10, 2025, the United States imposed a new package of sanctions on Russia’s energy sector, targeting major companies such as “Gazprom Neft” and “Surgutneftegaz,” in addition to over 180 oil tankers.
These measures aim to reduce Russia’s revenues from oil and gas exports, as part of ongoing efforts to pressure Moscow due to the ongoing war in Ukraine.
These sanctions are expected to affect Russia’s ability to export oil and gas, potentially reducing its revenues from the energy sector. They may also cause disruptions in global energy markets, given Russia’s prominent role as a major source of oil and gas.
In 2024, India and China emerged as the largest importers of Russian crude oil, benefiting from competitive prices and discounts offered by Moscow amidst Western sanctions.
This shift in oil flows reflects a reshaping of the global energy map, as Russia seeks to strengthen its relations with Asian countries to overcome the impact of Western sanctions, while countries like India and China benefit from opportunities to obtain oil at discounted prices.
Traders and analysts have stated that Russian oil exports will be severely affected by the new sanctions, pushing China and India to obtain more crude from the Middle East, Africa, and the Americas, which will drive up prices and shipping costs.
In December last year, the OPEC+ alliance announced an extension of oil production cuts by two million barrels per day for an additional year, until the end of 2026 instead of 2025, as part of its ongoing efforts to support the stability of global oil markets and enhance the balance between supply and demand.
Additionally, the eight countries contributing to the voluntary oil production cuts, amounting to 2.2 million barrels per day, decided to extend the timeline for lifting these cuts by an additional three months, so they end at the end of March 2025 instead of the previous deadline at the end of the current December.
OPEC+ members are currently implementing production cuts totaling 5.9 million barrels per day, equivalent to about 5.7% of global demand.
Harsh weather in Europe and the United States has had a notable impact on oil markets recently, as unusual weather conditions have contributed to increased demand for fuel and higher prices. The main impacts are as follows:
Major central banks in the United States, Europe, the United Kingdom, Canada, and New Zealand continue to cut interest rates and ease tight monetary policies, aiming to halt the decline in economic activity and preserve achieved gains. Low interest rates typically reduce borrowing costs, which can boost economic activity and increase demand for oil.
Chinese authorities took additional new stimulus measures during the last quarter of 2024 to support the country’s weak economic activities, which will also reflect in improved oil demand levels in the world’s largest crude importer.
Chinese authorities announced that they will adopt a “somewhat accommodative” monetary policy, according to an official statement issued by a meeting of senior Communist Party officials, a term last used in 2010 when they sought to support recovery from the global financial crisis.
According to the ruling party’s political office, the country will adopt a “sufficiently accommodative” monetary policy in 2025, alongside a more proactive fiscal policy to stimulate economic growth.
The crude oil market in 2025 faces numerous challenges that could significantly impact its prices, including the following:
Licenses:
CySEC, BaFin, FCA, SCB, CMA
74-89% of CFD retail investor accounts lose money.
Licenses:
ASIC, CySEC, CMA, STV, FSCA, FSA
Licenses:
CySEC, ASIC, IFSC, DFSA, FSA
Plus500 Futures trading is available to US residents only.
Licenses:
CySEC, ASIC, IFSC, DFSA, FCA
When applying the Fibonacci correction rule to different timeframes of oil prices, we find that there are signals suggesting the price direction towards recovering the upward trend in the medium to long term. After several attempts to reach the 50% Fibonacci level for the entire rise measured from historical lows around $0.44 to the recorded peak at $126.34, the price bounced upward and broke through a significant resistance level, as shown in the following weekly chart:
The price is attempting to break through the resistance level formed at the previously broken 38.2% Fibonacci correction level, forming a significant resistance at $78.25. Breaking this level represents a key confirmation for the continuation of the upward wave and the direction to achieve positive targets starting at $84.40 and extending to areas of $90.00 and then $96.60 in the medium term.
The Stochastic indicator shows negative signals on the weekly timeframe, which may hinder the price’s task of achieving the required breakout at $78.25 and delay the confirmation of the breakout. This indicates that we need a weekly close above this level to confirm the continued rise.
On the other hand, on the daily timeframe, we find that the price began an upward correction from the recorded low in 2023 at $63.76. We observe that the price surpassed the 23.6% Fibonacci level to build more upward waves in the short term, targeting the visit to the 85.70% level as the next corrective target.
Continuing the application of Fibonacci corrections to different timeframes, the four-hour chart shows that the upward wave initiated by the price from the $67.05 area faced temporary downward retracements, followed by a resumption of the main upward trend. This contributed to pushing the price higher by forming ascending flag patterns, as shown in the chart below. Currently, the price is undergoing a downward correction that may lead it to test the $76.40 areas before resuming the upward wave again.
The recent trades are confined within a descending sub-channel forming a continuation flag pattern, meaning that breaking $78.90 will provide a good positive incentive supporting the continued upward trend in the upcoming period, aiming to achieve the aforementioned positive targets.
In summary, the expected overall trend for the upcoming period is upward, confirmed by breaking $78.25 and then $78.90, to receive positive incentives contributing to the surge towards levels of $84.40, then further to areas of $90.00 and $96.60.
Conversely, it is crucial to note that failing to confirm the breach of $78.90 and a downward rebound breaking the $74.60 level will force the price to turn downward, incurring new losses that could reach areas of $63.40 in the short term.
The four-hour chart shows that the upward wave initiated by the price from the $67.05 area faced temporary downward retracements, followed by a resumption of the main upward trend. This contributed to pushing the price higher by forming ascending flag patterns, as shown in the chart below. Currently, the price is undergoing a downward correction that may lead it to test the $76.40 areas before resuming the upward wave again.
In summary, the expected overall trend for the upcoming period is upward, confirmed by breaking $78.25 and then $78.90, to receive positive incentives contributing to the surge towards levels of $84.40, then further to areas of $90.00 and $96.60.
Conversely, it is crucial to note that failing to confirm the breach of $78.90 and a downward rebound breaking the $74.60 level will force the price to turn downward, incurring new losses that could reach areas of $63.40 in the short term.
In conclusion, the expected overall trend for the upcoming period is upward based on technical analysis, with necessary confirmations at $78.25 and $78.90 levels to support the continuation of the upward trend and achieve positive targets. However, attention must be paid to critical support levels at $74.60 and $63.40 in the event of negative reversals.
The overall expected trend for the upcoming period is upward based on technical analysis, with the necessity to monitor vital support and resistance levels to ensure the achievement of desired targets and avoid potential risks.
Silver’s price stages a comeback, rising above the 50-day Simple Moving Average (SMA) at $30.32 and eyeing a break of the 100-day SMA. At the time of writing, the XAG/USD trades at $30.64, having gained over 2.64% on Wednesday.
On its way toward its current price, XAG/USD cleared the 200-day SMA at $29.98, which exacerbated the upward move. Yet buyers need to clear the 100-day SMA at $30.82 so Silver can extend its gains.
Momentum favors further upside, yet consolidation lies ahead as the Relative Strength Index (RSI) is flat, but above the latest peak.
If buyers clear the 100-day SMA, $31.00 emerges as the next key resistance level. A break above this level opens the door to testing the latest cycle high at $32.32, the December 12 daily high.
On the other hand, if sellers step in and push XAG/USD below the 50-day SMA, it could pave the way towards $29.98, the 200-day SMA. On further weakness, the next stop would be December’s 19 swing low of $28.74.
Silver is a precious metal highly traded among investors. It has been historically used as a store of value and a medium of exchange. Although less popular than Gold, traders may turn to Silver to diversify their investment portfolio, for its intrinsic value or as a potential hedge during high-inflation periods. Investors can buy physical Silver, in coins or in bars, or trade it through vehicles such as Exchange Traded Funds, which track its price on international markets.
Silver prices can move due to a wide range of factors. Geopolitical instability or fears of a deep recession can make Silver price escalate due to its safe-haven status, although to a lesser extent than Gold’s. As a yieldless asset, Silver tends to rise with lower interest rates. Its moves also depend on how the US Dollar (USD) behaves as the asset is priced in dollars (XAG/USD). A strong Dollar tends to keep the price of Silver at bay, whereas a weaker Dollar is likely to propel prices up. Other factors such as investment demand, mining supply – Silver is much more abundant than Gold – and recycling rates can also affect prices.
Silver is widely used in industry, particularly in sectors such as electronics or solar energy, as it has one of the highest electric conductivity of all metals – more than Copper and Gold. A surge in demand can increase prices, while a decline tends to lower them. Dynamics in the US, Chinese and Indian economies can also contribute to price swings: for the US and particularly China, their big industrial sectors use Silver in various processes; in India, consumers’ demand for the precious metal for jewellery also plays a key role in setting prices.
Silver prices tend to follow Gold’s moves. When Gold prices rise, Silver typically follows suit, as their status as safe-haven assets is similar. The Gold/Silver ratio, which shows the number of ounces of Silver needed to equal the value of one ounce of Gold, may help to determine the relative valuation between both metals. Some investors may consider a high ratio as an indicator that Silver is undervalued, or Gold is overvalued. On the contrary, a low ratio might suggest that Gold is undervalued relative to Silver.
The U.S. Dollar showed a move of weakness around the U.S. CPI print this morning, and while DXY has bounced back and the EUR/USD sell-off has caught another shot-in-the-arm, USD/JPY is holding relatively close to the morning’s lows.
There’s also the breach of a support zone that had showed as prior resistance, taken from the 76.4 and 78.6% Fibonacci retracements of the July-September sell-off. This zone had previously helped to hold resistance in November, but more recently it had helped to hold support over the past two weeks, until this morning’s breach down to a lower-low.
Chart prepared by James Stanley, USD/JPY on Tradingview

On a shorter-term basis we can see where this morning’s sell-off brought upon a fresh 2025 low in the pair; but the bounce from that has, so far, held resistance at the bottom of the support zone noted above.
For overhead resistance, there’s a prior swing-low at 156.91 and the top of the Fibonacci zone at 157.17. And for next support below the 156.00 handle, it’s the 155.00 psychological level that looms large.
 Chart prepared by James Stanley, USD/JPY on Tradingview
It’s been a slippery start to the year for the British Pound and I had looked at GBP/JPY in the weekly forecast, highlighting a bearish backdrop as prices had started to push below a long-term zone. Monday saw another spill in GBP/JPY and the pair made a fast push down to the 190.00 handle before catching a sizable bounce. Resistance held overnight at 193.00 and sellers have went back for another run, but chasing this at this point could be a challenge.
From the weekly chart below, we can see a longer-term trend that’s come more and more into question, as shown by lower-highs over the past six months. But if the pair gives up the 190.00 level, the door could soon open to breakdown scenarios.
 Chart prepared by James Stanley, GBP/JPY on Tradingview
Given how quickly the pair has moved off of that 193.00 level, chasing could be challenging. But, there’s also context for a lower-high around the 192.40 level; and if that doesn’t come into the picture, the 190.81 Fibonacci level could potential be used to work with breakdown scenarios into the 190.00 psychological level.
 Chart prepared by James Stanley, GBP/JPY on Tradingview
EUR/JPY is currently within a symmetrical triangle formation and earlier this week, it was around the 160.00 level that had held the lows after bears attempted to continue the sell-off that started after resistance at the 165.00 level around the end of 2024.
Similar to GBP/JPY above, that can be a tough move to chase. But the weekly chart shows the bigger-picture where, if we do see a notable sell-off and a breach of recent congestion, a longer-term move could come into play.
 Chart prepared by James Stanley, EUR/JPY on Tradingview
From the four-hour chart of EUR/JPY, we can see another Fibonacci level coming into play at 160.90 to help hold the lows so far today. This is quite near the earlier week swing low and this could, again, be a challenging place to chase price-lower. But – it does highlight lower-high resistance potential at 161.44 or 162.04, both of which could keep the door open for a 160.00 test.
Or – if no pullback shows, a breach of 160.00 opens the door to bigger picture breakdown potential, with the next notable level-lower the Fibonacci level at 158.66.
 Chart prepared by James Stanley, EUR/JPY on Tradingview
— written by James Stanley, Senior Strategist
Brent oil price attempted to rise but it declines again to keep the correctional bearish scenario active for today, waiting to visit 79.404 as a first station, which breaking it represents the key to extend the bearish wave towards 77.83$ areas.
Therefore, our bearish overview will remain valid and active unless breaching 81.00$ and holding above it.
The expected trading range for today is between 78.40$ support and 81.40$ resistance.
Trend forecast: Bearish
The British Pound has plunged more than 3.3% since the start of month / year with GBP/USD responding to key support this week. The four-month decline may be vulnerable while above his key inflection zone and the immediate focus on this recovery in the days ahead. Battle lines drawn on the GBP/USD weekly technical chart.
Review my latest Weekly Strategy Webinar for an in-depth breakdown of this Sterling setup and more. Join live on Monday’s at 8:30am EST.
Chart Prepared by Michael Boutros, Sr. Technical Strategist; GBP/USD on TradingView
Technical Outlook: In last month’s British Pound Weekly Forecast we noted that the GBP/USD was trading into resistance at a major pivot zone with, “the immediate focus is on a breakout of the monthly range with the broader outlook still weighted to the downside while below 1.2850.” Support broke two-weeks later with Sterling plunging more than 5.2% off the December highs.
The decline responded to key support on Monday at the 2023 yearly open / 2023 low-week close (LWC) at 1.2084-1.2114. Looking for a reaction off this mark with the immediate short-bias vulnerable while above.
Initial weekly resistance is eyed at 1.2367/97– a region defined by the April low-close, the 2023 January high-week close (HWC) and the May low-week close (LWC). Note that basic channel resistance converges on this threshold over the next few weeks and further highlight the technical significance of this threshold. Ultimately, a breach / close above the 2024 LWC at 1.2494 would be needed to suggest a more significant low was registered this week / a larger trend reversal is underway (bearish invalidation).
A break / weekly close below this key pivot zone would threaten another bout of accelerated losses with subsequent support objectives seen at the January 2024 swing low / 50% retracement of the 2022 advance at 1.1841/89 and the 2020 LWC at 1.1632– both areas of interest for possible exhaustion / price inflection IF reached.

Bottom line: A four-month sell-off takes GBP/USD into pivotal support – risk for possible inflection off this zone. From a trading standpoint, a good region to reduce short-positioning / lower protective stops- rallies should be limited to 1.2397 IF price is heading lower on this stretch with a close below 1.2084 needed to mark downtrend resumption.
Keep in mind we get the release of US & UK retail sales data the close of the week with key UK employment data and the inauguration of President Trump on tap early next week. Stay nimble into the release and watch the weekly closes here for guidance. Review my latest British Pound Short-term Outlook for a closer look at the near-term GBP/USD technical trade levels.

Economic Calendar – latest economic developments and upcoming event risk.
— Written by Michael Boutros, Sr Technical Strategist with FOREX.com
Follow Michael on X @MBForex
GBP/USD is edging higher after cooler-than-expected inflation helped pull gilt yields lower
UK CPI unexpectedly fell to 2.5% YoY in December, down from 2.6% and below forecasts of 2.7%. Meanwhile, service sector inflation, which the Bank of England is watching closely, cooled by more than expected to 4.4%, well below the 4.8% predicted and down from 5% in November. Sticky service sector inflation has hindered the BoE from cutting interest rates further.
Following the data the market has ramped up BoE rate cut expectations, adding 12 basis points to bets for 2025 cuts, which are now seen at 49 basis points across the year. This is still short of the central bank’s forecast for 4 rate cuts this year.
Usually, with rising rate cut expectations, the pound would fall. However, today’s data has also pulled guilty yields sharply lower, dropping by around 9 basis points on the 2-year bond, the most sensitive to Bank of England policy, which is helping to support the pound.
The data is a step in the right direction but it doesn’t mean that the UK is out of the woods just yet, particularly given that a recent survey by the British Retail Consortium shows that 2/3 of retailers will raise prices in response to higher employer Social Security costs from the budget which bodes poorly for progress in disinflation outlook. Meanwhile, the same survey of chief financial officers and finance directors at 52 major retailers found that around half plan to reduce staff hours and headcount.
There are also growing worries about UK growth, which has been on a downward trajectory since labour came to power in July. This, combined with the prospect of sticky inflation, means a stagflationary outlook is a very real problem. UK GDP data is due tomorrow and will provide further clues about the health of the UK economy.
Attention also turns to the US CPI, which is due later today and is expected to rise to 2.9% from 2.7%. What inflation could further dampen rate cut expectations, boosting the USD and pulling GBP USD lower?
GBP/USD trended lower from 1.34 to a low of 1.21 at the start of the week. The price recovered from 1.21 and trades back above the 1.22 level, bringing the RSI out of oversold territory. The long-term downtrend remains intact, but the hammer candlestick and the long lower wicks on candles this week suggest that the bottom could be in, and a bullish reversal could be in the cards.
Buyers will look to extend gains above 1.23, the April low, before focusing on 1.25, the December low into focus.
Sellers will need to take out the 1.21 low to extend losses to 1.2050, the 2023 low, and 1.20, the psychological level.

USD/JPY is falling amid a stronger yen following hawkish BoJ’s Ueda remarks. However, those gains could be short-lived ahead of US inflation data.
Governor Ueda reiterated the central bank’s commitment to raising borrowing costs if the economy continues to improve. His comments followed days of the OJ deputy governor him me know on Tuesday. The end raise as markets priced in the possibility of a rate hike at next weeks meeting.
Comments from Finance Minister Kato, who revived concerns about potential government intervention in the FX markets, also supported the yen.
Attention is now turning to US inflation data, which is expected to show that CPI increased 2.9% from 2.7% in November, marking its fifth straight monthly increase and moving further from the Fed’s 2% target.
Worries about hot inflation are already rampant in the market, with treasury yields elevated. I mean, the resilient U.S. economy and ahead of Trump’s administration. Trump is expected to implement inflationary policies.
Hotter-than-expected inflation could see the market further resist Fed rate cut bets. Currently, the market sees just one rate shot right at the end of this year. This could see USD/JPY recover higher above 158.
After a strong run-up from the 148.65 low, USD/JPY has been consolidating just below 158. The price is testing support at the 78.6% fib retracement at 157.10, as the MACD shows a bearish cross-over.
Should sellers meaningfully break below 157.10 and 156.75 the November high, a deeper selloff towards 155 round number and 152.40 the 61.8% fib level could be on the cards.
Should the 157.10-156.75 support zone hold, buyers will look to extend gains above 168.80, the 2025 high, towards 160 and 162, the 2024 high.

Spot Gold peaked at $2695.96 on Wednesday, helped by a bout of risk appetite. The upbeat sentiment was a combination of encouraging United States (US) earnings reports and the country’s Consumer Price Index (CPI) report. On the one hand, major US banks reported results that exceeded expectations. Goldman Sachs’ profits doubled in Q4, while JP Morgan announced that large asset and wealth management grew in the same period.
Inflation in the US, as measured by the change in the CPI rose 2.9% on a yearly basis in December from 2.7% in November, the US Bureau of Labor Statistics (BLS) reported, matching expectations. When compared to the previous month, the CPI was up 0.4%, after adding 0.3% in the previous month. The annual core CPI, which excludes volatile food and energy prices, rose 3.2%, below the expected 3.3%. The news sent stocks skyrocketing and bond yields lower as investors lifted bets on the Federal Reserve’s (Fed) upcoming rate cuts.
The macroeconomic calendar will have little to offer in the upcoming days, beyond US Retail Sales scheduled for Thursday. Sales are expected to have grown by 0.6% in December after adding 0.7% in November.
The daily chart for XAU/USD shows it trades around $2,690 maintaining the bullish tone, as it keeps developing above all its moving averages, although the 20 Simple Moving Average (SMA) and the 100 SMA converge around $2.635 with no directional strength, yet acting as dynamic support. At the same time, technical indicators head north within positive levels, reflecting buyers still hold the grip.
In the near term, and according to the 4-hour chart, Gold is neutral-to-bullish. The XAU/USD quickly recovered after a dip towards a flat 20 SMA, currently providing dynamic support at around $2,677. The longer moving averages post tepid advances below the shorter one. Technical indicators, in the meantime, lack directional strength, with the Momentum indicator stuck to its 100 level and the Relative Strength Index (RSI) indicator easing at around 60.
Support levels: 2,675.00 2,660.70 2,645.15
Resistance levels: 2,697.90 2,725.00 2,738.15



 Chart prepared by James Stanley,