The main category of Forex News.
You can use the search box below to find what you need.
[wd_asp id=1]
The main category of Forex News.
You can use the search box below to find what you need.
[wd_asp id=1]
The EUR/USD fell to a new multi-year low of just shy of 1.0200, before bouncing modestly off its earlier lows. The currency pair is now on track to drop for the fourth consecutive month. In the last 15 weeks, it has only managed two small positive weekly closes. The bearish momentum has been gathering pace, owing largely to a strengthening US dollar. Meanwhile, weak growth in the Eurozone and China have also weighed on the single currency, not to mentioned ongoing political turmoil in Germany and France. Against this backdrop, the EUR/USD forecast remains bearish, and we could see the pair drop below $1.02 handle in the early parts of the week ahead.
The greenback has been supported by investors repricing US interest rates higher due, first and foremost, to expectations of inflationary policies under Donald Trump, when he takes office later this month. At the same time, we have seen surprising strength in US data. This was again highlighted by the non-farm payrolls report on Friday, pointing to a labour market that appears to be gaining momentum again. Consequently, traders have now shifted the full pricing of the next Fed rate cut all the way to the start of Q4. Consequently, US bond yields have pushed further higher, with the benchmark 10-year now yielding 4.76% – and getting closer to last year’s high of 5.02% that was hit in October, just before the Fed pivoted. Due to this hawkish repricing of US interest rates, the EUR/USD forecast remains bearish as we look forward to another week of volatility. US CPI and Chinese GDP are among the data highlight to watch.

Source: TradingView.com
Well, it was almost extremely robust. While revisions shaved about 8K off the previous two months’ figures, the December payrolls report significantly outperformed expectations. Markets reacted swiftly: stock index futures sold off, and the dollar gained strength against all major currencies, except the yen. The unemployment rate also declined to 4.1% from 4.2%, bolstering the argument for an extended pause in policy changes from the Fed. Meanwhile, average earnings met expectations, rising 0.3% month-over-month and 3.9% year-over-year, slightly down from 4.0%. The combination of strong headline job gains and steady wage growth highlights a resilient labour market.
Should CPI inflation data on Wednesday show signs of persisting, any calls for a rate cut in the first half of the year will be firmly dismissed again. In any case, the upside potential for the EUR/USD is likely to be limited until something changes fundamentally. Thus, if CPI is to cause a shift in the market, it will have to be significantly weaker to cause a major dent in the dollar’s bullish trend or the EUR/USD’s bearish trend.
On Friday, we will have some important data from China. In addition to GDP figures, the day will bring the latest retail sales and industrial production data from the world’s second-largest economy. China’s gloomy economic outlook has driven a surge in demand for Chinese bonds, pushing down yields, local stock prices, and the yuan. It has also had a negative influence on the EUR/USD exchange rate. Stronger data will be crucial to alleviating concerns about a potential deflationary spiral in the Chinese economy. But if data reveals weakening growth, then this should further weigh on Chinese assets, and undermine the EUR/USD forecast.
— Written by Fawad Razaqzada, Market Analyst
Follow Fawad on Twitter @Trader_F_R
The EUR/USD fell to a new multi-year low of just shy of 1.0200, before bouncing modestly off its earlier lows. The currency pair is now on track to drop for the fourth consecutive month. In the last 15 weeks, it has only managed two small positive weekly closes. The bearish momentum has been gathering pace, owing largely to a strengthening US dollar. Meanwhile, weak growth in the Eurozone and China have also weighed on the single currency, not to mentioned ongoing political turmoil in Germany and France. Against this backdrop, the EUR/USD forecast remains bearish, and we could see the pair drop below $1.02 handle in the early parts of the week ahead.
The greenback has been supported by investors repricing US interest rates higher due, first and foremost, to expectations of inflationary policies under Donald Trump, when he takes office later this month. At the same time, we have seen surprising strength in US data. This was again highlighted by the non-farm payrolls report on Friday, pointing to a labour market that appears to be gaining momentum again. Consequently, traders have now shifted the full pricing of the next Fed rate cut all the way to the start of Q4. Consequently, US bond yields have pushed further higher, with the benchmark 10-year now yielding 4.76% – and getting closer to last year’s high of 5.02% that was hit in October, just before the Fed pivoted. Due to this hawkish repricing of US interest rates, the EUR/USD forecast remains bearish as we look forward to another week of volatility. US CPI and Chinese GDP are among the data highlight to watch.

Source: TradingView.com
Well, it was almost extremely robust. While revisions shaved about 8K off the previous two months’ figures, the December payrolls report significantly outperformed expectations. Markets reacted swiftly: stock index futures sold off, and the dollar gained strength against all major currencies, except the yen. The unemployment rate also declined to 4.1% from 4.2%, bolstering the argument for an extended pause in policy changes from the Fed. Meanwhile, average earnings met expectations, rising 0.3% month-over-month and 3.9% year-over-year, slightly down from 4.0%. The combination of strong headline job gains and steady wage growth highlights a resilient labour market.
Should CPI inflation data on Wednesday show signs of persisting, any calls for a rate cut in the first half of the year will be firmly dismissed again. In any case, the upside potential for the EUR/USD is likely to be limited until something changes fundamentally. Thus, if CPI is to cause a shift in the market, it will have to be significantly weaker to cause a major dent in the dollar’s bullish trend or the EUR/USD’s bearish trend.
On Friday, we will have some important data from China. In addition to GDP figures, the day will bring the latest retail sales and industrial production data from the world’s second-largest economy. China’s gloomy economic outlook has driven a surge in demand for Chinese bonds, pushing down yields, local stock prices, and the yuan. It has also had a negative influence on the EUR/USD exchange rate. Stronger data will be crucial to alleviating concerns about a potential deflationary spiral in the Chinese economy. But if data reveals weakening growth, then this should further weigh on Chinese assets, and undermine the EUR/USD forecast.
— Written by Fawad Razaqzada, Market Analyst
Follow Fawad on Twitter @Trader_F_R
Gold prices closed a fourth consecutive daily advance on Friday with the post-NFP rally posting a weekly advance of nearly 1.9%. A rebound off slope support is attempting to mark resumption of the broader uptrend with key resistance now in view. Battle lines drawn on the XAU/USD weekly technical chart.
Review my latest Weekly Strategy Webinar for an in-depth breakdown of this gold setup and more. Join live on Monday’s at 8:30am EST.
Chart Prepared by Michael Boutros, Sr. Technical Strategist; XAU/USD on TradingView
Technical Outlook: In my last Gold Weekly Price Forecast we noted that the XAU/USD was, “trading into a multi-year slope support into the start of the December and the focus is on a reaction off the median-line early in the month. From a trading standpoint, the focus remains on a breakout of the 2607-2736 range for near-term directional guidance.” A two-week advance has now rallied more than 4.4% off the December lows with a rebound off the median-line now threatening a stretch towards uptrend resistance.
The focus is on the record high-week close / 2024 high-close at 2736/47– a breach / close above this threshold is needed to mark uptrend resumption towards subsequent resistance objectives at the 2.618% extension of the 2022 range-break at 2804 and the 2900. The next major technical confluence is eyed at 3000/31– a region defined by the 2.272% extension of the 2011 decline and the 1.618% extension of the 2022 advance. Look for a larger reaction there IF reached.
Initial weekly support rests with the median-line and is backed closely by the 61.8% retracement at 2607– a break / weekly close below this threshold would suggest a larger correction is underway within the broader uptrend with initial support objectives seen at the August high at 2531 and 2450/82– a region defined by the April swing high and the 38.2% retracement of the 2024 trading range. We will reserve this threshold as our bullish invalidation level and losses would need to be limited to this slope for the late-2023 uptrend to remain viable.

Bottom line: Gold has rebounded off uptrend support into the start of the month with the advance now within striking distance of pivotal resistance. From a trading standpoint, look to reduce portions of long-exposure / raise protective stops on a stretch towards 2736- losses should be limited the median-line IF price is heading higher on this stretch with a breach above the high-close needed to mark uptrend resumption.
Keep in mind we get the release of key US inflation data next week with the Consumer Price Index (CPI) on tap Wednesday. Stay nimble into the release and watch the weekly closes here for guidance. Review my latest Gold Short-term Outlook for a closer look at the near-term XAU/USD technical trade levels.

Economic Calendar – latest economic developments and upcoming event risk.
— Written by Michael Boutros, Sr Technical Strategist with FOREX.com
Follow Michael on X @MBForex
It was a brutal week for the British Pound as the currency lost against all of the U.S. Dollar, the Euro and the Japanese Yen. In the major pair of GBP/USD, a fresh yearly low came into play as the final four days of the week produced a move that dropped by more than 380 pips, at one point. Perhaps more disconcerting for Sterling bulls is where the move took place, as a prior support at 1.2300 was taken-out before a bounce developed from 1.2250. But even that couldn’t last as the Friday NFP report helped to produce another downside thrust in the move until price breached the 1.2200 level.
At this point, there’s no sign yet of bears letting up and the next major level of contention below current price is the 1.2000 psychological level that hasn’t traded since early-2023.
 Chart prepared by James Stanley, GBP/USD on Tradingview
At this point the challenge on Cable is how established the move has become. As of this writing RSI is pushing back into oversold territory on the daily chart and this would be the first such occurrence of that since November. This, of course, does not preclude bearish continuation, but it does urge caution from chasing, and given prior short-term support structure, there are a few areas of note that bears can look to for lower-high resistance.
The psychological level of 1.2250 is of interest, after which the Fibonacci level I had looked at earlier in the week at 1.2297 comes into the picture. And above that is another Fibonacci level at 1.2367.
 Chart prepared by James Stanley, GBP/USD on Tradingview
GBP/JPY printed an evening star formation that confirmed on Wednesday, and that led to a strong sell-off on Thursday and Friday. But similarly, there were some items of note at key support zones last week. I had looked at the 193.61-194.11 zone in the Wednesday article as this is the bottom portion of a gap from back in 2008. That area led to a bounce on Thursday but sellers caught the break on Friday, making a strong push down to a fresh monthly low.
For next week, the focus is on deeper support, looking to the 190.81 Fibonacci level which is nearing confluence with a bullish trendline drawn from August and December swing-lows.
 Chart prepared by James Stanley, GBP/JPY on Tradingview
As of this writing EUR/GBP has gained 1.09% this week, which would stand as the largest weekly gain for the pair since January of 2023. The pair rallied up to the 23.6% retracement of the two-year-move, and this follows almost two months of stalling after sellers were unable to elicit any significant bearish continuation below .8260.
 Chart prepared by James Stanley, EUR/GBP on Tradingview
Given the breakout to a fresh two-month high, the next natural question is whether a bullish trend can follow Given prior price structure, there’s now support potential around prior resistance, and I’m tracking this from around .8311 up to .8328. And for next resistance, there’s a prior swing-high at .8448 before the psychological level of .8500 would come back into play.
 Chart prepared by James Stanley, EUR/GBP on Tradingview
— written by James Stanley, Senior Strategist
It was a brutal week for the British Pound as the currency lost against all of the U.S. Dollar, the Euro and the Japanese Yen. In the major pair of GBP/USD, a fresh yearly low came into play as the final four days of the week produced a move that dropped by more than 380 pips, at one point. Perhaps more disconcerting for Sterling bulls is where the move took place, as a prior support at 1.2300 was taken-out before a bounce developed from 1.2250. But even that couldn’t last as the Friday NFP report helped to produce another downside thrust in the move until price breached the 1.2200 level.
At this point, there’s no sign yet of bears letting up and the next major level of contention below current price is the 1.2000 psychological level that hasn’t traded since early-2023.
 Chart prepared by James Stanley, GBP/USD on Tradingview
At this point the challenge on Cable is how established the move has become. As of this writing RSI is pushing back into oversold territory on the daily chart and this would be the first such occurrence of that since November. This, of course, does not preclude bearish continuation, but it does urge caution from chasing, and given prior short-term support structure, there are a few areas of note that bears can look to for lower-high resistance.
The psychological level of 1.2250 is of interest, after which the Fibonacci level I had looked at earlier in the week at 1.2297 comes into the picture. And above that is another Fibonacci level at 1.2367.
 Chart prepared by James Stanley, GBP/USD on Tradingview
GBP/JPY printed an evening star formation that confirmed on Wednesday, and that led to a strong sell-off on Thursday and Friday. But similarly, there were some items of note at key support zones last week. I had looked at the 193.61-194.11 zone in the Wednesday article as this is the bottom portion of a gap from back in 2008. That area led to a bounce on Thursday but sellers caught the break on Friday, making a strong push down to a fresh monthly low.
For next week, the focus is on deeper support, looking to the 190.81 Fibonacci level which is nearing confluence with a bullish trendline drawn from August and December swing-lows.
 Chart prepared by James Stanley, GBP/JPY on Tradingview
As of this writing EUR/GBP has gained 1.09% this week, which would stand as the largest weekly gain for the pair since January of 2023. The pair rallied up to the 23.6% retracement of the two-year-move, and this follows almost two months of stalling after sellers were unable to elicit any significant bearish continuation below .8260.
 Chart prepared by James Stanley, EUR/GBP on Tradingview
Given the breakout to a fresh two-month high, the next natural question is whether a bullish trend can follow Given prior price structure, there’s now support potential around prior resistance, and I’m tracking this from around .8311 up to .8328. And for next resistance, there’s a prior swing-high at .8448 before the psychological level of .8500 would come back into play.
 Chart prepared by James Stanley, EUR/GBP on Tradingview
— written by James Stanley, Senior Strategist
Gold prices closed a fourth consecutive daily advance on Friday with the post-NFP rally posting a weekly advance of nearly 1.9%. A rebound off slope support is attempting to mark resumption of the broader uptrend with key resistance now in view. Battle lines drawn on the XAU/USD weekly technical chart.
Review my latest Weekly Strategy Webinar for an in-depth breakdown of this gold setup and more. Join live on Monday’s at 8:30am EST.
Chart Prepared by Michael Boutros, Sr. Technical Strategist; XAU/USD on TradingView
Technical Outlook: In my last Gold Weekly Price Forecast we noted that the XAU/USD was, “trading into a multi-year slope support into the start of the December and the focus is on a reaction off the median-line early in the month. From a trading standpoint, the focus remains on a breakout of the 2607-2736 range for near-term directional guidance.” A two-week advance has now rallied more than 4.4% off the December lows with a rebound off the median-line now threatening a stretch towards uptrend resistance.
The focus is on the record high-week close / 2024 high-close at 2736/47– a breach / close above this threshold is needed to mark uptrend resumption towards subsequent resistance objectives at the 2.618% extension of the 2022 range-break at 2804 and the 2900. The next major technical confluence is eyed at 3000/31– a region defined by the 2.272% extension of the 2011 decline and the 1.618% extension of the 2022 advance. Look for a larger reaction there IF reached.
Initial weekly support rests with the median-line and is backed closely by the 61.8% retracement at 2607– a break / weekly close below this threshold would suggest a larger correction is underway within the broader uptrend with initial support objectives seen at the August high at 2531 and 2450/82– a region defined by the April swing high and the 38.2% retracement of the 2024 trading range. We will reserve this threshold as our bullish invalidation level and losses would need to be limited to this slope for the late-2023 uptrend to remain viable.

Bottom line: Gold has rebounded off uptrend support into the start of the month with the advance now within striking distance of pivotal resistance. From a trading standpoint, look to reduce portions of long-exposure / raise protective stops on a stretch towards 2736- losses should be limited the median-line IF price is heading higher on this stretch with a breach above the high-close needed to mark uptrend resumption.
Keep in mind we get the release of key US inflation data next week with the Consumer Price Index (CPI) on tap Wednesday. Stay nimble into the release and watch the weekly closes here for guidance. Review my latest Gold Short-term Outlook for a closer look at the near-term XAU/USD technical trade levels.

Economic Calendar – latest economic developments and upcoming event risk.
— Written by Michael Boutros, Sr Technical Strategist with FOREX.com
Follow Michael on X @MBForex
Gold prices closed a fourth consecutive daily advance on Friday with the post-NFP rally posting a weekly advance of nearly 1.9%. A rebound off slope support is attempting to mark resumption of the broader uptrend with key resistance now in view. Battle lines drawn on the XAU/USD weekly technical chart.
Review my latest Weekly Strategy Webinar for an in-depth breakdown of this gold setup and more. Join live on Monday’s at 8:30am EST.
Chart Prepared by Michael Boutros, Sr. Technical Strategist; XAU/USD on TradingView
Technical Outlook: In my last Gold Weekly Price Forecast we noted that the XAU/USD was, “trading into a multi-year slope support into the start of the December and the focus is on a reaction off the median-line early in the month. From a trading standpoint, the focus remains on a breakout of the 2607-2736 range for near-term directional guidance.” A two-week advance has now rallied more than 4.4% off the December lows with a rebound off the median-line now threatening a stretch towards uptrend resistance.
The focus is on the record high-week close / 2024 high-close at 2736/47– a breach / close above this threshold is needed to mark uptrend resumption towards subsequent resistance objectives at the 2.618% extension of the 2022 range-break at 2804 and the 2900. The next major technical confluence is eyed at 3000/31– a region defined by the 2.272% extension of the 2011 decline and the 1.618% extension of the 2022 advance. Look for a larger reaction there IF reached.
Initial weekly support rests with the median-line and is backed closely by the 61.8% retracement at 2607– a break / weekly close below this threshold would suggest a larger correction is underway within the broader uptrend with initial support objectives seen at the August high at 2531 and 2450/82– a region defined by the April swing high and the 38.2% retracement of the 2024 trading range. We will reserve this threshold as our bullish invalidation level and losses would need to be limited to this slope for the late-2023 uptrend to remain viable.

Bottom line: Gold has rebounded off uptrend support into the start of the month with the advance now within striking distance of pivotal resistance. From a trading standpoint, look to reduce portions of long-exposure / raise protective stops on a stretch towards 2736- losses should be limited the median-line IF price is heading higher on this stretch with a breach above the high-close needed to mark uptrend resumption.
Keep in mind we get the release of key US inflation data next week with the Consumer Price Index (CPI) on tap Wednesday. Stay nimble into the release and watch the weekly closes here for guidance. Review my latest Gold Short-term Outlook for a closer look at the near-term XAU/USD technical trade levels.

Economic Calendar – latest economic developments and upcoming event risk.
— Written by Michael Boutros, Sr Technical Strategist with FOREX.com
Follow Michael on X @MBForex
The GBP/USD weekly forecast suggests further weakness as the US dollar picks momentum after robust jobs data.
The GBP/USD pair had a bearish week as the dollar rallied amid upbeat US economic data. Figures revealed that business activity in the services sector improved more than expected. Meanwhile, employment numbers were mostly better than expected.
-Are you looking for tips for forex trading? Check out the details-
Notably, the nonfarm payrolls report on Friday showed an unexpected surge in job growth and a drop in the unemployment rate. The US economy added 256,000 jobs in December, compared to forecasts of 164,000. Meanwhile, unemployment dropped to 4.1%, below estimates of 4.2%. Consequently, Fed rate cut bets plunged, boosting the dollar.
Next week, market participants will focus on inflation and retail sales data from the US and the UK. At the same time, the UK will release figures on manufacturing production and GDP. The US wholesale and consumer inflation numbers will shape the outlook for future Fed rate cuts. Recent reports have shown that inflation has paused its decline to the 2% target. Another upbeat report will lower expectations for rate cuts, boosting the greenback.
Similarly, UK inflation and retail sales will guide the outlook for Bank of England rate cuts. Upbeat reports will lower bets for rate cuts, while downbeat numbers will further hurt the pound.
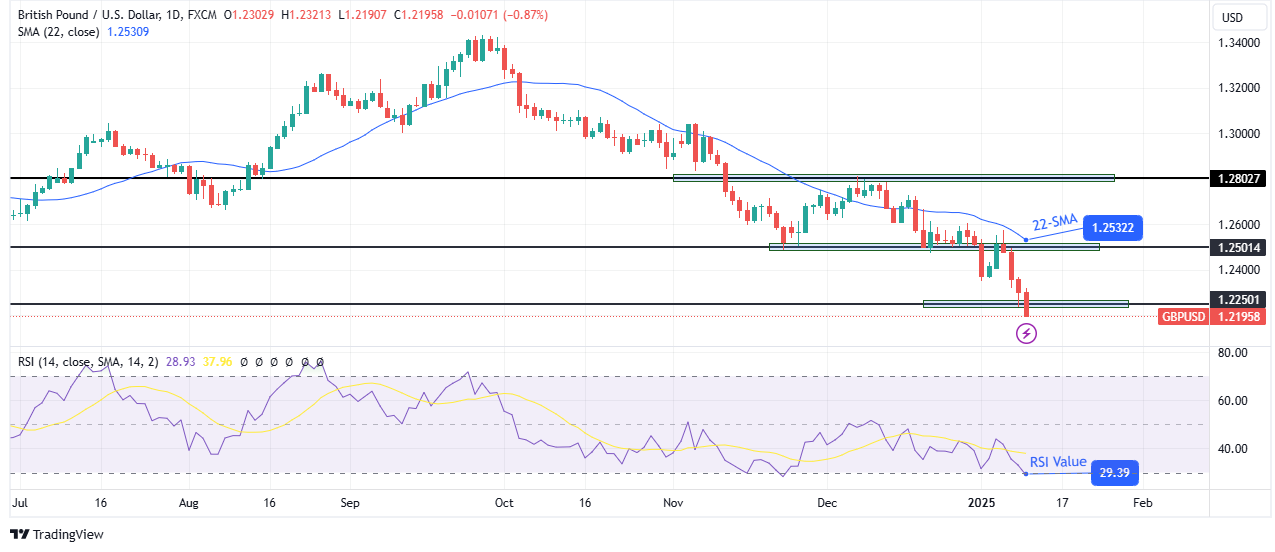
On the technical side, the GBP/USD price has punctured the 1.2250 support level to make a new swing low in the downtrend. The price trades well below the 22-SMA, showing bears are holding the reigns. Meanwhile, the RSI has entered the oversold region, suggesting solid bearish momentum.
-Are you looking for automated trading? Check our detailed guide-
GBP/USD has maintained a solid downtrend since the price broke below the 22-SMA. In all this time, the RSI has stayed in bearish territory but has failed to dip into the oversold region. This shows that bears still have more room to push the prices lower. Therefore, the break below the 1.2250 support will allow the price to reach lower support levels.
Moreover, the trend will only reverse if the RSI shows fading momentum and the price breaks above the 22-SMA.
Looking to trade forex now? Invest at eToro!
67% of retail investor accounts lose money when trading CFDs with this provider. You should consider whether you can afford to take the high risk of losing your money.
Gold prices closed a fourth consecutive daily advance on Friday with the post-NFP rally posting a weekly advance of nearly 1.9%. A rebound off slope support is attempting to mark resumption of the broader uptrend with key resistance now in view. Battle lines drawn on the XAU/USD weekly technical chart.
Review my latest Weekly Strategy Webinar for an in-depth breakdown of this gold setup and more. Join live on Monday’s at 8:30am EST.
Chart Prepared by Michael Boutros, Sr. Technical Strategist; XAU/USD on TradingView
Technical Outlook: In my last Gold Weekly Price Forecast we noted that the XAU/USD was, “trading into a multi-year slope support into the start of the December and the focus is on a reaction off the median-line early in the month. From a trading standpoint, the focus remains on a breakout of the 2607-2736 range for near-term directional guidance.” A two-week advance has now rallied more than 4.4% off the December lows with a rebound off the median-line now threatening a stretch towards uptrend resistance.
The focus is on the record high-week close / 2024 high-close at 2736/47– a breach / close above this threshold is needed to mark uptrend resumption towards subsequent resistance objectives at the 2.618% extension of the 2022 range-break at 2804 and the 2900. The next major technical confluence is eyed at 3000/31– a region defined by the 2.272% extension of the 2011 decline and the 1.618% extension of the 2022 advance. Look for a larger reaction there IF reached.
Initial weekly support rests with the median-line and is backed closely by the 61.8% retracement at 2607– a break / weekly close below this threshold would suggest a larger correction is underway within the broader uptrend with initial support objectives seen at the August high at 2531 and 2450/82– a region defined by the April swing high and the 38.2% retracement of the 2024 trading range. We will reserve this threshold as our bullish invalidation level and losses would need to be limited to this slope for the late-2023 uptrend to remain viable.

Bottom line: Gold has rebounded off uptrend support into the start of the month with the advance now within striking distance of pivotal resistance. From a trading standpoint, look to reduce portions of long-exposure / raise protective stops on a stretch towards 2736- losses should be limited the median-line IF price is heading higher on this stretch with a breach above the high-close needed to mark uptrend resumption.
Keep in mind we get the release of key US inflation data next week with the Consumer Price Index (CPI) on tap Wednesday. Stay nimble into the release and watch the weekly closes here for guidance. Review my latest Gold Short-term Outlook for a closer look at the near-term XAU/USD technical trade levels.

Economic Calendar – latest economic developments and upcoming event risk.
— Written by Michael Boutros, Sr Technical Strategist with FOREX.com
Follow Michael on X @MBForex
Silver Price rises for the seven straight day putting aside the jump in US Treasury bond yields and the US Dollar, after a strong US jobs report calmed Federal Reserve officials about the employment situation in the US. Nevertheless, the evolution on inflation seems to be stalled, gathering some attention of Fed oficials. The XAG/USD trades at $30.35 up over 0.80%.
Silver continues to trend higher, advancing steadily above the $30.00 figure for the latest fhree trading days, boosted by buyers emerging at crucial support found at the 200-day Simple Moving Average (SMA) at $29.93. However, they are struggling with stir resistance at the 50-day SMA at $30.42, which has kept prices from reaching the 100-day SMA at $30.80.
If bulls clear those levels, that will clear the path to challenge $31.00 and expose the next cycle high seen at $32.32, December’s 12 peak.
Conversely, if XAG/USD slides beneath $30.00, the 200-day SMA emerges as bulls’ first line of defense. A breach of that level, could drive Silver’s price towards the January 6 low of $29.41, ahead of the December 31 low of $28.78.
Silver is a precious metal highly traded among investors. It has been historically used as a store of value and a medium of exchange. Although less popular than Gold, traders may turn to Silver to diversify their investment portfolio, for its intrinsic value or as a potential hedge during high-inflation periods. Investors can buy physical Silver, in coins or in bars, or trade it through vehicles such as Exchange Traded Funds, which track its price on international markets.
Silver prices can move due to a wide range of factors. Geopolitical instability or fears of a deep recession can make Silver price escalate due to its safe-haven status, although to a lesser extent than Gold’s. As a yieldless asset, Silver tends to rise with lower interest rates. Its moves also depend on how the US Dollar (USD) behaves as the asset is priced in dollars (XAG/USD). A strong Dollar tends to keep the price of Silver at bay, whereas a weaker Dollar is likely to propel prices up. Other factors such as investment demand, mining supply – Silver is much more abundant than Gold – and recycling rates can also affect prices.
Silver is widely used in industry, particularly in sectors such as electronics or solar energy, as it has one of the highest electric conductivity of all metals – more than Copper and Gold. A surge in demand can increase prices, while a decline tends to lower them. Dynamics in the US, Chinese and Indian economies can also contribute to price swings: for the US and particularly China, their big industrial sectors use Silver in various processes; in India, consumers’ demand for the precious metal for jewellery also plays a key role in setting prices.
Silver prices tend to follow Gold’s moves. When Gold prices rise, Silver typically follows suit, as their status as safe-haven assets is similar. The Gold/Silver ratio, which shows the number of ounces of Silver needed to equal the value of one ounce of Gold, may help to determine the relative valuation between both metals. Some investors may consider a high ratio as an indicator that Silver is undervalued, or Gold is overvalued. On the contrary, a low ratio might suggest that Gold is undervalued relative to Silver.
