The main category of Forex News.
You can use the search box below to find what you need.
[wd_asp id=1]
The main category of Forex News.
You can use the search box below to find what you need.
[wd_asp id=1]
Silver Price rises for the seven straight day putting aside the jump in US Treasury bond yields and the US Dollar, after a strong US jobs report calmed Federal Reserve officials about the employment situation in the US. Nevertheless, the evolution on inflation seems to be stalled, gathering some attention of Fed oficials. The XAG/USD trades at $30.35 up over 0.80%.
Silver continues to trend higher, advancing steadily above the $30.00 figure for the latest fhree trading days, boosted by buyers emerging at crucial support found at the 200-day Simple Moving Average (SMA) at $29.93. However, they are struggling with stir resistance at the 50-day SMA at $30.42, which has kept prices from reaching the 100-day SMA at $30.80.
If bulls clear those levels, that will clear the path to challenge $31.00 and expose the next cycle high seen at $32.32, December’s 12 peak.
Conversely, if XAG/USD slides beneath $30.00, the 200-day SMA emerges as bulls’ first line of defense. A breach of that level, could drive Silver’s price towards the January 6 low of $29.41, ahead of the December 31 low of $28.78.
Silver is a precious metal highly traded among investors. It has been historically used as a store of value and a medium of exchange. Although less popular than Gold, traders may turn to Silver to diversify their investment portfolio, for its intrinsic value or as a potential hedge during high-inflation periods. Investors can buy physical Silver, in coins or in bars, or trade it through vehicles such as Exchange Traded Funds, which track its price on international markets.
Silver prices can move due to a wide range of factors. Geopolitical instability or fears of a deep recession can make Silver price escalate due to its safe-haven status, although to a lesser extent than Gold’s. As a yieldless asset, Silver tends to rise with lower interest rates. Its moves also depend on how the US Dollar (USD) behaves as the asset is priced in dollars (XAG/USD). A strong Dollar tends to keep the price of Silver at bay, whereas a weaker Dollar is likely to propel prices up. Other factors such as investment demand, mining supply – Silver is much more abundant than Gold – and recycling rates can also affect prices.
Silver is widely used in industry, particularly in sectors such as electronics or solar energy, as it has one of the highest electric conductivity of all metals – more than Copper and Gold. A surge in demand can increase prices, while a decline tends to lower them. Dynamics in the US, Chinese and Indian economies can also contribute to price swings: for the US and particularly China, their big industrial sectors use Silver in various processes; in India, consumers’ demand for the precious metal for jewellery also plays a key role in setting prices.
Silver prices tend to follow Gold’s moves. When Gold prices rise, Silver typically follows suit, as their status as safe-haven assets is similar. The Gold/Silver ratio, which shows the number of ounces of Silver needed to equal the value of one ounce of Gold, may help to determine the relative valuation between both metals. Some investors may consider a high ratio as an indicator that Silver is undervalued, or Gold is overvalued. On the contrary, a low ratio might suggest that Gold is undervalued relative to Silver.
Nevertheless, the current rally is occurring inside last week’s price range. It shows a long red candle with a weak close near the lows of the week. This week’s bullish price action counters some of last week’s bearish price action and shows strength. But since an inside week is a form of consolidation on that time scale, trading could proceed in a choppy fashion for a while longer. At least that seems to be a risk. A new weekly high closing price this week will go a long way towards further confirming bullish daily signals.
The price structure of higher swing highs and higher swing lows remains intact for the bull trend. Recent bullish signals indicate a possible challenge to resistance around the current trend high of 4.20. If upward momentum can be maintained, then the 4.20 high could be exceeded. A rising parallel trend channel defines the vibration of price in the larger bull trend that began from the 2024 low of 1.55.
The current shorter-term uptrend, that began from the October swing low, defines a smaller internal trend within a large uptrend price pattern. Since support was successfully tested around the internal uptrend line and 20-Day MA, the road may be clear for the larger bullish pattern to exert its influence. However, gold could go to a new trend high yet still find resistance around the top channel line.
In the big picture, gold triggered another bullish reversal of the long-term downtrend on a rally above the October 2023 swing high of 3.64 recently. That breakout followed an earlier bull breakout of a large symmetrical triangle pattern. So, the current short-term advance is supported by the larger bullish price patterns.
For a look at all of today’s economic events, check out our economic calendar.
The Pound Sterling (GBP) resumed its bearish momentum against the US Dollar (USD), pushing GBP/USD to the lowest level in 14 months below 1.2200.
Nothing could stop Pound Sterling sellers as the GBP/USD pair faced a double whammy in the first full week of 2025. The week began on an upbeat note as risk appetite returned on China’s stimulus optimism and strong Caixin Services PMI data. The People’s Bank of China (PBOC) pledged over the weekend that it will step up financial support for technology innovation and consumption stimulation as part of a continued effort to boost economic growth, per Bloomberg.
Positive risk sentiment weighed on the safe-haven USD, while helping the higher-yielding British Pound extend its previous week’s late rebound. However, the tide turned against the pair as inflation fears resurfaced on increased concerns over the potential impact of US President-elect Donald Trump’s immigration and trade policies, reviving the safe-haven demand for the US Dollar.
Expectations of fewer interest rate cuts by the US Federal Reserve (Fed) this year, fanned by encouraging US Job Openings and Labor Turnover Survey and ISM Manufacturing and Services PMI data, drove US Treasury bond yields higher across the curve, adding to the upside in the Greenback.
The decline in the GBP/USD pair gathered traction midweek after the Pound Sterling came under intense pressure due to a sharp sell-off in the British government bond market, fuelled by investors’ anxiety about UK assets and the economic outlook.
The bond market rout extended on Thursday, with the yield on benchmark 10-year UK Gilts rising by as much as 0.12 percentage points to 4.921%, the highest since 2008. This smashed the pair to its lowest level since November 2023 at 1.2239 before it recovered some ground to near 1.2300.
GBP/USD licked its wound near multi-month troughs heading into Friday’s US Nonfarm Payrolls (NFP) data release. Investors remained wary of the sell-off in the global bond market and growing Chinese economic worries.
In the American session on Friday, the USD gathered strength against its rivals after the December jobs report showed that NFP rose by 256,000, beating the market expectation of 160,000 by a wide margin. Additionally, the Unemployment Rate edged lower to 4.1%, while the Labor Force Participation Rate remained unchanged at 62.5%. Pressured by the USD rally, GBP/USD declined sharply with the immediate reaction and declined below 1.2200.
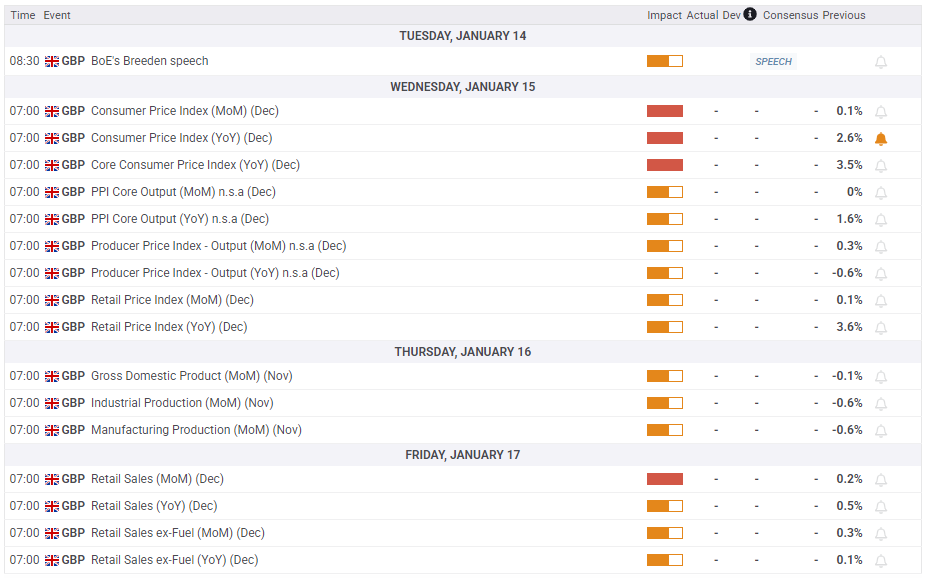
After a week dominated by US economic events, attention also turns to the UK macro data amid a quiet start to a busy week.
The early part of the week lacks any top-tier UK data releases but the Producer Price Index (PPI) data from the US will grab some eyeballs on Tuesday.
The high-impact Consumer Price Index (CPI) inflation data from both sides of the Atlantic will stand out on Wednesday.
The UK monthly Gross Domestic Product (GDP) report and Industrial Production will be published on Thursday ahead of the US Retail Sales and Jobless Claims data.
Friday will feature the Chinese fourth-quarter GDP and December activity data, which could significantly impact risk sentiment and higher-yielding assets such as the British Pound.
The UK Retail Sales and the mid-tier US housing data will be published on the same day.
Apart from the data publication and speeches from Fed policymakers, Trump’s policy speculations and geopolitical developments will also emerge as potential market drivers.
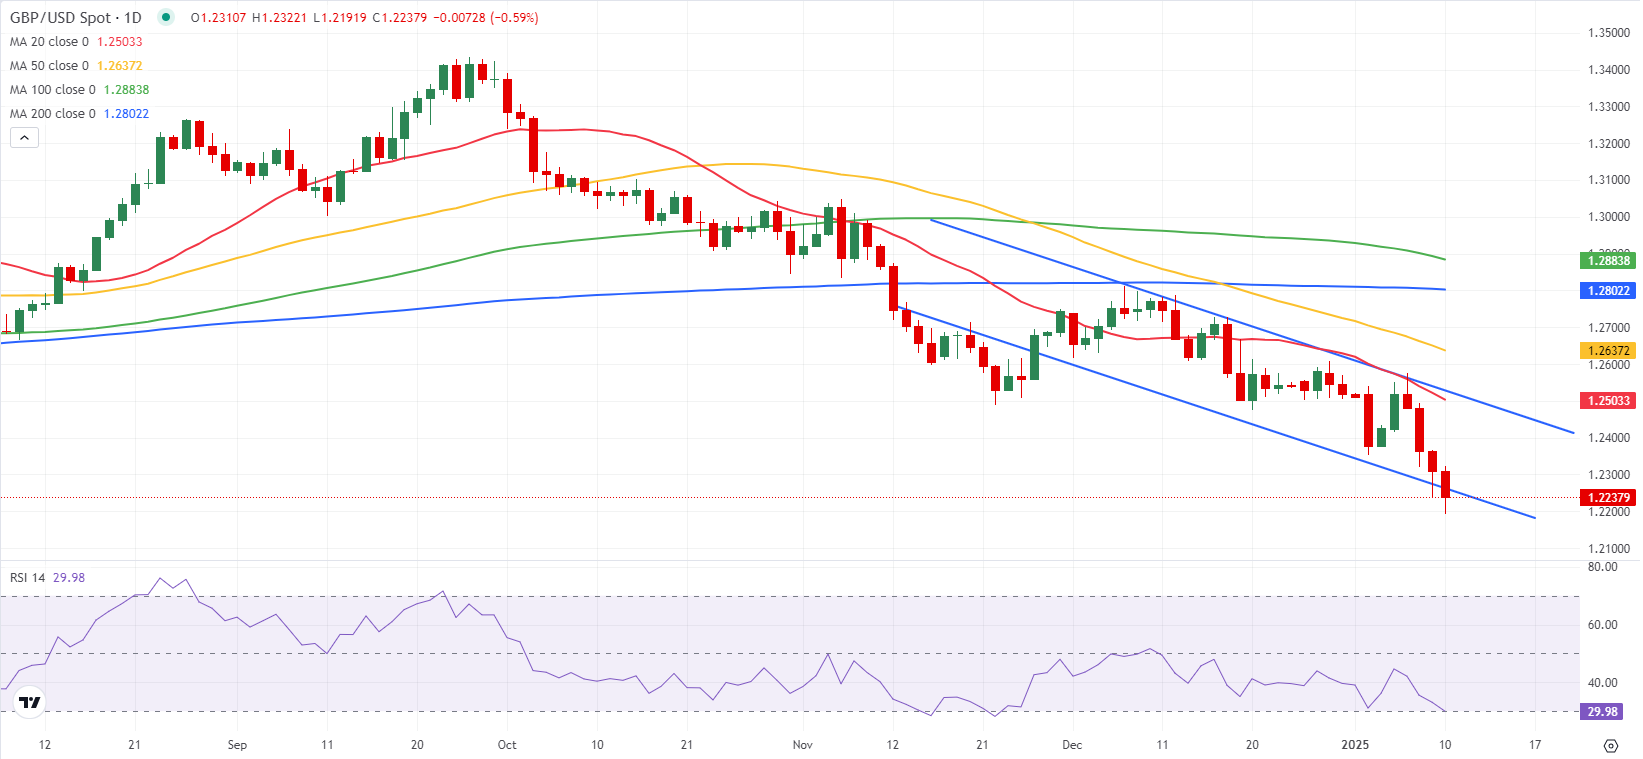
GBP/USD confirmed a downside break from the six-week-long falling wedge formation after closing Thursday below the lower boundary of the wedge at 1.2330.
The 14-day Relative Strength Index (RSI) languishes in negative territory near 30, indicating more scope for the downside.
Further, the 50-day Simple Moving Average (SMA) and the 200-day SMA Death Cross, confirmed last month, remains in play and acts as a headwind to the pair.
If sellers flex their muscles and keep the pair below the previous 14-month low of 1.2239, the next downside target is November 10 2023 low of 1.2187.
Further south, the 1.2100 demand area could offer some respite to buyers. If that support caves in, the 1.2050 psychological level will be tested.
Conversely, any recovery will need acceptance above 1.2511 to sustain. That level is the confluence of the 21-day SMA and the upper boundary of the wedge.
The pair will then challenge the 50-day SMA at 1.2639 toward the 200-day SMA at 1.2803.
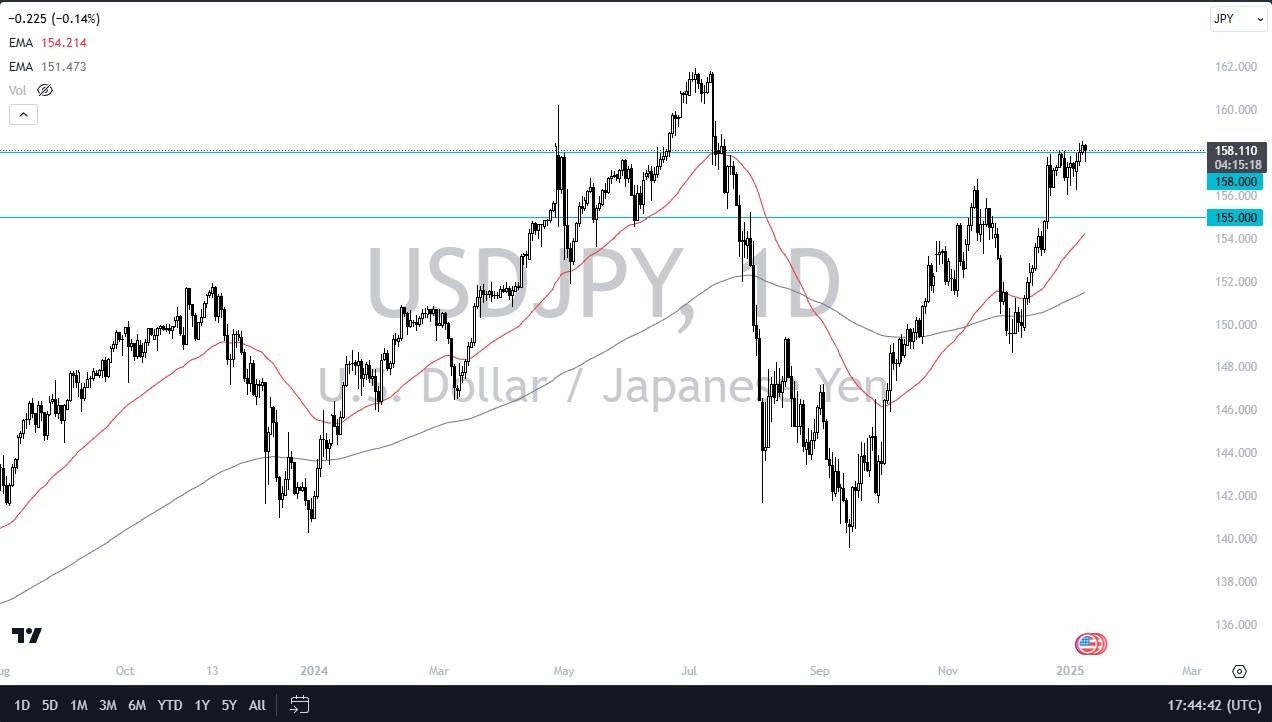
So, it makes sense as you will see traders hang on and get paid at the end of every day just to simply hold on to this USD/JPY pair. Furthermore, with the jobs number coming out on Friday, that could add more fuel to the fire, mainly due to the idea that perhaps the job market in America is still rather strong and if that’s the case then inflation is going nowhere and then by extension the federal reserve isn’t going to be cutting anytime soon. With this being said I think you’ve got a situation where people will continue to see a lot of noisy behavior but even if we were to pull back on Friday it would take something pretty drastic for me to believe that the uptrend is over. I think it would just be a simple hiccup along the way, and you could pick up cheap US dollars in that environment.

The 158 yen level has been important, but I think there’s also the 156 yen level as a floor and then again, the 155 yen level. Both of these could be areas where buyers come in. If the US dollar breaks out and clears the 159 yen level than 160 yen followed by 162 yen will be targeted. There really isn’t much the Bank of Japan can do other than try to bluff the market, which only works so long. So, I remain bullish of this market.
Want to trade USD/JPY forex analysis and predictions? Here’s a list of forex brokers in Japan to check out.
Silver price (XAG/USD) gains to near $31.30 in Friday’s European session. The white metal gains ahead of the United States (US) Nonfarm Payroll (NFP) data for December, which will be published at 13:30 GMT. The labor market data will influence market expectations about whether the Federal Reserve (Fed) will continue with its cautious stance on further policy-easing.
The NFP report is expected to show that the US economy added fresh 160K workers in December, lower than 227K in November. The Unemployment Rate is estimated to have remained steady at 4.2%.
Investors will also pay close attention to the Average Hourly Earnings data for December. Being a wage growth measure that drives consumer spending, the Average Hourly Earnings data will provide cues about the inflation outlook. Month-on-month Average Hourly Earnings is expected to have risen at a slower pace of 0.3% from the former release of 0.4%, with annual figures growing steadily by 4%.
The Federal Open Market Committee (FOMC) minutes for the December policy meeting showed that officials were worried about a slowdown in the progress in inflation towards the Fed’s target of 2%.
Broadly, the Silver price has performed strongly for more than a week as market sentiment remains cautious due to uncertainty over the likely global trade war. Investors remain cautious due to incoming protectionist policies from President-elect Donald Trump, which are expected to promote the business outlook of the US. Historically, Silver performs better in a heightened uncertain environment.
Ahead of the US NFP report, the US Dollar Index (DXY), which gauges Greenback’s value against six major currencies, flattens around 109.15. 10-year US Treasury yields rise to near 4.7%.
Silver price continues to face selling pressure near the upward-sloping trendline around $30.50, which is plotted from the February 29 low of $22.30 on a daily timeframe. The white metal oscillates around the 20-day Exponential Moving Average (EMA), which trades near $30.00.
The 14-day Relative Strength Index (RSI) moves higher above 50.00. A fresh bullish momentum would come into action if it decisively breaks above 60.00.
Looking down, the September low of $27.75 would act as key support for the Silver price. On the upside, the December 12 high of $32.33 would be the barrier.
Silver is a precious metal highly traded among investors. It has been historically used as a store of value and a medium of exchange. Although less popular than Gold, traders may turn to Silver to diversify their investment portfolio, for its intrinsic value or as a potential hedge during high-inflation periods. Investors can buy physical Silver, in coins or in bars, or trade it through vehicles such as Exchange Traded Funds, which track its price on international markets.
Silver prices can move due to a wide range of factors. Geopolitical instability or fears of a deep recession can make Silver price escalate due to its safe-haven status, although to a lesser extent than Gold’s. As a yieldless asset, Silver tends to rise with lower interest rates. Its moves also depend on how the US Dollar (USD) behaves as the asset is priced in dollars (XAG/USD). A strong Dollar tends to keep the price of Silver at bay, whereas a weaker Dollar is likely to propel prices up. Other factors such as investment demand, mining supply – Silver is much more abundant than Gold – and recycling rates can also affect prices.
Silver is widely used in industry, particularly in sectors such as electronics or solar energy, as it has one of the highest electric conductivity of all metals – more than Copper and Gold. A surge in demand can increase prices, while a decline tends to lower them. Dynamics in the US, Chinese and Indian economies can also contribute to price swings: for the US and particularly China, their big industrial sectors use Silver in various processes; in India, consumers’ demand for the precious metal for jewellery also plays a key role in setting prices.
Silver prices tend to follow Gold’s moves. When Gold prices rise, Silver typically follows suit, as their status as safe-haven assets is similar. The Gold/Silver ratio, which shows the number of ounces of Silver needed to equal the value of one ounce of Gold, may help to determine the relative valuation between both metals. Some investors may consider a high ratio as an indicator that Silver is undervalued, or Gold is overvalued. On the contrary, a low ratio might suggest that Gold is undervalued relative to Silver.
After dipping to its weakest level since November 2023 below 1.2250 in the European session on Thursday, GBP/USD erased a portion of its losses in the second half of the day. The pair trades in a narrow channel at around 1.2300 on Friday as investors keep a close eye on the action in the UK gilt markets while waiting for December labor market data from the US.
The table below shows the percentage change of British Pound (GBP) against listed major currencies this week. British Pound was the weakest against the Canadian Dollar.
| USD | EUR | GBP | JPY | CAD | AUD | NZD | CHF | |
|---|---|---|---|---|---|---|---|---|
| USD | 0.07% | 1.12% | 0.44% | -0.28% | 0.50% | 0.63% | 0.32% | |
| EUR | -0.07% | 1.04% | 0.33% | -0.29% | 0.48% | 0.60% | 0.29% | |
| GBP | -1.12% | -1.04% | -0.70% | -1.31% | -0.56% | -0.43% | -0.75% | |
| JPY | -0.44% | -0.33% | 0.70% | -0.68% | 0.11% | 0.26% | 0.13% | |
| CAD | 0.28% | 0.29% | 1.31% | 0.68% | 0.71% | 0.86% | 0.57% | |
| AUD | -0.50% | -0.48% | 0.56% | -0.11% | -0.71% | 0.12% | -0.19% | |
| NZD | -0.63% | -0.60% | 0.43% | -0.26% | -0.86% | -0.12% | -0.31% | |
| CHF | -0.32% | -0.29% | 0.75% | -0.13% | -0.57% | 0.19% | 0.31% |
The heat map shows percentage changes of major currencies against each other. The base currency is picked from the left column, while the quote currency is picked from the top row. For example, if you pick the British Pound from the left column and move along the horizontal line to the US Dollar, the percentage change displayed in the box will represent GBP (base)/USD (quote).
The selloff in the UK gilts continued early Thursday, causing Pound Sterling to weaken against its major rivals. In the European morning on Friday, the yield on the 10-year UK gilt stays in positive territory at around 4.85%. Another leg higher in this yield could trigger a new bout of selloff in GBP. On the other hand, a downward correction could help GBP/USD hold its ground.
The US Bureau of Labor Statistics will publish the December employment data in the early American session on Friday. The market expectation is for Nonfarm Payrolls to rise by 160,000 following the 227,000 increase reported in November. In the same period, the Unemployment Rate is seen holding steady at 4.2%.
A positive surprise in NFP, with a reading above 200,000, could help the USD gather strength and force GBP/USD to stay on the back foot heading into the weekend. On the flip side, the USD could come under pressure if the NFP arrives below 150,000. In this scenario, GBP/USD could stage a rebound later in the American session. Investors, however, could refrain from betting on a steady recovery until the UK gilt market settles down.
The Relative Strength Index (RSI) indicator on the 4-hour chart stays well below 40 and GBP/USD remains in the lower half of the one-month-old descending regression channel, highlighting the bearish bias.
On the downside, first support is located at 1.2250 (lower limit of the descending channel) before 1.2200 (static level, round level) and 1.2140 (static level from November 2023). Looking north, first resistance could be spotted at 1.2360 (mid-point of the descending channel) ahead of 1.2400 (round level, static level) and 1.2440 (50-period Simple Moving Average).
UK Gilt Yields measure the annual return an investor can expect from holding UK government bonds, or Gilts. Like other bonds, Gilts pay interest to holders at regular intervals, the ‘coupon’, followed by the full value of the bond at maturity. The coupon is fixed but the Yield varies as it takes into account changes in the bond’s price. For example, a Gilt worth 100 Pounds Sterling might have a coupon of 5.0%. If the Gilt’s price were to fall to 98 Pounds, the coupon would still be 5.0%, but the Gilt Yield would rise to 5.102% to reflect the decline in price.
Many factors influence Gilt yields, but the main ones are interest rates, the strength of the British economy, the liquidity of the bond market and the value of the Pound Sterling. Rising inflation will generally weaken Gilt prices and lead to higher Gilt yields because Gilts are long-term investments susceptible to inflation, which erodes their value. Higher interest rates impact existing Gilt yields because newly-issued Gilts will carry a higher, more attractive coupon. Liquidity can be a risk when there is a lack of buyers or sellers due to panic or preference for riskier assets.
Probably the most important factor influencing the level of Gilt yields is interest rates. These are set by the Bank of England (BoE) to ensure price stability. Higher interest rates will raise yields and lower the price of Gilts because new Gilts issued will bear a higher, more attractive coupon, reducing demand for older Gilts, which will see a corresponding decline in price.
Inflation is a key factor affecting Gilt yields as it impacts the value of the principal received by the holder at the end of the term, as well as the relative value of the repayments. Higher inflation deteriorates the value of Gilts over time, reflected in a higher yield (lower price). The opposite is true of lower inflation. In rare cases of deflation, a Gilt may rise in price – represented by a negative yield.
Foreign holders of Gilts are exposed to exchange-rate risk since Gilts are denominated in Pound Sterling. If the currency strengthens investors will realize a higher return and vice versa if it weakens. In addition, Gilt yields are highly correlated to the Pound Sterling. This is because yields are a reflection of interest rates and interest rate expectations, a key driver of Pound Sterling. Higher interest rates, raise the coupon on newly-issued Gilts, attracting more global investors. Since they are priced in Pounds, this increases demand for Pound Sterling.
EUR/USD holds steady near 1.0300 in the early European session on Friday after closing in negative territory for the third consecutive day on Thursday. The pair remains technically bearish in the near term as focus shifts to labor market data from the US.
The table below shows the percentage change of Euro (EUR) against listed major currencies this week. Euro was the weakest against the Canadian Dollar.
| USD | EUR | GBP | JPY | CAD | AUD | NZD | CHF | |
|---|---|---|---|---|---|---|---|---|
| USD | 0.06% | 1.04% | 0.74% | -0.36% | 0.41% | 0.50% | 0.32% | |
| EUR | -0.06% | 0.96% | 0.65% | -0.37% | 0.38% | 0.48% | 0.30% | |
| GBP | -1.04% | -0.96% | -0.31% | -1.32% | -0.57% | -0.48% | -0.66% | |
| JPY | -0.74% | -0.65% | 0.31% | -1.09% | -0.31% | -0.20% | -0.19% | |
| CAD | 0.36% | 0.37% | 1.32% | 1.09% | 0.70% | 0.82% | 0.66% | |
| AUD | -0.41% | -0.38% | 0.57% | 0.31% | -0.70% | 0.10% | -0.09% | |
| NZD | -0.50% | -0.48% | 0.48% | 0.20% | -0.82% | -0.10% | -0.18% | |
| CHF | -0.32% | -0.30% | 0.66% | 0.19% | -0.66% | 0.09% | 0.18% |
The heat map shows percentage changes of major currencies against each other. The base currency is picked from the left column, while the quote currency is picked from the top row. For example, if you pick the Euro from the left column and move along the horizontal line to the US Dollar, the percentage change displayed in the box will represent EUR (base)/USD (quote).
With US stock markets remaining closed and bond markets closing early in observance of a national day of mourning to honor the death of former President Jimmy Carter, the market action turned subdued on Thursday. Early Friday, US stock index futures lose between 0.1% and 0.4%, reflecting a cautious market stance, which makes it difficult for EUR/USD to stage a rebound.
Later in the day, the US Bureau of Labor Statistics will publish the December employment report. Markets expect Nonfarm Payrolls to rise by 160,000 following November’s 227,000 increase. The Unemployment Rate is forecast to remain unchanged at 4.2%.
An NFP reading above 200,000 could boost the USD heading into the weekend and force EUR/USD to stretch lower. On the other hand, a disappointing print below 150,000 could have the opposite impact on the pair’s action. In case the headline NFP arrives near the market consensus, the change in the Unemployment Rate could drive the USD’s valuation, with an unexpected rise hurting the currency and vice versa.
The Relative Strength Index moves sideways below 50 and EUR/USD remains below the 20 and the 50-period Simple Moving Averages (SMA) on the 4-hour chart, highlighting buyers’ hesitancy.
In case EUR/USD confirms 1.0300 (static level, round level) as resistance, 1.0240 (static level, end point of the latest downtrend) could be seen as next support before 1.0200 (static level, round level). If the pair manages to stabilize above 1.0300, 1.0325 (Fibonacci 23.6% retracement of the latest downtrend, 20-period SMA) and 1.0375 (100-period SMA, Fibonacci 38.2% retracement) could be seen as next resistance levels.
Nonfarm Payrolls (NFP) are part of the US Bureau of Labor Statistics monthly jobs report. The Nonfarm Payrolls component specifically measures the change in the number of people employed in the US during the previous month, excluding the farming industry.
The Nonfarm Payrolls figure can influence the decisions of the Federal Reserve by providing a measure of how successfully the Fed is meeting its mandate of fostering full employment and 2% inflation. A relatively high NFP figure means more people are in employment, earning more money and therefore probably spending more. A relatively low Nonfarm Payrolls’ result, on the either hand, could mean people are struggling to find work. The Fed will typically raise interest rates to combat high inflation triggered by low unemployment, and lower them to stimulate a stagnant labor market.
Nonfarm Payrolls generally have a positive correlation with the US Dollar. This means when payrolls’ figures come out higher-than-expected the USD tends to rally and vice versa when they are lower. NFPs influence the US Dollar by virtue of their impact on inflation, monetary policy expectations and interest rates. A higher NFP usually means the Federal Reserve will be more tight in its monetary policy, supporting the USD.
Nonfarm Payrolls are generally negatively-correlated with the price of Gold. This means a higher-than-expected payrolls’ figure will have a depressing effect on the Gold price and vice versa. Higher NFP generally has a positive effect on the value of the USD, and like most major commodities Gold is priced in US Dollars. If the USD gains in value, therefore, it requires less Dollars to buy an ounce of Gold. Also, higher interest rates (typically helped higher NFPs) also lessen the attractiveness of Gold as an investment compared to staying in cash, where the money will at least earn interest.
Nonfarm Payrolls is only one component within a bigger jobs report and it can be overshadowed by the other components. At times, when NFP come out higher-than-forecast, but the Average Weekly Earnings is lower than expected, the market has ignored the potentially inflationary effect of the headline result and interpreted the fall in earnings as deflationary. The Participation Rate and the Average Weekly Hours components can also influence the market reaction, but only in seldom events like the “Great Resignation” or the Global Financial Crisis.
Important DisclaimersThe content provided on the website includes general news and publications, our personal analysis and opinions, and contents provided by third parties, which are intended for educational and research purposes only. It does not constitute, and should not be read as, any recommendation or advice to take any action whatsoever, including to make any investment or buy any product. When making any financial decision, you should perform your own due diligence checks, apply your own discretion and consult your competent advisors. The content of the website is not personally directed to you, and we does not take into account your financial situation or needs.The information contained in this website is not necessarily provided in real-time nor is it necessarily accurate. Prices provided herein may be provided by market makers and not by exchanges.Any trading or other financial decision you make shall be at your full responsibility, and you must not rely on any information provided through the website. FX Empire does not provide any warranty regarding any of the information contained in the website, and shall bear no responsibility for any trading losses you might incur as a result of using any information contained in the website.The website may include advertisements and other promotional contents, and FX Empire may receive compensation from third parties in connection with the content. FX Empire does not endorse any third party or recommends using any third party’s services, and does not assume responsibility for your use of any such third party’s website or services.FX Empire and its employees, officers, subsidiaries and associates, are not liable nor shall they be held liable for any loss or damage resulting from your use of the website or reliance on the information provided on this website.Risk DisclaimersThis website includes information about cryptocurrencies, contracts for difference (CFDs) and other financial instruments, and about brokers, exchanges and other entities trading in such instruments. Both cryptocurrencies and CFDs are complex instruments and come with a high risk of losing money. You should carefully consider whether you understand how these instruments work and whether you can afford to take the high risk of losing your money.FX Empire encourages you to perform your own research before making any investment decision, and to avoid investing in any financial instrument which you do not fully understand how it works and what are the risks involved.
Gold price consolidates the weekly gains just below the one-month high of $2,678 set on Thursday as traders eagerly await the US Nonfarm Payrolls (NFP) data for placing fresh bets.
Gold price continues to draw support from increased safe-haven demand, which overshadows the persistent strength in the US Dollar (USD) and the US Treasury bond yields. Inflation fears have been stoked due to the potential impact of the incoming immigration and trade policies by US President-elect Donald Trump, boosting the appeal of Gold price as an inflation hedge and a traditional safe-haven asset.
Meanwhile, expectations of fewer interest rate cuts by the US Federal Reserve (Fed) this year and China’s economic concerns keep the sentiment around the USD underpinned as the Greenback hovers near weekly highs against its major currency rivals. US benchmark 10-year Treasury bond yields sit at eight-month highs above 4.68%, somewhat limiting the upside attempts in the non-yielding Gold price.
Markets also remain risk-averse and refrain from placing any directional bets on the bright metal amid a typical pre-NFP caution. The US economy is expected to create 160K jobs in December after adding 227K jobs in November. The Unemployment Rate and the Average Hourly Earnings will likely remain steady at 4.2% and 4%, respectively, in the reported period.
A weaker-than-expected headline NFP print is likely to bring back expectations of aggressive Fed rate cuts on the table, triggering a broad US Dollar correction while adding extra legs to the ongoing Gold price uptrend. Conversely, an upside surprise in the NFP and wage inflation data could ramp up hawkish Fed bets, spelling doom for Gold price.
Further, markets could also resort to profit-taking on Gold longs ahead of next week’s US Consumer Price Index (CPI) data. However, speculations surrounding Trump’s policies could continue to drive markets, acting as a major tailwind for Gold price heading into the weekend.
The daily chart shows that the 14-day Relative Strength Index (RSI) holds comfortably above the midline, currently near 57.50, justifying the ongoing upside in Gold price. Additionally, Gold price closed Tuesday above the static resistance at $2,665.
However, buyers are likely to remain cautious as the 21-day Simple Moving Average (SMA) has crossed the 100-day SMA from above on a daily closing basis on Thursday, confirming a Bear Cross.
Amidst conflicting daily technical indicators, the US NFP report could pave the next direction in Gold price.
On a US NFP miss, Gold price could extend its four-day advance and challenge the December 13 high of $2,693 above the four-week high of $2,678.
The next upside barriers are aligned at the $2,700 round level and the December 12 high of $2,726.
Alternatively, strong payrolls could revive Gold sellers, knocking the rates toward the 50-day SMA at $2,643, below which the confluence of the 21-day SMA and the 100-day SMA at $2,633 will be tested.
The line in the sand for Gold buyers is pegged at the January 6 low of $2,615.
The Nonfarm Payrolls release presents the number of new jobs created in the US during the previous month in all non-agricultural businesses; it is released by the US Bureau of Labor Statistics (BLS). The monthly changes in payrolls can be extremely volatile. The number is also subject to strong reviews, which can also trigger volatility in the Forex board. Generally speaking, a high reading is seen as bullish for the US Dollar (USD), while a low reading is seen as bearish, although previous months’ reviews and the Unemployment Rate are as relevant as the headline figure. The market’s reaction, therefore, depends on how the market assesses all the data contained in the BLS report as a whole.
Silver price (XAG/USD) continues its rally after registering little losses in the previous session, trading around $30.20 per troy ounce during the Asian hours on Friday. Traders are now focused on US labor market data including Nonfarm Payrolls (NFP), for additional insights into the Federal Reserve’s policy direction.
The precious Silver, often considered a safe-haven asset, gains support amid uncertainty surrounding inflation and potential tariffs under President-elect Trump’s administration, as highlighted by the US Federal Reserve (Fed).
However, the upside of the non-yielding metal could be restrained as long-term US bond yields continue climbing on heavy supply. The 10-year stands at 4.68%, while the 30-year stands at 4.92% at the time of writing. This could be attributed to hawkish Federal Open Market Committee (FOMC) Minutes from the December meeting.
The latest FOMC Meeting Minutes showed that Fed policymakers expressed concern about inflation and the impact that President-elect Donald Trump’s policies could have. Fed officials indicated they would be moving more slowly on rate reductions because of the uncertainty. Fed officials penciled the expected cuts in 2025 to two from four in the previous estimate at September’s meeting.
Heightened geopolitical tensions have intensified market volatility, driving investors toward safe-haven assets like Silver. On Thursday, four people were killed in shelling incidents in Ukraine, with regional officials attributing one attack to Russia’s military and another to Ukrainian forces. In the Russian-controlled Zaporizhzhia region, two additional fatalities occurred when the town of Kamyanka-Dniprovska came under Ukrainian fire, according to Russia-appointed governor Yevgeny Balitsky, as reported by Reuters.
Silver is a precious metal highly traded among investors. It has been historically used as a store of value and a medium of exchange. Although less popular than Gold, traders may turn to Silver to diversify their investment portfolio, for its intrinsic value or as a potential hedge during high-inflation periods. Investors can buy physical Silver, in coins or in bars, or trade it through vehicles such as Exchange Traded Funds, which track its price on international markets.
Silver prices can move due to a wide range of factors. Geopolitical instability or fears of a deep recession can make Silver price escalate due to its safe-haven status, although to a lesser extent than Gold’s. As a yieldless asset, Silver tends to rise with lower interest rates. Its moves also depend on how the US Dollar (USD) behaves as the asset is priced in dollars (XAG/USD). A strong Dollar tends to keep the price of Silver at bay, whereas a weaker Dollar is likely to propel prices up. Other factors such as investment demand, mining supply – Silver is much more abundant than Gold – and recycling rates can also affect prices.
Silver is widely used in industry, particularly in sectors such as electronics or solar energy, as it has one of the highest electric conductivity of all metals – more than Copper and Gold. A surge in demand can increase prices, while a decline tends to lower them. Dynamics in the US, Chinese and Indian economies can also contribute to price swings: for the US and particularly China, their big industrial sectors use Silver in various processes; in India, consumers’ demand for the precious metal for jewellery also plays a key role in setting prices.
Silver prices tend to follow Gold’s moves. When Gold prices rise, Silver typically follows suit, as their status as safe-haven assets is similar. The Gold/Silver ratio, which shows the number of ounces of Silver needed to equal the value of one ounce of Gold, may help to determine the relative valuation between both metals. Some investors may consider a high ratio as an indicator that Silver is undervalued, or Gold is overvalued. On the contrary, a low ratio might suggest that Gold is undervalued relative to Silver.