The main category of Forex News.
You can use the search box below to find what you need.
[wd_asp id=1]
The main category of Forex News.
You can use the search box below to find what you need.
[wd_asp id=1]
Silver price (XAG/USD) trades in a tight range around $29.00 in Friday’s European trading session. The white metal consolidates as investors await the United States (US) core Personal Consumption Expenditure Price Index (PCE) data for November, which will be published at 13:30 GMT.
Economists expect the US annual core PCE inflation data to have accelerated to 2.9% from 2.8% in October. On month, the underlying inflation data is estimated to have grown steadily by 0.2%. Signs of mild slowdown in price pressures are unlikely to impact market expectations that the Federal Reserve (Fed) will pause the policy-easing spell in the policy meeting in January 2025. However, a sharp deceleration could weigh on them. On the contrary, a mild or sharp acceleration in price pressures would strengthen them.
In the policy meeting on Wednesday, the Fed reduced its key borrowing rates by 25 basis points (bps) to 4.25%-4.50% but signaled fewer interest rate cuts for 2025. The Fed dot plot showed that officials collectively see Federal Fund rates heading to 3.9% by 2025 against 3.4% projected in September.
Ahead of the US PCE inflation data, the US Dollar Index (DXY), which tracks the Greenback’s value against six major currencies, edges lower after posting a fresh two-year high at 108.50. 10-year US Treasury yields tick lower to 4.56% from a fresh six-month high of 4.60%. Higher yields on interest-bearing assets increase the opportunity cost of holding an investment in non-yielding assets, such as Silver.
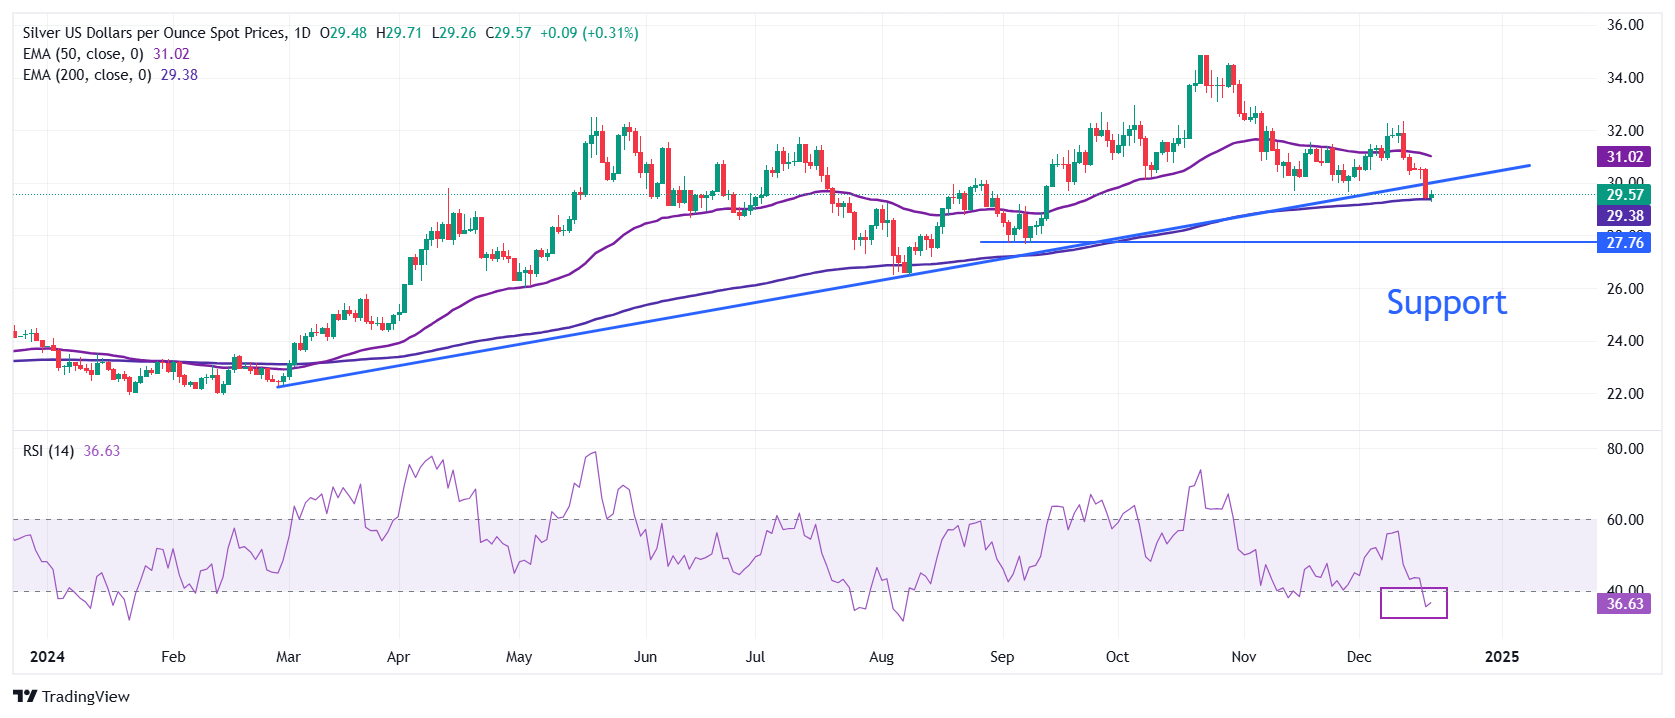
Silver price slides below the 200-day Exponential Moving Average (EMA), which trades around $29.35. The white metal weakens after a breakdown of the upward-sloping trendline around $30.20, which is plotted from the February 29 low of $22.30.
The 14-day Relative Strength Index (RSI) drops inside the bearish range of 20.00-40.00 range, guiding a downside momentum ahead.
Looking down, the September low of $27.75 would as key support for the Silver price. On the upside, the 50-day EMA around $30.90 would be the barrier.
Silver is a precious metal highly traded among investors. It has been historically used as a store of value and a medium of exchange. Although less popular than Gold, traders may turn to Silver to diversify their investment portfolio, for its intrinsic value or as a potential hedge during high-inflation periods. Investors can buy physical Silver, in coins or in bars, or trade it through vehicles such as Exchange Traded Funds, which track its price on international markets.
Silver prices can move due to a wide range of factors. Geopolitical instability or fears of a deep recession can make Silver price escalate due to its safe-haven status, although to a lesser extent than Gold’s. As a yieldless asset, Silver tends to rise with lower interest rates. Its moves also depend on how the US Dollar (USD) behaves as the asset is priced in dollars (XAG/USD). A strong Dollar tends to keep the price of Silver at bay, whereas a weaker Dollar is likely to propel prices up. Other factors such as investment demand, mining supply – Silver is much more abundant than Gold – and recycling rates can also affect prices.
Silver is widely used in industry, particularly in sectors such as electronics or solar energy, as it has one of the highest electric conductivity of all metals – more than Copper and Gold. A surge in demand can increase prices, while a decline tends to lower them. Dynamics in the US, Chinese and Indian economies can also contribute to price swings: for the US and particularly China, their big industrial sectors use Silver in various processes; in India, consumers’ demand for the precious metal for jewellery also plays a key role in setting prices.
Silver prices tend to follow Gold’s moves. When Gold prices rise, Silver typically follows suit, as their status as safe-haven assets is similar. The Gold/Silver ratio, which shows the number of ounces of Silver needed to equal the value of one ounce of Gold, may help to determine the relative valuation between both metals. Some investors may consider a high ratio as an indicator that Silver is undervalued, or Gold is overvalued. On the contrary, a low ratio might suggest that Gold is undervalued relative to Silver.
Following Wednesday’s loss of more than 1%, GBP/USD extended its slide on Thursday. After touching its weakest level since early May near 1.2470 in the Asian trading hours on Friday, the pair recovered to the 1.2500 area in the European session.
The table below shows the percentage change of British Pound (GBP) against listed major currencies this week. British Pound was the weakest against the US Dollar.
| USD | EUR | GBP | JPY | CAD | AUD | NZD | CHF | |
|---|---|---|---|---|---|---|---|---|
| USD | 1.15% | 0.95% | 1.99% | 1.07% | 2.02% | 2.29% | 0.32% | |
| EUR | -1.15% | -0.14% | 0.94% | -0.01% | 1.03% | 1.20% | -0.76% | |
| GBP | -0.95% | 0.14% | 0.96% | 0.13% | 1.17% | 1.32% | -0.62% | |
| JPY | -1.99% | -0.94% | -0.96% | -0.93% | 0.02% | 0.30% | -1.57% | |
| CAD | -1.07% | 0.01% | -0.13% | 0.93% | 0.99% | 1.20% | -0.74% | |
| AUD | -2.02% | -1.03% | -1.17% | -0.02% | -0.99% | 0.17% | -1.77% | |
| NZD | -2.29% | -1.20% | -1.32% | -0.30% | -1.20% | -0.17% | -1.94% | |
| CHF | -0.32% | 0.76% | 0.62% | 1.57% | 0.74% | 1.77% | 1.94% |
The heat map shows percentage changes of major currencies against each other. The base currency is picked from the left column, while the quote currency is picked from the top row. For example, if you pick the British Pound from the left column and move along the horizontal line to the US Dollar, the percentage change displayed in the box will represent GBP (base)/USD (quote).
The Bank of England (BoE) maintained its bank rate at 4.75% after the December meeting, as expected. On a dovish twist, however, three members of the Monetary Policy Committee (MPC) voted for a 25 basis points (bps) rate cut. In its policy statement, the BoE said that they can’t commit to when or by how much they will cut rates in 2025, due to heightened uncertainty in the economy. Pound Sterling came under bearish pressure following the BoE’s policy announcements.
Early Friday, the negative shift seen in risk mood doesn’t allow GBP/USD to gather recovery momentum. Growing concerns over a US government shutdown at the end of the day causes investors to adopt a cautious stance. Reflecting the sour mood, US stock index futures were last seen losing between 0.6% and 1% on the day. In case safe-haven flows continue to dominate the action in financial markets, the pair could stretch lower heading into the weekend.
Meanwhile, the data published by the UK’s Office for National Statistics (ONS) showed on Friday that Retail Sales rose by 0.2% on a monthly basis in November. This reading came in below the market expectation for an increase of 0.5%.
In the second half of the day, the US Bureau of Economic Analysis will publish the Personal Consumption Expenditures (PCE) Price Index data for November. Investors are likely to ignore this data.
The Relative Strength Index (RSI) indicator on the 4-hour chart stays slightly above 30, suggesting that GBP/USD could stretch lower before looking to stage a technical correction. On the downside, static support seems to have formed at 1.2480 ahead of 1.2400 (round level, static level) and 1.2340 (static level).
Looking north, first resistance could be spotted at 1.2550 (static level) before 1.2600 (static level, round level).
The Pound Sterling (GBP) is the oldest currency in the world (886 AD) and the official currency of the United Kingdom. It is the fourth most traded unit for foreign exchange (FX) in the world, accounting for 12% of all transactions, averaging $630 billion a day, according to 2022 data. Its key trading pairs are GBP/USD, also known as ‘Cable’, which accounts for 11% of FX, GBP/JPY, or the ‘Dragon’ as it is known by traders (3%), and EUR/GBP (2%). The Pound Sterling is issued by the Bank of England (BoE).
The single most important factor influencing the value of the Pound Sterling is monetary policy decided by the Bank of England. The BoE bases its decisions on whether it has achieved its primary goal of “price stability” – a steady inflation rate of around 2%. Its primary tool for achieving this is the adjustment of interest rates. When inflation is too high, the BoE will try to rein it in by raising interest rates, making it more expensive for people and businesses to access credit. This is generally positive for GBP, as higher interest rates make the UK a more attractive place for global investors to park their money. When inflation falls too low it is a sign economic growth is slowing. In this scenario, the BoE will consider lowering interest rates to cheapen credit so businesses will borrow more to invest in growth-generating projects.
Data releases gauge the health of the economy and can impact the value of the Pound Sterling. Indicators such as GDP, Manufacturing and Services PMIs, and employment can all influence the direction of the GBP. A strong economy is good for Sterling. Not only does it attract more foreign investment but it may encourage the BoE to put up interest rates, which will directly strengthen GBP. Otherwise, if economic data is weak, the Pound Sterling is likely to fall.
Another significant data release for the Pound Sterling is the Trade Balance. This indicator measures the difference between what a country earns from its exports and what it spends on imports over a given period. If a country produces highly sought-after exports, its currency will benefit purely from the extra demand created from foreign buyers seeking to purchase these goods. Therefore, a positive net Trade Balance strengthens a currency and vice versa for a negative balance.
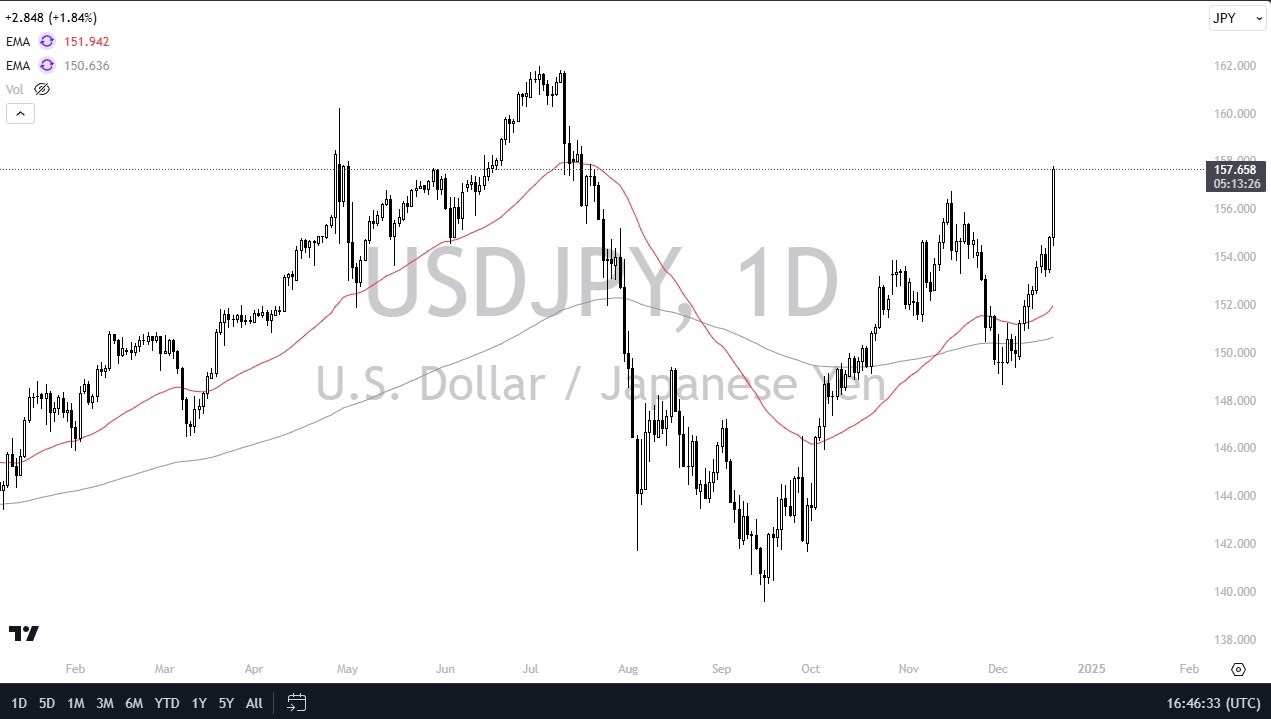
It looks like the Bank of Japan really couldn’t do anything, and therefore I think you got a situation where the Federal Reserve completely dropped the ball during the press conference, as Jerome Powell gave one of his worst press conferences of his tenure. Because of this, we’ve seen a lot of uncertainty around the US dollar, and it launched against most currencies.

However, since then we have seen the Bank of Japan coming go, so it’s very interesting that we have seen this market break out above the crucial ¥156.50 level. The 156.50 again level is an area that previously had been a swing high, so the fact that we broke above it suggests that we probably have further to go. The size of the candlestick is very impressive, so with this I’ve got interest in trying to get long yet again.
Short-term pullbacks should continue to attract a lot of attention, and I think you’ve got a scenario where traders will be doing everything, sleep they can take advantage of a little bit of value on the pullback. In fact, I just don’t see a situation where I would get short of this pair, because we have only seen more enthusiasm to the upside, despite the fact that we are heading into the holiday season. This is the time of year where you would anticipate that markets would stop moving, but we have found quite the opposite here.
Want to trade our USD/JPY forex analysis and predictions? Here’s a list of forex brokers in Japan to check out.
Silver price (XAG/USD) continues its losing streak that began on December 12, trading around $28.90 per troy ounce during the Asian session on Friday. The price of the grey metal reached a fresh three-month low at $28.74 in the previous session.
The non-yielding assets like Silver receive downward pressure as central banks emphasize the need for caution regarding additional rate cuts. Fed Chair Jerome Powell emphasized the need for caution regarding additional rate cuts, noting that inflation is likely to remain persistently above the central bank’s 2% target.
Moreover, the Bank of Japan (BoJ) maintained its ultra-low interest rates on Thursday as President-elect Donald Trump’s tariff threats loomed over Japan’s export-driven economy. Meanwhile, the Bank of England (BoE) kept interest rates unchanged, with policymakers divided on the appropriate response to the country’s slowing economic growth. On Friday, the People’s Bank of China (PBoC) decided to keep its Loan Prime Rates (LPRs) unchanged.
Concerns about potential tariffs from the upcoming Trump administration have heightened worries about weak demand for Silver as an industrial input, causing the metal to underperform in the fourth quarter. Additionally, Silver prices face challenges due to the constrained industrial outlook, driven by overcapacity in China’s solar panel industry, which has led photovoltaic companies to join a government self-discipline program to regulate supply.
Silver is a precious metal highly traded among investors. It has been historically used as a store of value and a medium of exchange. Although less popular than Gold, traders may turn to Silver to diversify their investment portfolio, for its intrinsic value or as a potential hedge during high-inflation periods. Investors can buy physical Silver, in coins or in bars, or trade it through vehicles such as Exchange Traded Funds, which track its price on international markets.
Silver prices can move due to a wide range of factors. Geopolitical instability or fears of a deep recession can make Silver price escalate due to its safe-haven status, although to a lesser extent than Gold’s. As a yieldless asset, Silver tends to rise with lower interest rates. Its moves also depend on how the US Dollar (USD) behaves as the asset is priced in dollars (XAG/USD). A strong Dollar tends to keep the price of Silver at bay, whereas a weaker Dollar is likely to propel prices up. Other factors such as investment demand, mining supply – Silver is much more abundant than Gold – and recycling rates can also affect prices.
Silver is widely used in industry, particularly in sectors such as electronics or solar energy, as it has one of the highest electric conductivity of all metals – more than Copper and Gold. A surge in demand can increase prices, while a decline tends to lower them. Dynamics in the US, Chinese and Indian economies can also contribute to price swings: for the US and particularly China, their big industrial sectors use Silver in various processes; in India, consumers’ demand for the precious metal for jewellery also plays a key role in setting prices.
Silver prices tend to follow Gold’s moves. When Gold prices rise, Silver typically follows suit, as their status as safe-haven assets is similar. The Gold/Silver ratio, which shows the number of ounces of Silver needed to equal the value of one ounce of Gold, may help to determine the relative valuation between both metals. Some investors may consider a high ratio as an indicator that Silver is undervalued, or Gold is overvalued. On the contrary, a low ratio might suggest that Gold is undervalued relative to Silver.
We have countries, parliaments, governments collapsing, we have the US dollar strengthening anyways. And then we have a situation where interest rates in America continue to go to the upside. In America, while in Europe, the ECB is likely to continue to see a lot of reasons to put interest rates going forward. So that makes the US dollar much more attractive. Furthermore, the US economy is infinitely stronger than most of the European economies.
So, all things being equal, we are at an extraordinarily low level. But I think we will go lower. This is a market that I short every time we get a little bit of a bounce for short term trades, mainly due to the time of year, the market will face some liquidity issues over the next couple of weeks. And there could be a nice rally due to short covering as we had into New Year’s Day. But that should be thought of as a potential opportunity. It’s really not until we break above the 1.0650 level that I would consider going long. That’s three full handles from here. And even then, I would be a bit cautious. I think rallies are to be squashed just like we’ve seen during the trading session on Thursday.
Ready to trade our Forex EUR/USD daily forecast? We’ve shortlisted the best forex broker list for you to check out.
Silver price finds an interim cushion near $29.25 but its outlook remains vulnerable.
Higher bond yields due to the Fed’s hawkish guidance have weighed on the Silver price.
The Fed sees only two interest rate cuts in 2025.
Silver price (XAG/USD) finds temporary support near $29.25 on Thursday after plunging almost 4% on Wednesday. The outlook of the white metal remains bearish as the Federal Reserve (Fed) has signaled fewer interest rate cuts for 2025 after cutting them by 25-basis points (bps) to 4.25%-4.50%.
The Fed’s hawkish remarks for the next year have resulted in a rally in the US Dollar (USD) and Treasury yields. The US Dollar Index (DXY), which tracks the greenback’s value against six major currencies, dropped to near 107.90 in Thursday’s European session after refreshing a two-year high of around 108.30.
10-year US Treasury yields advance above 4.50%. Higher yields on interest-bearing assets increase the opportunity cost of holding an investment in non-yielding assets, such as Silver.
The Fed’s dot plot showed that policymakers see the Federal Funds rate heading to 3.9% by 2025, suggesting two interest rate cuts next year. In the September meeting, officials had forecasted four interest rate cuts collectively.
The Fed guided a slower policy-easing cycle as the United States (US) inflationary pressures appear to have stalled in the past few months. Meanwhile, Fed Chair Jerome Powell acknowledged that strong growth in the second half of the year is a major reason to move cautiously on interest rates.
Silver price slides to near the 200-day Exponential Moving Average (EMA), which trades around $29.40. The white metal weakened after breaking below the November low of $29.65. The asset has also tested the upward-sloping trendline around $29.50, which is plotted from the February 29 low of $22.30
The 14-day Relative Strength Index (RSI) dropped inside the bearish 20.00-40.00 range, indicating a downward trend ahead.
Looking down, the September low of $27.75 would as key support for the Silver price. On the upside, the 50-day EMA around $31.00 would be the barrier.
Silver is a precious metal highly traded among investors. It has been historically used as a store of value and a medium of exchange. Although less popular than Gold, traders may turn to Silver to diversify their investment portfolio, for its intrinsic value or as a potential hedge during high-inflation periods. Investors can buy physical Silver, in coins or in bars, or trade it through vehicles such as Exchange Traded Funds, which track its price on international markets.
Silver prices can move due to a wide range of factors. Geopolitical instability or fears of a deep recession can make Silver price escalate due to its safe-haven status, although to a lesser extent than Gold’s. As a yieldless asset, Silver tends to rise with lower interest rates. Its moves also depend on how the US Dollar (USD) behaves as the asset is priced in dollars (XAG/USD). A strong Dollar tends to keep the price of Silver at bay, whereas a weaker Dollar is likely to propel prices up. Other factors such as investment demand, mining supply – Silver is much more abundant than Gold – and recycling rates can also affect prices.
Silver is widely used in industry, particularly in sectors such as electronics or solar energy, as it has one of the highest electric conductivity of all metals – more than Copper and Gold. A surge in demand can increase prices, while a decline tends to lower them. Dynamics in the US, Chinese and Indian economies can also contribute to price swings: for the US and particularly China, their big industrial sectors use Silver in various processes; in India, consumers’ demand for the precious metal for jewellery also plays a key role in setting prices.
Silver prices tend to follow Gold’s moves. When Gold prices rise, Silver typically follows suit, as their status as safe-haven assets is similar. The Gold/Silver ratio, which shows the number of ounces of Silver needed to equal the value of one ounce of Gold, may help to determine the relative valuation between both metals. Some investors may consider a high ratio as an indicator that Silver is undervalued, or Gold is overvalued. On the contrary, a low ratio might suggest that Gold is undervalued relative to Silver.
The Japanese Yen is poised to mark a third consecutive weekly decline against the US Dollar with USD/JPY surging to fresh multi-month highs on the back of the Fed rate decision. The rally takes price into a critical pivot zone and while the broader outlook remains constructive, we’re looking for possible inflection here in the days ahead. Battle lines drawn on the USD/JPY weekly technical chart into the close of the year.
Review my latest Weekly Strategy Webinar for an in-depth breakdown of this Yen setup and more. Join live on Monday’s at 8:30am EST.
Chart Prepared by Michael Boutros, Sr. Technical Strategist; USD/JPY on TradingView
Technical Outlook: In last month’s Japanese Yen Technical Forecast we highlighted potential for a larger correction within the September uptrend in USD/JPY while noting that, “From a trading standpoint, look to reduce short-exposure / lower protective stops on a stretch towards 150 IF reached. Ultimately, we are looking for an exhaustion low ahead of 148 for the September rally to remain viable with a breach / close above 154.34 needed to mark uptrend resumption.” Price plunged nearly 5.2% off the November highs with USD/JPY registering an intraday low at 148.64 into the monthly open before rebounding.
The US Dollar is now poised to mark a third consecutive weekly advance with the recovery extending more than 6.1% off the December low on the heels of the FOMC rate decision. The rally takes USD/JPY towards a major resistance hurdle just higher at 157.17/89– a region defined by the 78.6% retracement of the yearly range and the July breakdown close. Note that the 2020 parallel converges on this zone over the next few weeks and further highlight the technical significance of this threshold.
Initial weekly support now rests back at the 1986 low / 1998 & 2022 high at 151.90-152 and is backed closely by the 52-week moving average (currently ~151.16). Broader bullish invalidation now raised to the 2022 high-close / 2023 high-week close (HWC) at 148.73-149.60– a break / close below this threshold would suggest a more significant high is in place / a larger reversal is underway. Ultimately, a break below the 61.8% retracement at 146.29 would be needed to put the bears in control.
A topside breach / close above this key pivot zone exposes subsequent resistance objectives at the upper parallel (blue slope near 159.50s) and the 1990 high / 2024 HWC at 160.40/73. Ultimately, a close above the swing highs at 161.95 would be needed to fuel the next major leg of the multi-year uptrend in USD/JPY (look for a larger reaction there IF reached).

Bottom line: The USD/JPY rally is now approaching major technical resistance, and the focus is on possible inflection into this threshold. From a trading standpoint, look to reduce portions of long-exposure / raise protective stops on a test of 157.16/89- losses should be limited to 152 IF price is heading higher on this stretch with a close above this pivot zone needed to mark resumption of the September uptrend.
Keep in mind we get the release of key US inflation data tomorrow with the Consumer Price Expenditure (PCE) expected to show a slight uptick to 2.9% y/y in November. Stay nimble into the release watch the weekly close here for guidance. Review my latest Japanese Yen Short-term Outlook for a closer look at the near-term USD/JPY technical trade levels.

Economic Calendar – latest economic developments and upcoming event risk.
— Written by Michael Boutros, Sr Technical Strategist
Follow Michael on X @MBForex
Two key near-term price levels to watch include potential support around the 20-Day MA, now at 69.42, and resistance at last week’s high of 71.41. Although a decline below the 20-Day line is a sign of weakness, the top trendline is also nearby and can be watched in conjunction with the moving average line as a potential support area. In this case, both moving averages are being used as a guide, but they are within a consolidation pattern, so their current significance is not the same as if crude oil was in a trending environment.
If the 71.41 high is exceeded, the November 22 swing high becomes the next target, and it will likely be reclaimed. A breakout above 71.41 would confirm strength and should increase the chance that the price of crude can keep rising. Also, on the larger time frame weekly chart (not shown), the 20-Week MA at 71.35 matches the November high pivot giving it a greater significance if a breakout occurs.
If the 71.41 high is exceeded, then the 50% retracement area at 72.97 would be the next upside target. It matches with the November swing high at 73.27. Further up is the 61.8% Fibonacci retracement at 74.42, followed by the bottom and top boundary lines of a large symmetrical triangle pattern. Around the same price zone is the 78.6% retracement level at 76.47.
Since crude has been consolidating recently into a tight trading range, there is the potential for a spike in volatility once the range has been cleared. A somewhat downward bias remains given the series of lower swing highs and the breakdown from a large symmetrical triangle pattern at the beginning of September. The impact of the pattern and breakdown is still being felt given that recent consolidation has occurred below the triangle.
For a look at all of today’s economic events, check out our economic calendar.
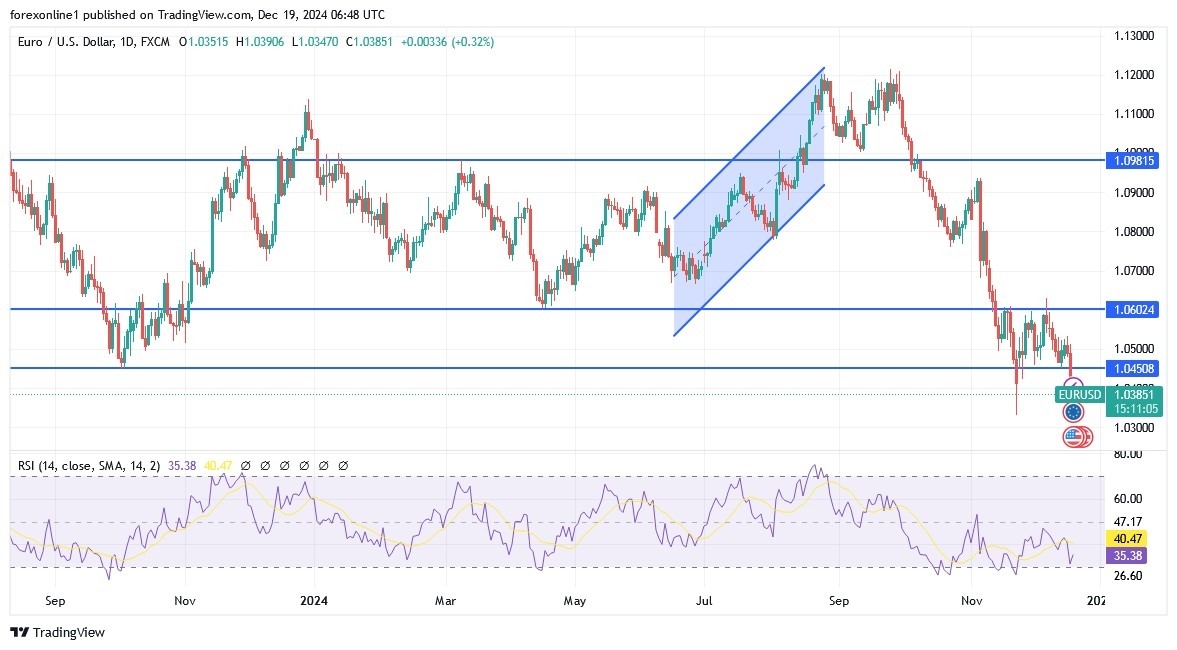
According to economic calendar data, the US Federal Reserve cut the federal funds rate by 25 basis points as expected but indicated only 50 basis points of rate cuts for 2025, which is half the cut expected in September. At the same time, the European Central Bank has already cut its main deposit rate four times this year and maintained a cautious stance on further easing. However, many analysts believe that the ECB may need to accelerate policy easing to support the weak Eurozone economy. This disparity was enough to increase EUR/USD selling, and after its recent losses, expectations for the currency pair to move towards parity have strengthened.
Confirming this, preliminary Purchasing Managers’ Indexes for both manufacturing and services pointed to another, albeit slower, contraction in private sector activity, with Germany and France continuing to perform poorly. Also, Annual inflation rose less than expected to 2.2% from the initial estimate of 2.3%. Adding to the euro’s problems is political uncertainty. In this regard, in Germany, the chancellor lost a vote of confidence in parliament as expected. In France, the new government faces significant challenges, including passing the 2025 budget.
The pressure on the euro is strong and may continue for some time, so any rebound upwards may be opportunities to sell the euro again this week, which will be fateful for the euro’s closures in 2024
The leader of the second strongest party in opinion polls in Germany told Bloomberg television in Berlin: “What we need is free trade between European countries, but we don’t need all the bureaucracy.” She has “destroyed the socialist policymaking” in the European Union and “destroyed the market mechanism in Europe.” Alice Weidel, the candidate for chancellor from the far-right Alternative for Germany party, has criticized the European Union for destroying the country’s auto industry and proposed returning the bloc to a free trade area.
In its program for the early elections on February 23, the Alternative for Germany party calls for Germany’s exit from the European Union and the Eurozone. Obviously, this would represent a major shift in German politics and break decades of political and economic integration.
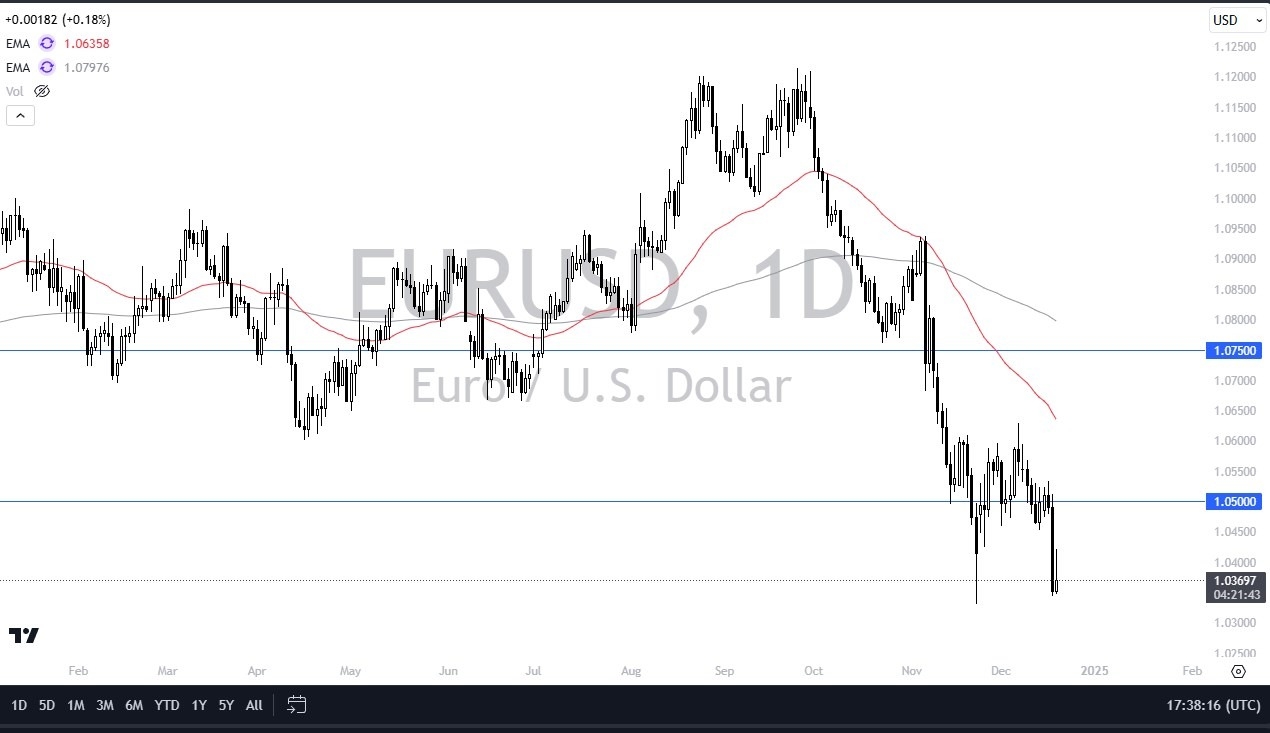
According to the performance on the daily chart above, the EUR/USD pair is still in its broader downward trend, and the current move towards the support level of 1.0350 will strengthen expectations for the future of parity between the euro and the dollar in the near future. Especially, as the economic and political problems of the Eurozone countries have worsened. The recent losses of the euro and dollar have pushed some technical indicators to oversold levels, led by the Relative Strength Index (RSI) and the MACD. Meanwhile, currency investors may not care as much about this as they focus on the continued weakness of the currency pair. Currently, the closest support levels for EUR/USD are 1.0330, 1.0250, and 1.0180, respectively. Finally, we still expect any gains for the EUR/USD to be subject to a rapid collapse.
Ready to trade our EUR/USD Forex analysis? We’ve made this forex brokers list for you to check out.
The Japanese Yen is poised to mark a third consecutive weekly decline against the US Dollar with USD/JPY surging to fresh multi-month highs on the back of the Fed rate decision. The rally takes price into a critical pivot zone and while the broader outlook remains constructive, we’re looking for possible inflection here in the days ahead. Battle lines drawn on the USD/JPY weekly technical chart into the close of the year.
Review my latest Weekly Strategy Webinar for an in-depth breakdown of this Yen setup and more. Join live on Monday’s at 8:30am EST.
Chart Prepared by Michael Boutros, Sr. Technical Strategist; USD/JPY on TradingView
Technical Outlook: In last month’s Japanese Yen Technical Forecast we highlighted potential for a larger correction within the September uptrend in USD/JPY while noting that, “From a trading standpoint, look to reduce short-exposure / lower protective stops on a stretch towards 150 IF reached. Ultimately, we are looking for an exhaustion low ahead of 148 for the September rally to remain viable with a breach / close above 154.34 needed to mark uptrend resumption.” Price plunged nearly 5.2% off the November highs with USD/JPY registering an intraday low at 148.64 into the monthly open before rebounding.
The US Dollar is now poised to mark a third consecutive weekly advance with the recovery extending more than 6.1% off the December low on the heels of the FOMC rate decision. The rally takes USD/JPY towards a major resistance hurdle just higher at 157.17/89– a region defined by the 78.6% retracement of the yearly range and the July breakdown close. Note that the 2020 parallel converges on this zone over the next few weeks and further highlight the technical significance of this threshold.
Initial weekly support now rests back at the 1986 low / 1998 & 2022 high at 151.90-152 and is backed closely by the 52-week moving average (currently ~151.16). Broader bullish invalidation now raised to the 2022 high-close / 2023 high-week close (HWC) at 148.73-149.60– a break / close below this threshold would suggest a more significant high is in place / a larger reversal is underway. Ultimately, a break below the 61.8% retracement at 146.29 would be needed to put the bears in control.
A topside breach / close above this key pivot zone exposes subsequent resistance objectives at the upper parallel (blue slope near 159.50s) and the 1990 high / 2024 HWC at 160.40/73. Ultimately, a close above the swing highs at 161.95 would be needed to fuel the next major leg of the multi-year uptrend in USD/JPY (look for a larger reaction there IF reached).

Bottom line: The USD/JPY rally is now approaching major technical resistance, and the focus is on possible inflection into this threshold. From a trading standpoint, look to reduce portions of long-exposure / raise protective stops on a test of 157.16/89- losses should be limited to 152 IF price is heading higher on this stretch with a close above this pivot zone needed to mark resumption of the September uptrend.
Keep in mind we get the release of key US inflation data tomorrow with the Consumer Price Expenditure (PCE) expected to show a slight uptick to 2.9% y/y in November. Stay nimble into the release watch the weekly close here for guidance. Review my latest Japanese Yen Short-term Outlook for a closer look at the near-term USD/JPY technical trade levels.

Economic Calendar – latest economic developments and upcoming event risk.
— Written by Michael Boutros, Sr Technical Strategist
Follow Michael on X @MBForex