The main category of Forex News.
You can use the search box below to find what you need.
[wd_asp id=1]
The main category of Forex News.
You can use the search box below to find what you need.
[wd_asp id=1]
The first pullback following the breakout of a large symmetrical triangle pattern completed at the December 4 swing low of 2.98. That was around the triangle breakout area of 3.02 and it sets the stage for a bullish continuation as prior resistance was tested as support. Today’s breakout occurred two days following a reversal day established on Tuesday, which also generated a higher swing low.
Near-term support is at today’s low of 3.39. A decline below that price could lead to another retest of support around the 20-Day MA, currently at 3.27. As noted previously, the 20-Day line was successfully tested as support on several days recently. Support was indicated by the daily closes above the line, even though earlier the price of natural gas had traded below the 20-Day line. Of course, a key support area is the interim swing low from Tuesday at 3.09 because it generated a higher swing low and holds the second point of a rising trendline.
A daily close above 3.56 will confirm today’s breakout. There could be a clear pickup in momentum that takes natural gas straight to test resistance around the top of the triangle pattern at 3.64. But given strength indicated following the symmetrical triangle breakout, that price level is expected to be exceeded. Notice that following the November 20 breakout, natural gas quickly took out prior swing highs at 3.16 and 3.09.
That was a sign of strength that should return once the 3.56 high is exceeded. Initial higher targets would then be anchored around a 38.2% Fibonacci retracement level at 3.85. Higher up is an extended target from a rising ABCD pattern (purple) at 4.06, followed by an initial target from a smaller ascending ABCD pattern (red) at 4.33.
For a look at all of today’s economic events, check out our economic calendar.
The Japanese Yen is poised to mark a third consecutive weekly decline against the US Dollar with USD/JPY surging to fresh multi-month highs on the back of the Fed rate decision. The rally takes price into a critical pivot zone and while the broader outlook remains constructive, we’re looking for possible inflection here in the days ahead. Battle lines drawn on the USD/JPY weekly technical chart into the close of the year.
Review my latest Weekly Strategy Webinar for an in-depth breakdown of this Yen setup and more. Join live on Monday’s at 8:30am EST.
Chart Prepared by Michael Boutros, Sr. Technical Strategist; USD/JPY on TradingView
Technical Outlook: In last month’s Japanese Yen Technical Forecast we highlighted potential for a larger correction within the September uptrend in USD/JPY while noting that, “From a trading standpoint, look to reduce short-exposure / lower protective stops on a stretch towards 150 IF reached. Ultimately, we are looking for an exhaustion low ahead of 148 for the September rally to remain viable with a breach / close above 154.34 needed to mark uptrend resumption.” Price plunged nearly 5.2% off the November highs with USD/JPY registering an intraday low at 148.64 into the monthly open before rebounding.
The US Dollar is now poised to mark a third consecutive weekly advance with the recovery extending more than 6.1% off the December low on the heels of the FOMC rate decision. The rally takes USD/JPY towards a major resistance hurdle just higher at 157.17/89– a region defined by the 78.6% retracement of the yearly range and the July breakdown close. Note that the 2020 parallel converges on this zone over the next few weeks and further highlight the technical significance of this threshold.
Initial weekly support now rests back at the 1986 low / 1998 & 2022 high at 151.90-152 and is backed closely by the 52-week moving average (currently ~151.16). Broader bullish invalidation now raised to the 2022 high-close / 2023 high-week close (HWC) at 148.73-149.60– a break / close below this threshold would suggest a more significant high is in place / a larger reversal is underway. Ultimately, a break below the 61.8% retracement at 146.29 would be needed to put the bears in control.
A topside breach / close above this key pivot zone exposes subsequent resistance objectives at the upper parallel (blue slope near 159.50s) and the 1990 high / 2024 HWC at 160.40/73. Ultimately, a close above the swing highs at 161.95 would be needed to fuel the next major leg of the multi-year uptrend in USD/JPY (look for a larger reaction there IF reached).

Bottom line: The USD/JPY rally is now approaching major technical resistance, and the focus is on possible inflection into this threshold. From a trading standpoint, look to reduce portions of long-exposure / raise protective stops on a test of 157.16/89- losses should be limited to 152 IF price is heading higher on this stretch with a close above this pivot zone needed to mark resumption of the September uptrend.
Keep in mind we get the release of key US inflation data tomorrow with the Consumer Price Expenditure (PCE) expected to show a slight uptick to 2.9% y/y in November. Stay nimble into the release watch the weekly close here for guidance. Review my latest Japanese Yen Short-term Outlook for a closer look at the near-term USD/JPY technical trade levels.

Economic Calendar – latest economic developments and upcoming event risk.
— Written by Michael Boutros, Sr Technical Strategist
Follow Michael on X @MBForex
U.S. natural gas is catching a bid today with two drivers, Art Hogan, Chief Market Strategist at B. Riley Wealth, told Rigzone in an exclusive interview on Thursday.
“On the fundamental side, we have seen forecasts that indicated the potential for cooler air creeping into the Lower 48 to start the new year,” he said.
“On the technical side, we saw a higher low this week, at $3.20 per million British thermal units (MMBtu), than last week, at $3.10 MMBtu, and as such traders are looking for a potential breakout above $3.50 MMBtu,” he added.
“More seasonally appropriate weather, combined with price momentum, seem to be the drivers of price this week,” he continued.
In a separate exclusive interview today, David Seduski, the head of North American gas at Energy Aspects, said “the rally in Henry Hub recently stems from expectations for a colder weather pattern in the U.S. in January”.
“The Christmas to New Year’s week looks like it will be very mild, but there are initial indications that an Alaska Ridge system is forming that typically corresponds with cold temperatures in the United States,” Seduski told Rigzone.
“Essentially, a high-pressure system forms over Alaska and that pushes cold air that typically would move from the arctic into Alaska and funnels it to the United States,” he added.
“If that system fully forms there is certainly a case for higher prices, but the temperatures wouldn’t happen until mid-January probably,” he continued.
“We’ve seen the prompt contract move up all week, but the rest of the curve has seen muted support given weather beyond even early January is very prone to forecast revisions,” Seduski went on to state.
The Energy Aspects representative also told Rigzone that there’s probably some short covering helping boost the rally.
“There’s still a lot of short positions in the market, and as the market moves higher we may be seeing some scrambling to cover in case the January weather pattern does develop and trend colder,” he said.
In another exclusive interview on Thursday, Phil Flynn, a senior market analyst at the PRICE Futures Group, told Rigzone that natural gas is rising “as the U.S. barrels in for the coldest blast of the season”.
“A cold start to winter is increasing the odds that we may see the coldest winter in years,” Flynn said.
“January forecasts are going to be the key … If they trend colder then natural gas will trend higher,” he added.
The U.S. Energy Information Administration (EIA) raised its Henry Hub natural gas spot price forecast for this year and next year in its latest short term energy outlook (STEO), which was released recently.
According to its December STEO, the EIA sees the Henry Hub spot price averaging $2.19 per million British thermal units (MMBtu) in 2024 and $2.95 per MMBtu in 2025. The EIA’s previous STEO, which was released in November, projected that the Henry Hub spot price would average $2.17 per MMBtu in 2024 and $2.90 per MMBtu in 2025.
To contact the author, email andreas.exarheas@rigzone.com
The GBP/USD forecast shows renewed support for the USD despite FOMC’s rate cut. The Fed left a hawkish statement regarding rate cuts in 2025. As a result, the pound collapsed despite lower expectations for Bank of England rate cuts. Market participants are now looking forward to US inflation data for more clues on the future of US monetary policy.
If you are interested in automated forex trading, check our detailed guide-
The greenback jumped in the previous session after the Fed forecasted fewer rate cuts in 2025. The central bank lowered borrowing costs by 25 bps on Wednesday. However, forecasts revealed that the Fed might only lower rates by 50 bps. This was a significant drop from September when the central bank forecasted 100 bps in rate cuts.
The shift in policy outlook came due to recent resilience in the US economy. Economic figures have shown inflation has paused its progress to the 2% target. At the same time, the labor market and consumer spending have remained robust despite high interest rates. Moreover, policymakers expect this to continue with the Trump administration.
On the other hand, traders are pricing in fewer rate cuts in the UK due to a robust labor market and high inflation. Wage data this week showed a surge in pay growth, which might keep the UK Central Bank cautious. At the same time, inflation jumped from 2.3% to 2.6% in the three months to October. Market participants expect the central bank to keep rates unchanged later in the day.
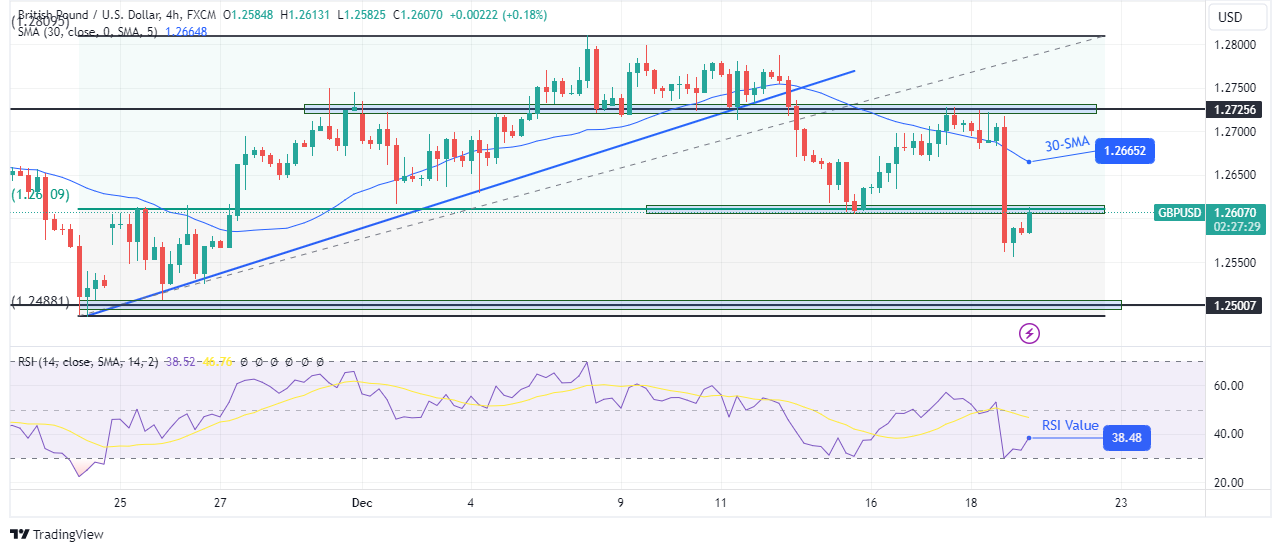
On the technical side, the GBP/USD price has collapsed and broken below the 0.618 Fib to make a lower low. As a result, the price has fallen well below the 30-SMA, showing bears are in the lead. At the same time, the RSI trades nearer the oversold region, suggesting solid bearish momentum.
If you are interested in guaranteed stop-loss forex brokers, check our detailed guide-
Initially, bulls had attempted to break above the 30-SMA but could not go beyond the 1.2725 resistance level. Soon after, there was a surge in bearish momentum as the price made an engulfing candle that broke below the 0.618 Fib level. After the impulsive move, the price has paused to retest the Fib level as resistance. If it holds, the decline will continue with the new target at 1.2500 support.
Looking to trade forex now? Invest at eToro!
67% of retail investor accounts lose money when trading CFDs with this provider. You should consider whether you can afford to take the high risk of losing your money.
Spot Gold came under selling pressure early in the American session after peaking at $2,626.31 during European trading hours. The US Dollar (USD) shed some ground throughout the first half of the day after reaching extreme overbought conditions in the Federal Reserve’s (Fed) aftermath. The United States (US) central bank delivered a hawkish cut, trimming the benchmark interest rate by 25 basis points (bps), while scaling back policymakers’ perspective on potential cuts in the upcoming years.
Global stock markets felt the heat, as most Asian and European indexes settled in the red on Thursday, following Wall Street’s slump post-Fed. US indexes kick-started the new day, trimming part of their Wednesday’s losses, but remain under strong selling pressure, helping the USD resume its advance.
Also backing the Greenback, US data was upbeat. The country published the final estimate of the Q3 Gross Domestic Product (GDP), which showed that annualized growth was higher than previously estimated, confirmed at 3.1% vs. the previous 2.8%. Initial Jobless Claims for the week ended December 13 declined to 220K from 242K in the previous week, also beating the expected 230K.
Also worth noting is that the Bank of Japan (BoJ) and the Bank of England (BoE) announced their decisions on monetary policy. The BoJ kept the short-term rate target unchanged in the range of 0.15%-0.25%, and give no clues on what’s next for monetary policy. The Bank of England also kept the benchmark interest rate on hold at 4.75%, albeit MPC members delivered a dovish message, reiterating a gradual approach to rate cuts coming up next.
From a technical point of view, the XAU/USD is at risk of falling below its recent multi-week low at $2,582.93. The daily chart shows the pair trimmed almost all its intraday gains. Gold is currently below its 20 and 100 Simple Moving Averages (SMAs), below the longer one for the first time since October 2023. The 200 SMA, in the meantime, maintains its bullish slope around the $2,470 level. Finally, technical indicators offer neutral-to-bearish slopes well into negative territory, far from suggesting the pair may recover again.
In the near term, and according to the 4-hour chart, XAU/USD seems to have completed its corrective advance and is ready to reach fresh lows. The bright metal is developing below all its moving averages, with the 20 Simple Moving Average heading firmly south below the longer ones, reflecting sellers’ strength. Technical indicators, in the meantime, have retreated from their intraday peaks, anyway, set below their midlines.
Support levels: 2,582.90 2,568.80 2,554.10
Resistance levels: 2,603.20 2,617.55 2,632.00
The USD/JPY outlook took a sharp bullish turn on Wednesday as the Fed forecasted fewer cuts in 2025, and the BoJ remained mum on the outlook for rate hikes. As a result, the dollar soared while the yen collapsed.
If you are interested in automated forex trading, check our detailed guide-
The Federal Reserve met on Wednesday and cut interest rates by 25 bps. However, it was a hawkish cut because policymakers predicted fewer rate cuts in the coming year. According to forecasts, the central bank might only cut by 50 bps in 2025. This was a 50-bps drop from September’s forecast. As a result, markets slashed bets for rate cuts, boosting the dollar.
Although traders had expected a change in the outlook for monetary easing, the Fed’s cautious forecast came as a surprise. Policymakers have assumed a less dovish stance due to the resilient US economy. Moreover, Trump’s administration might come with more economic growth and a spike in inflation, which would require a more restrictive policy.
On the other hand, the Bank of Japan kept rates unchanged on Thursday and gave little clues on future moves. Market participants had expected some hints about a rate hike. However, Governor Ueda said the central bank needed time to assess incoming data. At the same time, the uncertainty about Trump’s policies has clouded the outlook. The meeting was a disappointment, leading to a collapse in the yen.
On the technical side, the USD/JPY price has made an impulsive bullish move that has broken past major resistance levels. The move started after a retest of the 30-SMA as support. Bulls have been in the lead since the price broke above the 30-SMA. Therefore, when it pulled back, bulls were ready to make a new high. As a result, the price broke above the 154.00 and the 156.00 key resistance levels. At the same time, the RSI entered the overbought region, indicating a surge in bullish momentum.
If you are interested in guaranteed stop-loss forex brokers, check our detailed guide-
Bulls are eyeing the 158.01 resistance and might soon reach it. However, after such a sharp move, bulls might get exhausted at the next resistance, leading to a pullback to retest recently broken key levels.
Looking to trade forex now? Invest at eToro!
67% of retail investor accounts lose money when trading CFDs with this provider. You should consider whether you can afford to take the high risk of losing your money.
Important DisclaimersThe content provided on the website includes general news and publications, our personal analysis and opinions, and contents provided by third parties, which are intended for educational and research purposes only. It does not constitute, and should not be read as, any recommendation or advice to take any action whatsoever, including to make any investment or buy any product. When making any financial decision, you should perform your own due diligence checks, apply your own discretion and consult your competent advisors. The content of the website is not personally directed to you, and we does not take into account your financial situation or needs.The information contained in this website is not necessarily provided in real-time nor is it necessarily accurate. Prices provided herein may be provided by market makers and not by exchanges.Any trading or other financial decision you make shall be at your full responsibility, and you must not rely on any information provided through the website. FX Empire does not provide any warranty regarding any of the information contained in the website, and shall bear no responsibility for any trading losses you might incur as a result of using any information contained in the website.The website may include advertisements and other promotional contents, and FX Empire may receive compensation from third parties in connection with the content. FX Empire does not endorse any third party or recommends using any third party’s services, and does not assume responsibility for your use of any such third party’s website or services.FX Empire and its employees, officers, subsidiaries and associates, are not liable nor shall they be held liable for any loss or damage resulting from your use of the website or reliance on the information provided on this website.Risk DisclaimersThis website includes information about cryptocurrencies, contracts for difference (CFDs) and other financial instruments, and about brokers, exchanges and other entities trading in such instruments. Both cryptocurrencies and CFDs are complex instruments and come with a high risk of losing money. You should carefully consider whether you understand how these instruments work and whether you can afford to take the high risk of losing your money.FX Empire encourages you to perform your own research before making any investment decision, and to avoid investing in any financial instrument which you do not fully understand how it works and what are the risks involved.
The pound-dollar losses deepened after the Federal Reserve “outperformed the hawks” and backed away from its expected US interest rate cuts for 2025. According to the US central bank’s policy statement, one member of the Federal Open Market Committee (FOMC) – Beth Hammack – voted to leave US interest rates unchanged. New forecasts from the FOMC showed that officials believe fewer rate cuts are likely in 2025 and 2026.
They now expect only 50 basis points worth of cuts, meaning two cuts, while the September projections showed that cuts would be possible in 2025. As a result, the Federal Reserve is now expected to cut US interest rates two more times in 2026 and only once in 2027, raising the final interest rate to 3.1%. In general, the higher base rate for the Federal Funds rate would support US Treasury yields, which affect commercial interest rates, thereby increasing the attractiveness of US debt-based assets. This would attract foreign capital inflows, boosting the value of the US dollar.

The sterling dollar price will remain bearish amid cautious anticipation until the Bank of England announces later today. Decisively, be careful until the reaction to the bank’s announcements to determine the closing path for this week.
According to stock trading platforms, US stock indices experienced strong selling, with losses exceeding 3%, and US 10-year Treasury yields rose to their highest levels in seven months. Following the reaction to the Fed’s announcement and the statements of its chairman, Jerome Powell, the bank cut interest rates as expected, but dashed hopes for more rate cuts in 2025. As a result, the selling of US stocks was the worst after a meeting since the beginning of the pandemic, and the message was clear: the sustained rise and risk in the past two years are suddenly in danger.
Historically, the last time the S&P 500 index experienced such losses on the day of the Fed’s decision was on September 17, 2001, when the index fell by about 5%. It fell by 12% on March 16, 2020, a day after the central bank’s emergency meeting over the weekend during the pandemic.
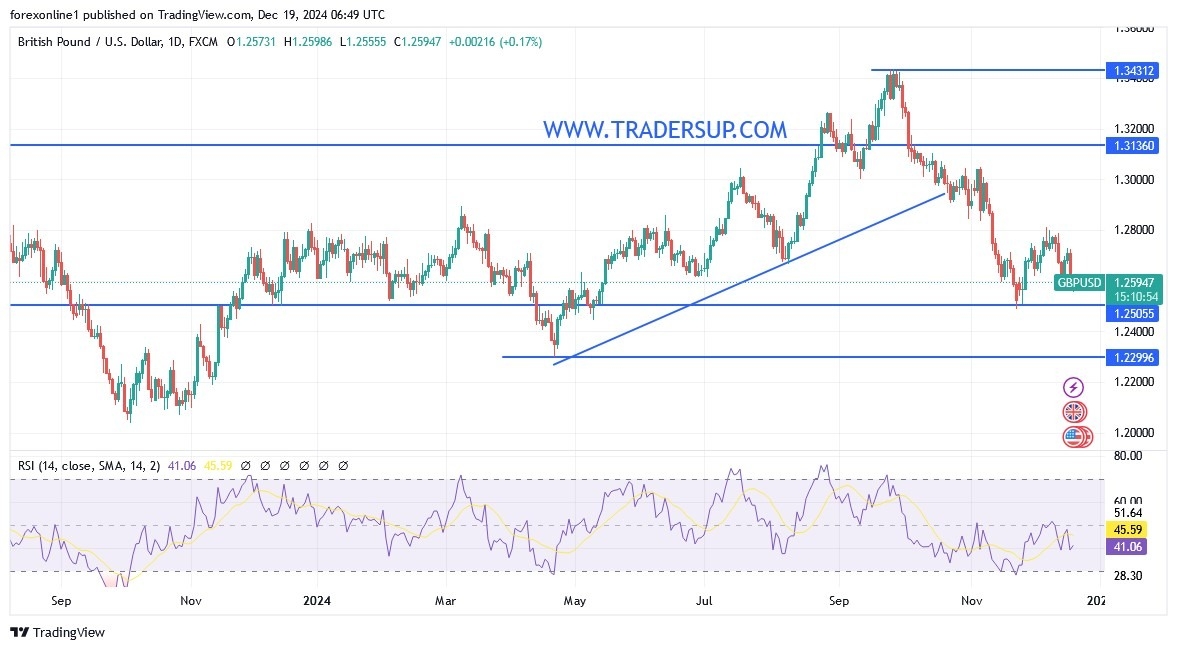
The overall trend of the GBP/USD pair remains bearish, and if the pound does not receive a strong boost from today’s Bank of England announcement. Technically, the bears may find a stronger opportunity for a stronger downward move, and the support level of 1.2487, which the currency pair recorded at the end of last month’s trading, may be an easy target, as it is the lowest level for the currency pair since May 2024. Conversely, and on the same time frame, the initial downward trend will not be broken without the currency pair moving above the resistance of 1.0800 again. Finally, we still expect to sell the GBP/USD from every upward level. In addition to the Bank of England’s announcement, the GBP/USD will be affected today by the announcement of the US GDP growth reading and the number of weekly jobless claims. This, in addition to the extent of investors’ risk appetite.
Ready to trade our daily GBP/USD Forex analysis? We’ve made this UK forex brokers list for you to check out.
Silver price (XAG/USD) finds temporary support near $29.25 on Thursday after plunging almost 4% on Wednesday. The outlook of the white metal remains bearish as the Federal Reserve (Fed) has signaled fewer interest rate cuts for 2025 after cutting them by 25-basis points (bps) to 4.25%-4.50%.
The Fed’s hawkish remarks for the next year have resulted in a rally in the US Dollar (USD) and Treasury yields. The US Dollar Index (DXY), which tracks the greenback’s value against six major currencies, dropped to near 107.90 in Thursday’s European session after refreshing a two-year high of around 108.30.
10-year US Treasury yields advance above 4.50%. Higher yields on interest-bearing assets increase the opportunity cost of holding an investment in non-yielding assets, such as Silver.
The Fed’s dot plot showed that policymakers see the Federal Funds rate heading to 3.9% by 2025, suggesting two interest rate cuts next year. In the September meeting, officials had forecasted four interest rate cuts collectively.
The Fed guided a slower policy-easing cycle as the United States (US) inflationary pressures appear to have stalled in the past few months. Meanwhile, Fed Chair Jerome Powell acknowledged that strong growth in the second half of the year is a major reason to move cautiously on interest rates.
Silver price slides to near the 200-day Exponential Moving Average (EMA), which trades around $29.40. The white metal weakened after breaking below the November low of $29.65. The asset has also tested the upward-sloping trendline around $29.50, which is plotted from the February 29 low of $22.30
The 14-day Relative Strength Index (RSI) dropped inside the bearish 20.00-40.00 range, indicating a downward trend ahead.
Looking down, the September low of $27.75 would as key support for the Silver price. On the upside, the 50-day EMA around $31.00 would be the barrier.
Silver is a precious metal highly traded among investors. It has been historically used as a store of value and a medium of exchange. Although less popular than Gold, traders may turn to Silver to diversify their investment portfolio, for its intrinsic value or as a potential hedge during high-inflation periods. Investors can buy physical Silver, in coins or in bars, or trade it through vehicles such as Exchange Traded Funds, which track its price on international markets.
Silver prices can move due to a wide range of factors. Geopolitical instability or fears of a deep recession can make Silver price escalate due to its safe-haven status, although to a lesser extent than Gold’s. As a yieldless asset, Silver tends to rise with lower interest rates. Its moves also depend on how the US Dollar (USD) behaves as the asset is priced in dollars (XAG/USD). A strong Dollar tends to keep the price of Silver at bay, whereas a weaker Dollar is likely to propel prices up. Other factors such as investment demand, mining supply – Silver is much more abundant than Gold – and recycling rates can also affect prices.
Silver is widely used in industry, particularly in sectors such as electronics or solar energy, as it has one of the highest electric conductivity of all metals – more than Copper and Gold. A surge in demand can increase prices, while a decline tends to lower them. Dynamics in the US, Chinese and Indian economies can also contribute to price swings: for the US and particularly China, their big industrial sectors use Silver in various processes; in India, consumers’ demand for the precious metal for jewellery also plays a key role in setting prices.
Silver prices tend to follow Gold’s moves. When Gold prices rise, Silver typically follows suit, as their status as safe-haven assets is similar. The Gold/Silver ratio, which shows the number of ounces of Silver needed to equal the value of one ounce of Gold, may help to determine the relative valuation between both metals. Some investors may consider a high ratio as an indicator that Silver is undervalued, or Gold is overvalued. On the contrary, a low ratio might suggest that Gold is undervalued relative to Silver.
The US Federal Reserve announced another 25-basis point cut in the US interest rate in December 2024, marking the third consecutive cut this year and reducing borrowing costs to a range of 4.25%-4.5%, in line with expectations. The so-called dot plot indicates that policymakers now expect only two interest rate cuts in 2025, totalling 50 basis points, compared to the full percentage point of cuts expected in the previous quarter.
The Federal Reserve also revised its GDP growth forecasts upward for 2024 (2.5% vs. 2% in September forecasts) and 2025 (2.1% vs. 2%), while remaining unchanged at 2% for 2026. Similarly, forecasts for personal consumption expenditure inflation were revised upward for 2024 (2.4% vs. 2.3%), 2025 (2.5% vs. 2.1%), and 2026 (2.1% vs. 2%). The same trend applies to core personal consumption expenditures, with forecasts raised for 2024 (2.8% vs. 2.6%), 2025 (2.5% vs. 2.2%), and 2026 (2.2% vs. 2%). On the other hand, the unemployment rate is expected to decline this year (4.2% vs. 4.4%) and in 2025 (4.3% vs. 4.4%) while the forecast for 2026 remained at 4.3%.
In contrast to the US Federal Reserve’s decision and expectations of a hike, the Bank of Japan today kept interest rates at around 0.25%, and it was clear to the markets that the Bank of Japan was hesitant to raise interest rates in December due to the possibility of negative outcomes. As Prime Minister Shigeru Ishiba’s minority government is currently negotiating with an opposition party that has warned against raising interest rates too early to ensure support for the next annual budget.
The Governor of the Bank of Japan is looking for the right time to raise interest rates for the third time, as recent economic indicators have shown that Japanese inflation is moving in line with the Bank of Japan’s forecasts – a prerequisite for raising interest rates.
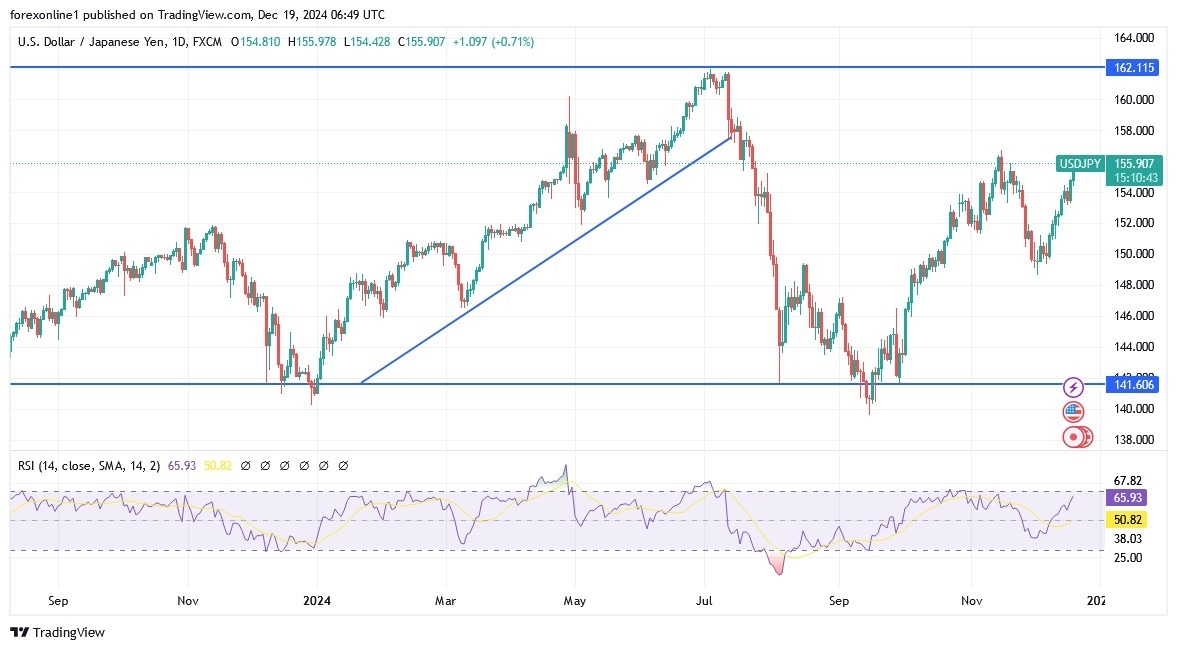
After the completion of the last central bank decisions for this year, the dollar and the Japanese yen are expected to move to stronger upward levels, and the peak of 160.00 is not ruled out soon.
As is clear from the performance on the daily chart above, the USD/JPY will remain bullish, and the chance of a stronger weekly bullish close is currently high. The recent gains are pushing the Relative Strength Index towards the overbought zone, but the MACD indicator still has room to move higher before reaching its peak. The strongest expectations now are for the dollar/yen to move towards the psychological resistance of 160.00, around which Japanese intervention in the forex markets is often discussed to stop the yen’s collapse.
Moreover, this time there is Trump who is fighting countries that intervene to weaken their currency. In general, the dollar/yen will remain on its upward trajectory until the reaction to the announcement of the US GDP growth reading and the number of weekly jobless claims. Finally, the recent performance confirms the strength of our signals to buy the dollar against the yen from every downward level.
Want to trade our USD/JPY forex analysis and predictions? Here’s a list of forex brokers in Japan to check out.