The main category of Forex News.
You can use the search box below to find what you need.
[wd_asp id=1]
The main category of Forex News.
You can use the search box below to find what you need.
[wd_asp id=1]

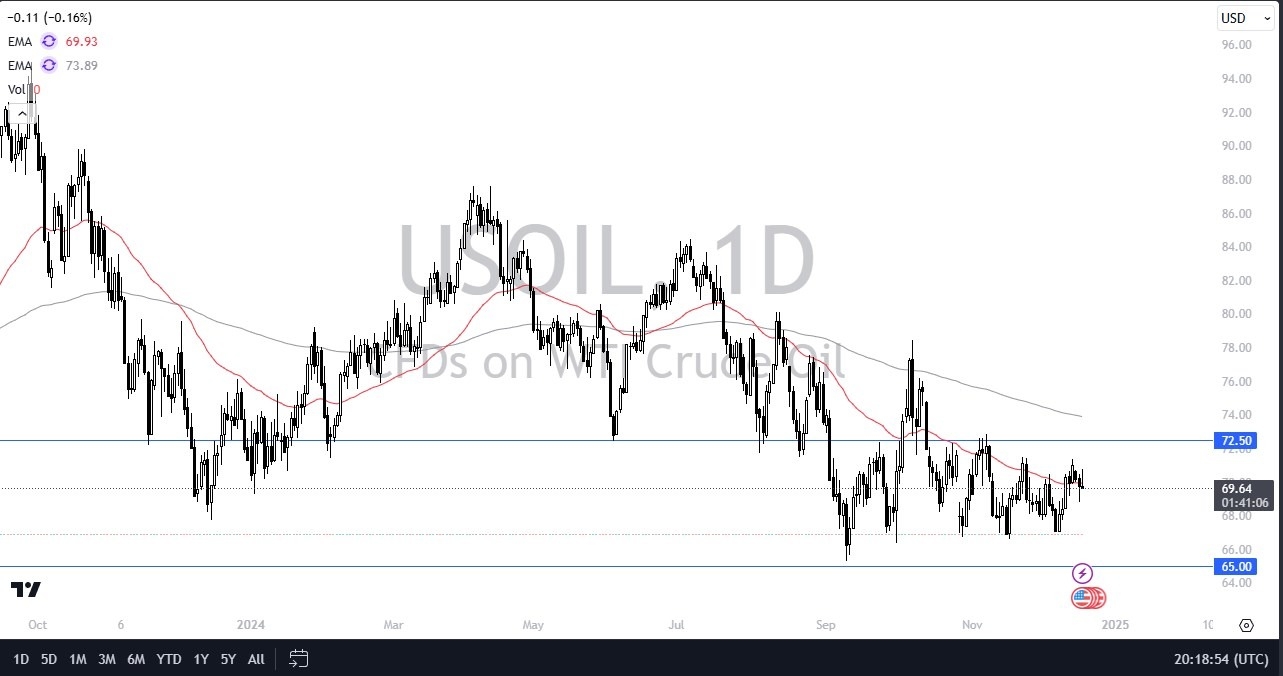
It’s worth noting that the technical analysis for this pair is somewhat sideways, and of course neutral. This makes a lot of sense, because we are trying to sort out whether or not inflation is going to increase, which obviously is a major component to the oil market. Beyond that, we also have to keep in mind that there are a lot of geopolitical concerns in the Middle East that could keep the market somewhat lightly, so with all that being said I think you’ve got a situation where you could get some geopolitical interference in this market, but right now I think what we’ve got is what could be thought of as a “bottoming process” going on.
The $65 level continues to be a major support level, while the $72.50 level above continues to be a major resistance barrier. In general, this is a market that I think continues to see a lot of questions asked of the market, but we also should keep in mind that the liquidity is probably going to shrink over the next week or so, as we head into the holidays. With this, I’m not expecting much, and I think we are simply going to be stuck with the range that we have been in in the short-term, but sometime in January I would anticipate that the market would probably start rallying to the upside as inflation doesn’t seem to be going anywhere.
Ready to trade the daily crude oil Forex forecast? Here’s a list of some of the best Oil trading platforms to check out.
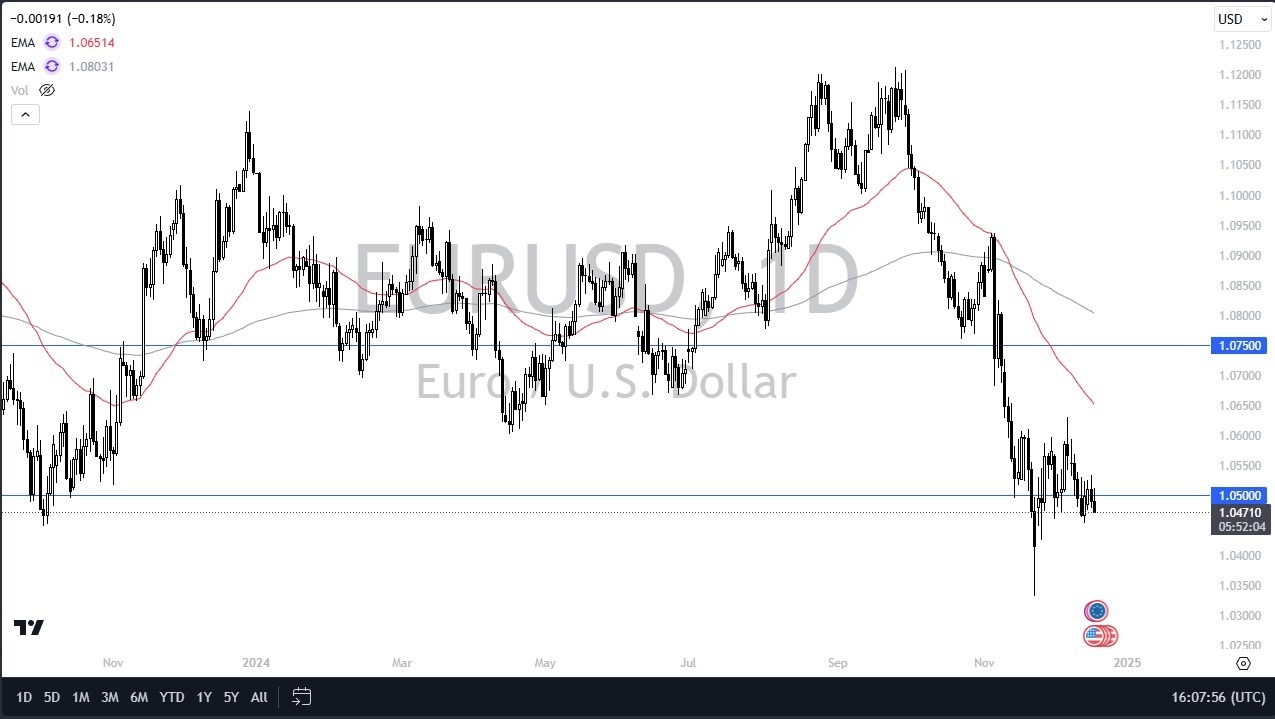
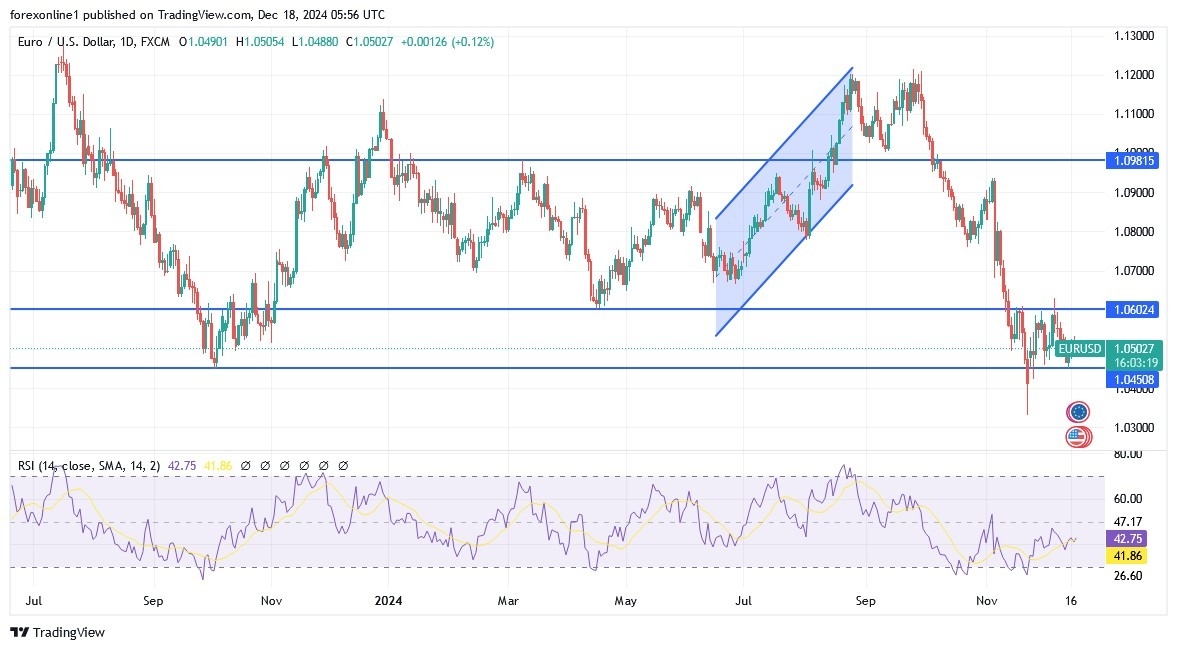
I do believe that the problems in Europe are multiple, and I think they are much stronger than any desire to own the Euro. However, there is the possibility that we get some type of rally from here. And I think that rally probably offers a nice shorting opportunity with some type of exhaustion. The 50 day EMA would be an area that I’d be watching, which is near the 1.0650 level.
Then again, I’d be watching at the 1.06 level for signs of weakness in the euro that I can start shorting. As things stand right now, unless the Federal Reserve does something really crazy in the meeting, I suspect that any US dollar weakness that you see will be an opportunity to buy more. This is especially true against the euro that has now seen no confidence votes in France and Germany. Those are your two biggest players in the region, and there is no chance that it doesn’t influence the currency.
So that doesn’t do much for confidence. If the market were to break down below the 1.04 level, then I think you’d got a shot at the 1.03 level and then eventually parity given enough time. I have no interest in buying the EUR/USD anytime soon. And therefore, rallies look suspicious to me, and I will trade as such as the greenback is rallying for a reason at this point in time.
Ready to trade our daily EUR/USD Forex analysis? We’ve made a list of the best forex demo accounts worth trading with.
After suffering heavy losses in the American session on Wednesday, GBP/USD stages a decisive rebound early Thursday as investors reposition themselves ahead of the Bank of England’s (BoE) monetary policy announcements.
The table below shows the percentage change of British Pound (GBP) against listed major currencies this week. British Pound was the weakest against the US Dollar.
| USD | EUR | GBP | JPY | CAD | AUD | NZD | CHF | |
|---|---|---|---|---|---|---|---|---|
| USD | 0.78% | -0.25% | 2.13% | 1.12% | 1.94% | 2.00% | 0.39% | |
| EUR | -0.78% | -0.98% | 1.44% | 0.40% | 1.32% | 1.28% | -0.33% | |
| GBP | 0.25% | 0.98% | 2.32% | 1.38% | 2.32% | 2.26% | 0.65% | |
| JPY | -2.13% | -1.44% | -2.32% | -1.01% | -0.19% | -0.12% | -1.63% | |
| CAD | -1.12% | -0.40% | -1.38% | 1.01% | 0.87% | 0.87% | -0.73% | |
| AUD | -1.94% | -1.32% | -2.32% | 0.19% | -0.87% | -0.04% | -1.63% | |
| NZD | -2.00% | -1.28% | -2.26% | 0.12% | -0.87% | 0.04% | -1.60% | |
| CHF | -0.39% | 0.33% | -0.65% | 1.63% | 0.73% | 1.63% | 1.60% |
The heat map shows percentage changes of major currencies against each other. The base currency is picked from the left column, while the quote currency is picked from the top row. For example, if you pick the British Pound from the left column and move along the horizontal line to the US Dollar, the percentage change displayed in the box will represent GBP (base)/USD (quote).
The Federal Reserve (Fed) lowered the policy rate by 25 basis points after the December meeting, as expected. The revised Summary of Economic Projections (SEP), also known as the dot plot, showed that Fed officials’ median view of the policy rate at end-2025 stood at 3.9%, up from 3.4% in September’s SEP. According to the projections, one of 19 officials see no cuts in 2025, three see one cut, 10 see two cuts, three see three cuts, one sees four cuts and one sees five cuts.
Fed Chairman Jerome Powell explained in the post-meeting press conference that stronger economic growth and lower unemployment would put them on a slower rate-cut path, adding that they can be cautious going forward. US Treasury bond yields surged higher in the Fed aftermath and boosted the US Dollar (USD), forcing GBP/USD to decline sharply.
The improving risk mood limits the USD’s gains and helps GBP/USD rebound in the European session on Thursday.
The BoE is widely expected to leave the policy rate unchanged at 4.75%. Since there will not be a press conference, the vote split could influence Pound Sterling’s valuation. If the decision to maintain status quo turns out to be a close call, with several policymakers voting in favor of a 25 bps rate cut, GBP/USD could turn south once again.
The Relative Strength Index (RSI) indicator on the 4-hour chart rises toward 50, reflecting sellers’ hesitancy. On the upside, 1.2700-1.2710 (100-period Simple Moving Average (SMA), Fibonacci 38.2% retracement of the latest downtrend, 200-period SMA) aligns as immediate resistance ahead of 1.2750 (Fibonacci 50% retracement) and 1.2800 (static level).
Looking south, first support could be spotted at 1.2620 (Fibonacci 23.6% retracement) before 1.2570 (static level) and 1.2500 (round level, static level).
The Pound Sterling registered decent gains of over 0.20% against the Japanese Yen in early trading during Wednesday’s North American session despite the lack of a catalyst boosting the former. The GBP/JPY trades at 194.46 after bouncing off daily lows of 192.49.
Price action remains slightly muted. Traders are awaiting the release of Gross Domestic Product (GDP) figures in the UK on Friday, which are expected to show an improvement in October’s figures.
The GBP/JPY recovered after falling over 4.58% in mid-November, hitting its lowest level since September at 188.06. However, buyers lifted the exchange rate well inside the Ichimoku Cloud (Kumo), clearing key technical resistance levels like the Tenkan-Sen and the Kijun-Sen.
Momentum picked up, showing that bulls are in charge, as depicted by the Relative Strength Index (RSI), which turned bullish, with the slope aiming higher.
If GBP/JPY clears the 200-day Simple Moving Average (SMA) at 194.74, further upside is seen. The 50-day SMA is next at 195.06. A breach of the latter exposes the top of the Kumo at 196.20-40.
Conversely, if GBP/JPY tumbles below the confluence of the Kijun-Sen and the Senkou Span B at around 193.95, the next support would be the 100-day SMA at 192.53 before testing the bottom of the Kumo at 191.75-95.
The table below shows the percentage change of British Pound (GBP) against listed major currencies today. British Pound was the strongest against the Japanese Yen.
| USD | EUR | GBP | JPY | CAD | AUD | NZD | CHF | |
|---|---|---|---|---|---|---|---|---|
| USD | 0.12% | 0.22% | 0.43% | -0.00% | 0.27% | 0.28% | 0.00% | |
| EUR | -0.12% | 0.09% | 0.32% | -0.12% | 0.15% | 0.16% | -0.11% | |
| GBP | -0.22% | -0.09% | 0.19% | -0.22% | 0.06% | 0.06% | -0.21% | |
| JPY | -0.43% | -0.32% | -0.19% | -0.44% | -0.16% | -0.17% | -0.42% | |
| CAD | 0.00% | 0.12% | 0.22% | 0.44% | 0.27% | 0.28% | 0.01% | |
| AUD | -0.27% | -0.15% | -0.06% | 0.16% | -0.27% | 0.00% | -0.26% | |
| NZD | -0.28% | -0.16% | -0.06% | 0.17% | -0.28% | -0.01% | -0.27% | |
| CHF | -0.01% | 0.11% | 0.21% | 0.42% | -0.01% | 0.26% | 0.27% |
The heat map shows percentage changes of major currencies against each other. The base currency is picked from the left column, while the quote currency is picked from the top row. For example, if you pick the British Pound from the left column and move along the horizontal line to the US Dollar, the percentage change displayed in the box will represent GBP (base)/USD (quote).
Silver price (XAG/USD) extends its losing streak for the sixth consecutive session, trading around $29.50 per troy ounce during the Asian hours on Thursday. The price of the grey metal depreciated more than 3% after the release of the Federal Reserve (Fed) interest rate decision on Wednesday.
The Federal Reserve (Fed) delivered a hawkish cut of 25 basis points (bps) at its December meeting, bringing its benchmark lending rate to a range of 4.25%-4.50%, a two-year low. Additionally, during the Press Conference, Fed Chair Jerome Powell made clear that the Fed will be cautious about further cuts as inflation remains stubbornly above the central bank’s 2% target.
The Summary of Economic Projections, often referred to as the “dot plot,” now anticipates only two rate cuts in 2025, a decrease from the four projected in September. This adjustment may be due to robust GDP growth and persistent inflation in the United States (US). Prolonged higher interest rates tend to negatively impact the demand for non-yielding assets like Silver.
Traders will likely observe the US weekly Initial Jobless Claims, Existing Home Sales, and final reading of Gross Domestic Product Annualized for the third quarter (Q3) due on Thursday. These data points could further shape the Fed’s monetary policy expectations.
Moreover, the Bank of Japan maintained its policy rate for the third consecutive meeting, keeping the short-term rate target within the range of 0.15%-0.25% after its two-day monetary policy review, in line with market expectations. Traders expect the Bank of England (BoE) to keep interest rates unchanged later in the day.
Additionally, the industrial outlook for Silver appears constrained due to overcapacity in China’s solar panel industry, prompting photovoltaic companies to join a government self-discipline program to regulate supply.
Silver is a precious metal highly traded among investors. It has been historically used as a store of value and a medium of exchange. Although less popular than Gold, traders may turn to Silver to diversify their investment portfolio, for its intrinsic value or as a potential hedge during high-inflation periods. Investors can buy physical Silver, in coins or in bars, or trade it through vehicles such as Exchange Traded Funds, which track its price on international markets.
Silver prices can move due to a wide range of factors. Geopolitical instability or fears of a deep recession can make Silver price escalate due to its safe-haven status, although to a lesser extent than Gold’s. As a yieldless asset, Silver tends to rise with lower interest rates. Its moves also depend on how the US Dollar (USD) behaves as the asset is priced in dollars (XAG/USD). A strong Dollar tends to keep the price of Silver at bay, whereas a weaker Dollar is likely to propel prices up. Other factors such as investment demand, mining supply – Silver is much more abundant than Gold – and recycling rates can also affect prices.
Silver is widely used in industry, particularly in sectors such as electronics or solar energy, as it has one of the highest electric conductivity of all metals – more than Copper and Gold. A surge in demand can increase prices, while a decline tends to lower them. Dynamics in the US, Chinese and Indian economies can also contribute to price swings: for the US and particularly China, their big industrial sectors use Silver in various processes; in India, consumers’ demand for the precious metal for jewellery also plays a key role in setting prices.
Silver prices tend to follow Gold’s moves. When Gold prices rise, Silver typically follows suit, as their status as safe-haven assets is similar. The Gold/Silver ratio, which shows the number of ounces of Silver needed to equal the value of one ounce of Gold, may help to determine the relative valuation between both metals. Some investors may consider a high ratio as an indicator that Silver is undervalued, or Gold is overvalued. On the contrary, a low ratio might suggest that Gold is undervalued relative to Silver.
With the full final week of 2024 almost drawing to a close, Gold price remains vulnerable near one-month lows below $2,600, licking the hawkish US Federal Reserve (Fed) policy decision-inflicted wounds.
Gold price extended its corrective decline from five-week highs of $2,726 and hit the lowest level in a month near $2,580 before rebounding toward $2,600, where it now wavers.
The primary reason behind the Gold price downside is the Fed’s cautious outlook on interest rate cuts in the face of US President-elect Donald Trump’s protectionist world, which is likely to be inflationary.
The US central bank lowered policy rate by 25 basis points (bps) to 4.25%-4.50% range, as widely expected. However, the Fed’s Statement of Economic Projections (SEP), the so-called Dot plot chart, forecast two quarter-percentage-point rate reductions by the end of 2025. That is half a percentage point less in policy easing next year than officials anticipated as of September.
The Fed policymakers project inflation jumping to 2.5% from 2.1% in their prior projections for the first year under the new Trump administration.
The hawkish Fed shift triggered a sharp rally in the US Treasury bond yields, which drove the US Dollar (USD) to over two-year highs against its major rivals. The US Dollar Index (DXY) surged to 108.27, its highest since November 2022.
Looking ahead, traders will react to the Fed’s hawkish cut outcome while awaiting the policy verdicts from the Bank of Japan (BoJ) and the Bank of England (BoE). Both central banks are expected to stand pat on interest rates, but their outlooks on the policy course next year will hold the key to market sentiment.
The US Dollar could take the lead from the USD/JPY price action following the BoJ policy announcements, impacting the USD-sensitive Gold price. However, any move is likely to be temporary, as the focus will remain on the latest Fed projections.
Gold traders will also look forward to the US data releases, including the third-quarter growth revision, Jobless Claims and Existing Home Sales data, for fresh trading impetus ahead of Friday’s US November PCE inflation report.
The daily chart shows that Gold price is testing the key 100-day Simple Moving Average (SMA) at $2,605 on its tepid recovery attempt early Thursday.
Recapturing that level on a daily closing basis is critical to unleashing additional recovery.
The next topside barrier is at the December 17 low of $2,633, followed by the 21-day Simple Moving Average (SMA) of $2,650.
The 14-day Relative Strength Index (RSI) has ticked up but remains below the 50 level, suggesting that Gold price remains a good selling opportunity on rebounds.
If the turnaround fizzles out, Gold sellers will again challenge the monthly low of $2,583.
The November 15 and 14 lows at $2,555 and $2,537, respectively, could come into play.
The recent retracement low on December 4 was at 2.98. That decline completed a 61.8% Fibonacci retracement at 3.02 and returned to the breakout area of a large symmetrical triangle pattern. This is classic bullish behavior as a prior resistance zone was successfully tested as support and an advance followed. The 20-Day MA (purple) has done a good job of marking dynamic support for the uptrend since it was reclaimed on October 29.
Recently, it was tested as support on multiple days, including yesterday. Although natural gas fell through the 20-Day line on six days recently, beginning with the December 4 low, it managed to close above the line each day. So, there was a fast recovery, which points to underlying demand.
There is the potential for a continuation to new trend highs, but the attempt to break out to new trend highs was cut short last week as resistance was seen around 3.56. That is where resistance was seen following the initial bull breakout on November 20. Tuesday’s reversal day showed strength that now needs further follow-through. Momentum will need to be strong enough during this rally to break through 3.56. Otherwise, natural gas could consolidate a bit before it is ready to attempt a trend continuation breakout.
On the downside, a drop through Tuesday’s low of 3.09 could lead to a retest of the 2.98 price zone and a decline below it. Also, a daily close below the 20-Day MA would be one sign of weakness. It is interesting to note that the rising 50-Day MA (orange), now at 2.88, is close to converging with the top trendline across the top of the triangle and it will likely be above in the coming days. That would improve the chance that support would be seen at or above the 50-Day line if a deeper correction develops.
For a look at all of today’s economic events, check out our economic calendar.
The British Pound found near-term support earlier in the day, leading to GBP/USD reaching an intraday high of 1.2725. The trigger was the United Kingdom (UK) Consumer Price Index (CPI), which rose 2.6% on a yearly basis in November after printing at 2.3% growth in October, according to the data released by the Office for National Statistics (ONS) on Wednesday.
Core CPI (excluding volatile food and energy items) rose by 3.5% YoY in November, compared to a 3.3% increase in October while below the market consensus of 3.6%. Services inflation stayed unchanged at 5.0% YoY in November.
The pair held above 1.2700 afterwards, then collapsed after the United States (US) Federal Reserve (Fed) announced that it lowered the policy rate, federal funds rate, by 25 basis points to the range of 4.25%-4.5%.
The Fed made minor changes to its policy statement from the November meeting. Still, the dot-plot shows policymakers foresee now just two rate cuts in 2025, resulting in a hawkish cut that boosted demand for the US Dollar in a risk-averse environment.
The Bank of England (BoE) announces its interest rate decision at the end of its eight scheduled meetings per year. If the BoE is hawkish about the inflationary outlook of the economy and raises interest rates it is usually bullish for the Pound Sterling (GBP). Likewise, if the BoE adopts a dovish view on the UK economy and keeps interest rates unchanged, or cuts them, it is seen as bearish for GBP.
Next release: Thu Dec 19, 2024 12:00
Frequency: Irregular
Consensus: 4.75%
Previous: 4.75%
Source: Bank of England
Speculative interest holds its breath on Wednesday, resulting in little action across the FX board. Investors await the Federal Reserve’s (Fed) monetary policy announcement as the central bank ends its two-day meeting. United States (US) policymakers are expected to cut the main interest rate by 25 basis points (bps) and share their views on key macroeconomic indicators and the future of monetary policy through the Summary of Economic Projections (SEP) or dot-plot.
Finally, Chairman Jerome Powell will offer a press conference. Market players will be looking for clues on upcoming decisions, while Powell will do as usual and pour cold water on any speculation that can disrupt the market’s behaviour.
Generally speaking, the US Dollar (USD) is strong across the FX board, trading near its weekly highs against most major rivals. The basic idea of the market reaction following the aforementioned events is whether the outcome is dovish or hawkish. A hawkish central bank tends to translate into a stronger local currency, while the opposite scenario is also valid, with a dovish stance resulting in a weaker currency. Things, however, are never that straightforward.
The Fed is expected to cut rates (dovish) while delivering a hawkish message. The hawkish cut is priced in, and the market will react to 2025 expectations.
Technically, the daily chart for the XAU/USD pair shows the pair is down for a second consecutive day, although it is holding above the weekly low set at $2,633. In the same chart, a flat 20 Simple Moving Average (SMA) provides dynamic resistance at around $2,655. The 100 and 200 SMAs keep heading higher, well below the current level, limiting the long-term bearish potential. Finally, technical indicators are neutral-to-bearish, developing around their midlines and failing to provide clear directional clues.
The 4-hour chart shows that the risk skews to the downside. The XAU/USD pair trades below all its moving averages, while the 20 SMA is heading firmly lower after crossing below directionless 100 and 200 SMAs. At the same time, technical indicators gain downward traction within negative levels, supporting a fresh leg lower beyond the $2,633 weekly low.
Support levels: 2,633.00 2,617.90 2,603.15
Resistance levels: 2,643.40 2,657.30, 2,672.70
According to licensed trading platforms, the Euro continues to be negatively impacted against other major currencies due to the political and economic uncertainty of the Eurozone’s largest economies – Germany and France – at a time when the bloc’s economy is generally weak. The European Central Bank has been forced to ease its monetary policy. The latest setback for the Euro came from Germany, where German Chancellor Olaf Scholz lost a confidence vote, leading to elections likely to be held on February 23. In France, new French Prime Minister François Bayrou must quickly form a government and assemble a 2025 budget.
During yesterday’s trading, according to stock trading platforms, European stock markets stumbled amid weak investor sentiment and anticipation of the release of Eurozone inflation figures and the US Federal Reserve’s policy decision. According to the trading, the Eurozone STOXX 50 index fell by 0.1% to 4943 and the STOXX 600 index for all European stocks fell by 0.4% to 514.
The most notable performance was the decline of financial company stocks, with shares of Santander, Intesa Sanpaolo, and BBVA losing between 4% and 1.5%. Meanwhile, low oil prices caused shares of TotalEnergies and Eni to decline by 1.2% and 2.4%, respectively. On the other hand, ASML shares closed with a sharp rise of 2%. Overall, European stock indices recorded lower performance in 2024 compared to US stock indices, which benefited from their high focus on technology stocks. The STOXX 600 index rose by only 7.2% in 2024 compared to gains of the S&P 500 index, which reached 27%.
The euro is under pressure and could continue for some time, so any bounce higher could be a chance to sell the euro again this week, which will be fateful for the euro’s closings in 2024.
It is not surprising to see another gloomy economic reading from Germany, but better days are ahead, according to one economist. A leading sentiment survey in Germany shows that the Eurozone’s largest economy is no closer to exiting the recession, although 2025 brings hope as the new government has no choice but to invest. According to economic calendar data, the German Ifo business climate index fell to 84.7 points in December, down from 85.6 points in November. This was the lowest level since May 2020 and the decline was due to more pessimistic expectations, although German companies assessed the current situation as better.
Manufacturing: The index declined significantly, with German companies expressing less satisfaction with their current business and significantly more pessimistic expectations. Also, Order books deteriorated, and production cuts were announced.
Services sector: The business climate index deteriorated due to more sceptical expectations, but the current situation was assessed as somewhat better. The restaurant sector reported positive Christmas business, while the transport and logistics sector are concerned about the coming months.
Understanding the IFO Survey: The German IFO business climate index is based on nearly 9,000 monthly responses from companies in manufacturing, services, trade and construction. Through it, companies provide assessments of their current business situation and their expectations for the next six months. Finally, the index is calculated using the balance of responses and normalized to the average of 2015.
We still emphasize the strength of the downward trend in the Euro against the US Dollar EUR/USD and that approaching around and below the support level of 1.05 continues to stimulate more bear control over the trend. Therefore, If the US economic releases and the Federal Reserve Bank announcement are in favour of the strength of the dollar. More selling pressures may collide with the support levels of 1.0420 and 1.0300 respectively. From there, technical indicators may start giving strong oversold signals, led by the Relative Strength Index (RSI) and the momentum indicator.
Conversely, if the data supports the Euro, the downward trend of the Euro-Dollar will not be broken without returning to the resistance levels of 1.0665 and 1.0800, respectively. Overall, we still adhere to the strategy of selling the Euro-Dollar but without taking risks and activating take-profit and stop-loss orders to ensure the safety of the trading account from any sudden price reversals.
Ready to trade our daily EUR/USD Forex analysis? We’ve made this forex brokers list for you to check out.