The main category of Forex News.
You can use the search box below to find what you need.
[wd_asp id=1]
The main category of Forex News.
You can use the search box below to find what you need.
[wd_asp id=1]
EUR/USD closed in negative territory on Tuesday and continued push lower toward the 1.0500 area early Wednesday, pressured by the renewed US Dollar (USD) strength. As market focus shifts to November Consumer Price Index (CPI) data from the US, the pair’s technical outlook points to a bearish tilt in the near term.
The table below shows the percentage change of Euro (EUR) against listed major currencies this week. Euro was the weakest against the US Dollar.
| USD | EUR | GBP | JPY | CAD | AUD | NZD | CHF | |
|---|---|---|---|---|---|---|---|---|
| USD | 0.72% | 0.04% | 1.14% | 0.23% | 0.59% | 1.22% | 0.75% | |
| EUR | -0.72% | -0.66% | 0.54% | -0.41% | -0.04% | 0.58% | 0.11% | |
| GBP | -0.04% | 0.66% | 1.04% | 0.26% | 0.62% | 1.25% | 0.78% | |
| JPY | -1.14% | -0.54% | -1.04% | -0.95% | -0.48% | -0.06% | -0.32% | |
| CAD | -0.23% | 0.41% | -0.26% | 0.95% | 0.40% | 0.99% | 0.52% | |
| AUD | -0.59% | 0.04% | -0.62% | 0.48% | -0.40% | 0.62% | 0.15% | |
| NZD | -1.22% | -0.58% | -1.25% | 0.06% | -0.99% | -0.62% | -0.48% | |
| CHF | -0.75% | -0.11% | -0.78% | 0.32% | -0.52% | -0.15% | 0.48% |
The heat map shows percentage changes of major currencies against each other. The base currency is picked from the left column, while the quote currency is picked from the top row. For example, if you pick the Euro from the left column and move along the horizontal line to the US Dollar, the percentage change displayed in the box will represent EUR (base)/USD (quote).
Rising US Treasury bond yields helped the USD outperform its rivals in the American session on Wednesday. Moreover, the risk-averse market environment allowed the currency hold its ground, causing EUR/USD to stretch lower.
The annual CPI inflation in the US is forecast to rise to 2.7% in November from 2.6% in October. On a monthly basis, the core CPI is expected to rise 0.3%, matching October’s increase. In case the monthly core CPI reading comes in above analysts’ estimate, the immediate reaction could boost the USD and drag EUR/USD lower. On the flip side, a reading of 0.2% lower in this data could have the opposite effect on the pair’s action.
On Thursday, the European Central Bank (ECB) will announce monetary policy decisions. Hence, EUR/USD’s reaction to US inflation data could remain short-lived.
EUR/USD dropped below 1.0520, where the 100-period Simple Moving Average (SMA) on the 4-hour chart meets the Fibonacci 23.6% retracement of the latest downtrend. Meanwhile, the Relative Strength Index (RSI) indicator turned south and fell below 40, reflecting a buildup of bearish momentum.
In case EUR/USD confirms 1.0520 as resistance, technical sellers could remain interested. In this scenario, 1.0440 (static level) could be seen as the next support before 1.0400 (end-point of the downtrend).
On the other hand, sellers could be discouraged if EUR/USD manages to reclaim 1.0520 and allow the pair to extend its recovery toward 1.0600 (Fibonacci 38.2% retracement) and 1.0630 (200-period SMA).
Gold’s price is on a solid recovery, flirting with two-week highs just above $2,700 early Wednesday. However, the further upside in gold price hinges on the release of the US Consumer Price Index (CPI) data, which will likely set the pace for the US Federal Reserve’s (Fed) early next year.
Heading into the US CPI showdown, markets are pricing in an 86% chance that the Fed will lower interest rates by 25 basis points (bps) next week, according to the CME Group’s FedWatch Tool. Meanwhile, the odds for another quarter percentage point rate reduction in January stand at 22%.
Amidst looming tariffs announced by US President-elect Donald Trump and loosening labor market conditions, the US inflation report will be critical to determining the Fed’s easing trajectory in the coming months. This will impact the value of the US Dollar (USD) and the non-yielding Gold price.
US CPI is seen rising 2.7% year-on-year (YoY) in November after reporting a 2.6% growth in October. The core annual inflation will likely remain at 3.3% in the same period. On a monthly basis, US CPI and core CPI are expected to have increased by 0.3% last month.
Gold price has witnessed an impressive recovery from eight-day lows so far this week, sitting at the highest level since November 25. This is courtesy of the ongoing Middle East geopolitical tensions and the resumption of the People’s Bank of China (PBOC) buying gold reserves.
The Chinese central bank on Saturday said it bought 160,000 fine troy ounces in November, ending a six-month pause in purchases. Meanwhile, the sudden collapse of the Syrian government over the weekend rattled markets, with investors scurrying for safety in the traditional store of value Gold price.
According to the latest developments, Israel Defense Forces (IDF) carried out attacks on Syria’s naval fleet as part of its efforts to neutralise military assets in the country after the fall of the Assad regime, per BBC News.
The daily chart shows that the Gold price broke the consolidative phase to the upside after recapturing the key 50-day Simple Moving Average (SMA) at $2,670 on a daily closing basis on Tuesday.
The 14-day Relative Strength Index (RSI) points north above the midline, suggesting that more gains remain in the offing.
A softer-than-expected US CPI inflation data could reinforce Fed rate cut expectations in the coming months, driving Gold price toward the November 25 high of $2,721.
The next bullish target is $2,750, the confluence of the psychological barrier and the November 5 high.
Fresh buying opportunities will likely emerge on a sustained move above the latter, calling for a test of the record high of $2,790.
In case the inflation data surprises to the upside, Gold price could face fresh headwinds, with sellers likely to test the 50-day SMA resistance-turned-support at $2,670.
The next relevant downside cap is seen at the 21-day SMA at $2,638, below which the previous week’s low of $2,613 will be challenged.

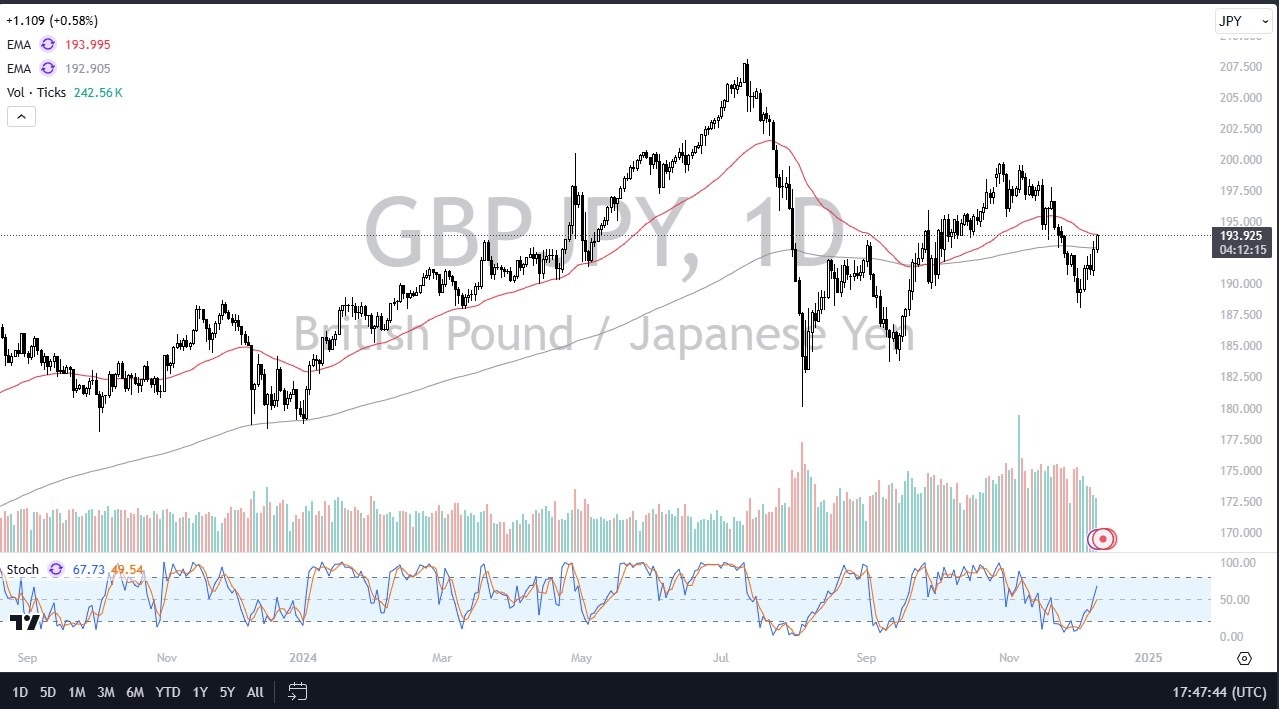
The technical analysis for the GBP/JPY pair is worth noting, as we are hanging around the 50 Day EMA indicator. If we can break above here, that’s yet another reason to think that the British pound will continue to ascend against the Japanese yen, but quite frankly it’s probably more important to keep in the back of your mind that the Japanese yen itself is getting pummeled by just about everything out there. This even includes the lonely Swiss franc!
Now that we are above the 200 Day EMA and we are starting to see the Stochastic Oscillator reach toward the high, I think we are going to see more momentum come into the picture. I think that the consolidation is over with after the massive drop, and it would not surprise me at all to see the British pound goes looking to the ¥200 level. I don’t think this is an easy move, nor do I think it happens overnight. However, in the meantime I think that we have got a situation where most traders are going to be looking for buying opportunities on short-term pullbacks. With this, think you need to be somewhat diligent with your position sizing, building up as you go along. If we were to somehow break above the ¥200 level, again something I’m not expecting to see this week, that opens up the next leg higher.
On the other hand, if we were to turn around a breakdown below the ¥191.50 level, then I think we might be in a little bit of trouble. I would also expect to see that JPY is strengthening almost everything else, something that you did a few weeks ago.
Ready to trade our daily Forex analysis? Here are the best regulated trading platforms UK to choose from.
In this article 10 market predictions for 2025 we focus on 10 markets that we predict to develop a bullish trend in 2025. We cover stocks, obviously precious metals and a few select commodities.
Additionally, we indicate that the most intense periods of 2025 will be:
We expect strong moves to develop in those 3 to 6 weeks periods.
Note – We exclude crypto from this article. While very bullish crypto, it is a separate asset class, not in scope of this article.
Sector rotation has been the dominant trend in markets since the turning point October 13th, 2022.
Trends have been developing in specific sectors, mostly short-lived, with trend continuation after a few months.
This dominant market trend is set to continue to dominate markets in 2025.
Investing strategies should factor in sector rotation.
Source: Dow Jones Forecast For 2025.
The Dow Jones is predicted to be directionally bullish.
Our Dow Jones forecast 2025 is a trading range between 38,000 and 44,000.
Large caps will benefit from rising future earnings. Moreover, a gradual decrease in inflation combined with current interest rates benefit large caps.
Source: S&P 500 Forecast For 2025.
The long term and medium term S&P 500 chart structures show a dominant bullish pattern.
Moreover, future earnings combined with economic data and consumer spending underpin a bullish outlook for the S&P 500.
This justifies a bullish S&P 500 forecast for 2025. That’s why we believe the S&P 500 will move in a range between 5,350 and 6,350 points in 2025.
While the S&P 500 should do well, juicy opportunities should be presented in the mid-cap space which is set to benefit from improving market breadth!
Source: Bullish Nasdaq Prediction 2025 & The 20-Year Nasdaq Chart.
The Nasdaq Index has been leading the charge in 2023, until early July 2024. Since then, the Nasdaq has been lagging.
In 2025, the Nasdaq is predicted to continue resuming its leadership position. The Nasdaq bull run is set to continue.
The Nasdaq is forecasted to move to the 22,220 area in 2025, based on its 20-year chart pattern.
The long term Nasdaq charts are absolutely phenomenal, worth checking out by clicking the above mentioned hyperlink.
Source: Japanese Nikkei 225 Index Historic Chart.
The Nikkei 225 is expected to become very volatile, especially in the 2nd half of 2025. This is one of the more unusual forecast among our 10 market predictions for 2025.
The Nikkei 225 historic chart over 50 years shows a giant secular pattern while the 25-year chart highlights a decision time window.
The decision window of the 50-year Nikkei 225 chart is completing in the first months of 2026. This means that 2025 will be a year in which the market will look for resolution of this gigantic pattern.
Our Nikkei 225 prediction is centered around the idea that chart dynamics will dominate in 2025.
Source: Gold Price Prediction 2025.
Gold is forecasted to move closer to, and even temporarily exceed, 3000 USD an Ounce.
The price of gold might approach $3,000 in 2025 and exceed $3,000 in 2026. Eventually, gold could approach $5,000 by 2030.
The gold prediction suggests that dominant dynamics in the gold market will be monetary easing, a weak USD, gold secular chart dynamics. Because of this, the gold price is set to move higher in 2025.
Interestingly, we predict that tokenized gold will do well in 2025.
Tokenization should become a major trend in 2025. If materialized, tis implies that tokenized gold, tokenized silver, tokenized real estate, could become booming business. That’s the basis for a crypto narrative in 2025, as explained in this article: Which Cryptocurrencies Will Be Explosive in 2025?
Source: Will Silver Hit $50 An Ounce in 2025? and Silver Price Prediction 2025.
2025 will likely be the year in which silver will approach its former ATH.
We explained the drivers for this bullish thesis here: 5 reasons to believe silver is the opportunity of the decade. Moreover, shorter term, we emphasized silver’s massive upside potential, backed up by leading indicator analysis.
Silver can and will hit $50 an Ounce, the only question is WHEN. On September 18th, 2024, silver confirmed its short term breakout which implies that silver is on its way to $50, probably in early to mid-2025.
The price of silver is working its way higher currently, in a structure characterized by several layers of resistance.
So far, silver has shown its ability to penetrate all those layers, one by one, at a slow pace.
This silver trend is set to continue in 2025 is the basis of our bullish silver forecast.
Readers should keep a close eye on the long term oriented posts in the $silver cash tag, filter out short term oriented info though.
Source: Sugar Price Forecast 2025.
A rise of 50% in the price of sugar? Is this realistic.
Oh yes, for sure. This is what we wrote in our most recent sugar forecast update:
On September 20th, 2024, sugar confirmed our bullish silver forecast 2025 after it bounced sharply from its critical $18 cents per pound level. A rise in the price of sugar to $36 cents in 2025 is likely.
It’s the sugar chart combined with its fundamentals that paint a bullish picture for sugar in 2025.
Source: Coffee Price Prediction 2025.
The price of coffee is expected to steadily rise in 2025.
The most bullish scenario suggests $3.40 per pound which is 37% above current levels.
This bullish outlook is supported by solid coffee fundamentals which has proven to be a very reliable leading indicator and strongly correlated to the price of coffee over the years.
Source: Lithium – A New Booming Trend As Of 2025?
We predict that the lithium market will start working on a nice long term bottom in 2025.
This should present investors with a long term focus with nice entry opportunities, maybe even ahead of 2025, provided spot lithium does not move lower from here.
The 10 market predictions for 2025, outlined in this article, are available on our blog. They will be updated on a regular basis. We encourage readers to sign up to our premium services, particularly gold & silver as well as our crypto research, for very specific market insights and timely alerts.
Silver price climbed some 0.19% on Tuesday yet failed to clear the $32.00 hurdle after hitting a three-week high of $32.27 at the beginning of the week. At the time of writing, XAG/USD trades at $31.89 as Wednesday’s Asian Pacific session commences.
Mounting speculation about a potential Federal Reserve interest rate cut next week is driving market sentiment. The release of US inflation data on Wednesday is expected to provide clearer insights into the Fed’s monetary policy trajectory.
After briefly climbing above $32.00, XAG/USD retreated and is now consolidating within the $31.75–$32.00 range, with the 50-day Simple Moving Average (SMA) at $31.75 serving as key support.
The price action suggests the formation of a “double bottom” chart pattern, which remains just short of its minimum target of $33.50. A decisive break above the $32.00 resistance level could strengthen bullish momentum, paving the way toward $33.00 and ultimately the “double bottom” target.
On the other hand, if XAG/USD falls below the 50-day SMA, sellers may gain control, potentially driving prices toward the low $31.00 range. A further decline past this level could bring the 100-day SMA at $30.47 into focus.
Silver is a precious metal highly traded among investors. It has been historically used as a store of value and a medium of exchange. Although less popular than Gold, traders may turn to Silver to diversify their investment portfolio, for its intrinsic value or as a potential hedge during high-inflation periods. Investors can buy physical Silver, in coins or in bars, or trade it through vehicles such as Exchange Traded Funds, which track its price on international markets.
Silver prices can move due to a wide range of factors. Geopolitical instability or fears of a deep recession can make Silver price escalate due to its safe-haven status, although to a lesser extent than Gold’s. As a yieldless asset, Silver tends to rise with lower interest rates. Its moves also depend on how the US Dollar (USD) behaves as the asset is priced in dollars (XAG/USD). A strong Dollar tends to keep the price of Silver at bay, whereas a weaker Dollar is likely to propel prices up. Other factors such as investment demand, mining supply – Silver is much more abundant than Gold – and recycling rates can also affect prices.
Silver is widely used in industry, particularly in sectors such as electronics or solar energy, as it has one of the highest electric conductivity of all metals – more than Copper and Gold. A surge in demand can increase prices, while a decline tends to lower them. Dynamics in the US, Chinese and Indian economies can also contribute to price swings: for the US and particularly China, their big industrial sectors use Silver in various processes; in India, consumers’ demand for the precious metal for jewellery also plays a key role in setting prices.
Silver prices tend to follow Gold’s moves. When Gold prices rise, Silver typically follows suit, as their status as safe-haven assets is similar. The Gold/Silver ratio, which shows the number of ounces of Silver needed to equal the value of one ounce of Gold, may help to determine the relative valuation between both metals. Some investors may consider a high ratio as an indicator that Silver is undervalued, or Gold is overvalued. On the contrary, a low ratio might suggest that Gold is undervalued relative to Silver.
There are also three recent upswings (red arrow) where crude oil exceeded the 20-Day line. That could still happen with the current attempt to strengthen, but until it does the 20-Day line is a key short-term upside pivot. In other words, the 20-Day line has been reflecting short-term resistance. This is bearish behavior unless there is a decisive and sustained advance above the 20-Day MA pivot, followed by a daily close above it.
The bottom boundary line that represents support for a small symmetrical triangle pattern was confirmed again recently as support. The price of crude was rejected to the upside from the line last Friday and again yesterday. This is a notification that the line is valid and may represent support in the future. Although a breakout above the 20-Day line may trigger, crude will remain within the triangle formation until it rises above the top line of the triangle, which is purple.
There is also a recent interim swing high at 70.68 that may provide a more useful pivot, not only because it further confirms the triangle breakout, but it also gives a trend reversal signal. In addition, the 50-Day MA pivot currently marks the same price area. The top line is purple because it also represents a boundary for a possible falling bull wedge pattern. A purple line also marks the lower boundary (green arrows) of the pattern. Therefore, an upside breakout of the top line for the triangle also provides an initial breakout signal for a bull wedge.
Volatility could increase soon if the triangle pattern proves valid as the apex is on January 3. This suggests that a spike in volatility, represented by a breakout of the patterns, either up or down, before the end of the year. Let’s see what happens.
For a look at all of today’s economic events, check out our economic calendar.
As detailed in my previous article, USDJPY, Silver Forecast: Bullish Rebounds in Question, several bullish indicators emerged on Friday as USDJPY tested the 148.60 support level. This coincided with positive technical setups and market sentiment leaning towards a BOJ rate hike after the Fed’s expected rate cut in mid-December. Volatility risks remain on the horizon with US inflation data.
US indices started the year strong, recording successive highs before capping 2024 with December’s anticipated Santa Claus rally and New Year effect. This aligns with bullish momentum for Trump’s presidency.
Despite these highs, the Dow Jones faces bearish correction pressures from the 45,000 zone, driven by inflationary concerns, geopolitical instability, and profit-taking ahead of the holidays. As markets brace for 2025, the combination of these risks and uncertainties under Trump’s leadership sets the stage for volatility.


Source: Tradingview
USDJPY is still holding a bullish rebound from the key support at 148.60. The bullish indicators supporting the setup are:
If the 148.60 low holds firm, the next resistance is at 153.30, aligning with the lower boundary of the long-term trendline connecting consecutive lows from January 2023 to 2024. Longer-term resistance levels include 155, 157 and 160, reflecting significant Yen weakness and potential BOJ intervention risks. From the downside, the next level to watch at 146.80 in the event of further downside. Deeper declines could retest levels 144 and 140.

Source: Tradingview
For a longer-term technical analysis of the Dow chart, the details are published in the following article EURUSD, Dow Forecast: On Edge Ahead of Key US Data
On the daily time frame, the Dow is consolidating near the 45,000 level, forming another top amid overbought RSI conditions and negative divergence. The psychological implications of the 45,000 mark and its Fibonacci extension reinforce the significance of this zone.
The 4H RSI reflects a rebound potential, aligning with recorded highs at 44,300 in November.
Upside momentum could resume with a firm close above 45,200, eyeing resistance at 47,000. Conversely, a break below 44,280 could extend retracement towards 43,300, 42,200, and 41,500.

Source: Tradingview
As previously mentioned in EURUSD, Nasdaq Forecast: Inflation Data and Holiday Volatility, Nasdaq fell short of the 2,700-mark on Monday following momentum slowdowns in the Dow and S&P ahead of the US CPI and FOMC meeting.
The 4H RSI, displayed on the daily chart, reflects a retest of the neutral zone as the price tests 21,400 support.
Further upside can be confirmed with a close above 21,800, eyeing resistance at 22,800. A break below 21,280 could deepen corrections to 21,140, 20,800, and 20,300, aligning with the bottom border of the primary uptrend since October 2022 lows.
— Written by Razan Hilal, CMT on X:@Rh_waves and Forex.com Youtube
Spot Gold maintains its bullish route on Tuesday, extending gains beyond the $2,680 threshold on the back of a dismal market mood. The US Dollar (USD) suffered some modest losses throughout the first half of the day, but demand for safety accelerated in the American session, benefiting the Greenback against high-yielding assets yet not against Gold.
The poor performance of European stocks and upcoming first-tier events further pushed speculative interest into adopting a cautious approach. On Wednesday, the United States (US) will release the November Consumer Price Index (CPI), and investors hope they can collect hints on what the Federal Reserve (Fed) may do when it meets next week. The Fed is widely anticipated to trim the benchmark interest rate by 25 basis points (bps) and inflation needs to be out of the rook to actually force them to proceed with a more aggressive cut, an unlikely scenario.
But it is not just about the Fed. Almost all major central banks will announce their decisions on monetary policy in the upcoming days. The Reserve Bank of Australia (RBA) was the first one early Tuesday, delivering no big surprises as the Board left the Official Cash Rate (OCR) unchanged at 4.35% as expected. The Bank of Canada (BoC) will come next, followed by the European Central Bank (ECB) on Thursday.
Central banks are struggling to return to normal interest rate levels while keeping inflation tamed and protecting economic growth. Indeed, the latter is out of their mandate, yet policymakers can’t play blind and deaf on soft economic progress and the risks of upcoming recessions. Their decisions will shed some light on what 2025 may bring regarding monetary policy.
Meanwhile, the XAU/USD pair holds on to early gains and trades near the $2,690 mark. In the daily chart, technical readings favor an upward extension, given that the pair keeps recovering above a now mildly bullish 20 Simple Moving Average (SMA), while the 100 and 200 SMAs recovered their bullish poise below the shorter one. At the same time, technical indicators gain upward traction within positive levels, reflecting increased buying interest.
In the near term, and according to the 4-hour chart, the risk also skews to the upside. XAU/USD is above a flat 200 SMA for the first time in the month, while the 20 and 100 SMA advance below it, converging around $2,650. Finally, technical indicators develop near overbought reading with modest upward strength, but still heading north. Overall, XAU/USD seems poised to extend gains towards its record high in the $2,790 region.
Support levels: 2,676.30 2,662.50 2,650.40 2
Resistance levels: 2,693.70 2,704.35 2,722.60
The EUR/USD failed to hold ono its earlier gains on Monday, turning lower into the close. It has fallen further so far in today’s session with the European Central Bank’s rate decision and key US inflation data on the horizon. These events come just ahead of the Federal Reserve’s own rate decision, setting the stage for a pivotal couple of weeks. We think that the EUR/USD outlook leans modestly bearish, especially after Monday’s market optimism—fuelled by potential stimulus in China—provided a short-lived relief for risk assets.
After announcing plans to adopt a “moderately loose” policy next year, fulling a rally in the likes of the AUD and China-linked stocks, it was China again which caused these moves to unwind. This time, it was data reminding everyone how weak the world’s second largest economy has become, and the need for the government to unleash monetary and fiscal support, just as concerns rise over potential trade tariffs from incoming US President Trump.
China’s latest trade figures reveal a sharp slowdown in export growth, rising 6.7% year-on-year to $312.3 billion. This marks a significant drop from October’s 12.7% expansion and falls short of the 8.5% growth forecast. On the import front, the picture is even more concerning. Imports contracted by 3.9%, the steepest decline since September 2023, defying expectations of a modest 0.3% increase.
These figures suggest weakening global demand for Chinese goods, as businesses reduce reliance on China amid concerns over potential trade tariffs from Trump. Domestically, sluggish import activity points to softer demand despite recent economic stimulus efforts. The data is bad news for Eurozone exports to China, and therefore another negative influence for the euro, even if the country has signalled more stimulus measures are on the way. On that front, investors will now focus on the Central Economic Work Conference, starting Wednesday, for more details on China’s fiscal strategies.
Ahead of the ECB’s rate decision, US inflation data will dominate midweek, with CPI due Wednesday and PPI on Thursday. CPI is expected to edge up to 2.7% year-over-year from 2.6%, serving as the final major data release before the Federal Reserve meets.
While the December rate decision likely won’t hinge on this CPI print, an unexpectedly hot number could shape the Fed’s stance for early 2025. Following Friday’s softer-than-expected NFP report, markets are now pricing in an 87% chance of a December rate cut, up from 70% last week. So far, this hasn’t significantly swayed the EUR/USD direction, but it has kept the upside limited, suggesting investors continue to prefer the dollar because of Trump’s forthcoming policies in 2025 expected to boost spending and cut taxes, thus keeping inflation risks alive. Against this backdrop, we maintain a bearish EUR/USD outlook.
The next focal area of the EUR/USD traders will be the European Central Bank’s rate decision on Thursday. Analysts anticipate the ECB will implement a standard 25-basis-point rate cut at this meeting, bringing the deposit rate down to 3.15% from 3.40%. While there were whispers of a larger 50-bps cut, a more gradual approach seems likely, leaving the door open for additional rate reductions in 2025.
Monday’s release of Sentix Investor Confidence data could strengthen the case for more dovish policies. Beyond economic indicators, political uncertainty is also weighing on growth prospects, as budget talks in Berlin and Paris recently collapsed. If the ECB is more dovish than markets anticipate, the EUR/USD outlook could become even more bearish.

Source: TradingView.com
As per the 4-hour chart, price action continues to look heavy for the EUR/USD. The pair has repeatedly tested the 1.06 resistance zone (1.0595–1.0610) without securing a decisive break above it. A break above this range could trigger a short-squeeze rally toward 1.0700, with further targets around 1.0775/80. For now, however, the bulls remain on standby without a clear reversal signal.
In fact, the downside risks are still greater and if the bullish trend line breaks, then that could put the bulls in a spot of bother. One particular area to watch is the 1.0500 support zone, which remains critical. A break below there could resume the bearish trend that began in September. For me the trigger is at 1.0472, which was the last low made prior to the most recent up move. A potential break below it could target the liquidity around 1.0333, the November low, followed by psychological levels like 1.0300 and 1.0200, potentially revisiting parity.
The EUR/USD outlook stays modestly bearish, with selling pressure likely to return unless the ECB delivers a surprisingly hawkish message or US CPI figures are significantly softer than expected – unlikely on both fronts.
— Written by Fawad Razaqzada, Market Analyst
Follow Fawad on Twitter @Trader_F_R
Four out of the past last five days tested support around the 20-Day and each time natural gas fell below the line earlier in the session it traded back above the line by the close. That should be the same situation today. If dynamic support is retained at or above the 20-Day line, natural gas is primed to continue higher. It has been attempting to establish a bottom for the current pullback. But it has not yet made a clear break off that bottom that should engender confidence in the bullish reversal with signs of more aggressive buying.
A bullish reversal was triggered yesterday on the weekly chart (not shown). The trigger indicates strengthening in demand for natural gas and it provides another piece of evidence supporting a bullish continuation of the rising trend and the likelihood that the bearish correction may have bottomed out.
The uptrend that begins from the February 2024 trend low triggered a breakout recently on a rally above the 3.02 swing high on November 20. That was concurrent to a symmetrical triangle breakout. Each would be a valid signal on its own but when they occur together the assumption is that upside follow-through should occur with improved momentum.
After today, strength will be indicated on a rally above today’s high of 3.19 and further still on a move above Monday’s high of 3.32. The internal uptrend that is nearby can be used as a guide as it was previously representing support during the way up. It was specifically tested as resistance last Thursday before the gap up opening on Monday.
For a look at all of today’s economic events, check out our economic calendar.