The main category of Forex News.
You can use the search box below to find what you need.
[wd_asp id=1]
The main category of Forex News.
You can use the search box below to find what you need.
[wd_asp id=1]
The US Dollar is up more than 2.1% off the monthly low against the Japanese Yen with USD/JPY rebounding off key testing support into the December open. The recovery has now extended into technical resistance at the November downtrend with major US inflation data on tap tomorrow. Battle lines drawn on the USD/JPY short-term technical charts.
Review my latest Weekly Strategy Webinar for an in-depth breakdown of this Yen setup and more. Join live on Monday’s at 8:30am EST.
Chart Prepared by Michael Boutros, Sr. Technical Strategist; USD/JPY on TradingView
Technical Outlook: In last month’s Japanese Yen Technical Forecast we noted that USD/JPY was testing the median-line support and that, “the immediate focus is on a breakout of the weekly opening-range for guidance with the near-term threat lower while below 155.” Price broke lower the following week with USD/JPY plunging nearly 5.2% off the November high.
The decline rebounded off confluent support last week at the 2022 weekly high-close / 2023 high-week close (HWC) at 148.73-149.60. The immediate focus is on this recovery with the bulls testing confluent resistance today at 151.74/99– a region defined by the 38.2% retracement of the November decline, the 2022/2023 highs and the 200-day moving average. Looking for a possible reaction off this mark over the next few days.

Chart Prepared by Michael Boutros, Sr. Technical Strategist; USD/JPY on TradingView
A closer look at Japanese Yen price action shows USD/JPY trading within the confines of a descending pitchfork extending off the November highs with the upper parallel further highlighting resistance here at 151.74/99. A topside breach would expose the May low-day close (LDC) / 61.8% retracement at 153.02/40 backed by the November high-day reversal close at 154.34– a breach / close above this threshold would be needed to suggest a more significant low was registered last week / a larger trend reversal is underway.
A break below this key support zone would threaten resumption of the November downtrend towards the median-line (currently ~148), with subsequent objectives seen at 146.13/65 and the August low-day close (LDC) / January low-week close (LWC) at 144.17/63– both levels of interest for possible exhaustion / price inflection IF reached.

Bottom line: USD/JPY is rebounding off technical support into the start of the month with the advance now testing the first major resistance hurdle- looking for possible inflection here. From a trading standpoint, the focus is on a breakout of the weekly opening range (149.60-151.99) for guidance with the near-term recovery vulnerable while below the 200-day moving average.
Keep in mind we get the release of key US inflation data tomorrow with the November Consumer Price Index (CPI) on tap. Stay nimble into the release and watch the weekly close here for guidance. Review my latest Japanese Yen Weekly Forecast for a closer look at the longer-term USD/JPY technical trade levels.

Economic Calendar – latest economic developments and upcoming event risk.
— Written by Michael Boutros, Sr Technical Strategist
Follow Michael on X @MBForex
Silver price (XAG/USD) retreats from $32.00 per troy ounce during the European session on Tuesday. However, the price of the grey metal received support from news of potential economic stimulus from China.
Chinese policymakers, through the Politburo, outlined plans for a “moderately loose” monetary policy and a “more proactive” fiscal stimulus for the coming year. This marks a shift from the cautious approach of the past decade and has boosted the demand outlook for metals in the world’s largest consumer of raw materials.
Chinese President Xi Jinping stated on Tuesday, “China has full confidence in achieving this year’s economic target.” He emphasized that China will continue to serve as the largest engine of global economic growth and asserted that there would be no winners in tariff wars, trade wars, or tech wars.
Silver prices also benefited from growing expectations that the US Federal Reserve (Fed) will cut interest rates again this month. Traders are now pricing in nearly an 89.5% chance of Fed rate reductions by 25 basis points on December 18, according to the CME FedWatch Tool.
However, the strengthening of the US Dollar (USD) is making dollar-denominated Silver less affordable for buyers with foreign currencies, dampening its demand. Trades adopt caution ahead of the US Consumer Price Index (CPI) data scheduled to be released on Wednesday.
Silver is a precious metal highly traded among investors. It has been historically used as a store of value and a medium of exchange. Although less popular than Gold, traders may turn to Silver to diversify their investment portfolio, for its intrinsic value or as a potential hedge during high-inflation periods. Investors can buy physical Silver, in coins or in bars, or trade it through vehicles such as Exchange Traded Funds, which track its price on international markets.
Silver prices can move due to a wide range of factors. Geopolitical instability or fears of a deep recession can make Silver price escalate due to its safe-haven status, although to a lesser extent than Gold’s. As a yieldless asset, Silver tends to rise with lower interest rates. Its moves also depend on how the US Dollar (USD) behaves as the asset is priced in dollars (XAG/USD). A strong Dollar tends to keep the price of Silver at bay, whereas a weaker Dollar is likely to propel prices up. Other factors such as investment demand, mining supply – Silver is much more abundant than Gold – and recycling rates can also affect prices.
Silver is widely used in industry, particularly in sectors such as electronics or solar energy, as it has one of the highest electric conductivity of all metals – more than Copper and Gold. A surge in demand can increase prices, while a decline tends to lower them. Dynamics in the US, Chinese and Indian economies can also contribute to price swings: for the US and particularly China, their big industrial sectors use Silver in various processes; in India, consumers’ demand for the precious metal for jewellery also plays a key role in setting prices.
Silver prices tend to follow Gold’s moves. When Gold prices rise, Silver typically follows suit, as their status as safe-haven assets is similar. The Gold/Silver ratio, which shows the number of ounces of Silver needed to equal the value of one ounce of Gold, may help to determine the relative valuation between both metals. Some investors may consider a high ratio as an indicator that Silver is undervalued, or Gold is overvalued. On the contrary, a low ratio might suggest that Gold is undervalued relative to Silver.
The EUR/USD is our featured currency pair this week, owing to the fact we have the European Central Bank’s key rate decision and important inflation data from the US coming in a week before the Federal Reserve’s own decision on interest rates. Ahead of these macro events, the EUR/USD forecast remains modestly bearish, although the currency pair has found some love today thanks to optimism about more stimulus measures being introduced in China, one of the Eurozone’s major exports destinations.
China’s government announced they will embrace a “moderately loose” strategy next year, in a sign of greater easing ahead that has been hailed by investors hungry for more stimulus today. The news caused Chinese equities and nearly all Chinese-linked assets rally, from copper to commodity stocks in the FTSE. The euro also found some mild support on the view that a stimulus-driven recovery in China will help support eurozone exports into that region. But most of the gains were evidenced in currencies that have even closer trade ties with China, such as the AUD. All eyes are now on the Central Economic Work Conference due to start on Wednesday, for signals of more fiscal support from China.
Well, analysts are expecting a standard 25 basis point rate cut at Thursday’s meeting of the Governing Council of the European Central Bank. There were talks of perhaps 50 basis points, which may still be under consideration. However, the ECB is more likely, in our view, to deliver a 25bp cut to take the deposit rate down to 3.15% from the current 3.40% and use the press conference to open the door to several further rate cuts in 2025. Today’s release of the latest Sentix Investor Confidence reading will certainly make the ECB’s doves more vocal. It is not just data that calls for looser policy: Governments in Paris and Berlin both collapsed over budget talks recently and this uncertainty is likely to weigh on growth further. The EUR/USD forecast could turn more bearish if the ECB turns out to be even more dovish than the market is expecting them to be right now.
US inflation data will be released this week, with CPI coming on Wednesday and PPI a day later. CPI is expected to rise to 2.7% y/y from 2.6% y/y previously. This will be the last set of key data before the Federal Reserve meets next week. Following Trump’s victory in the presidential election race, investors have sharply reduced their expectations about further US interest rate cuts in 2025. The upcoming December rate decision is unlikely to be impacted by this CPI report, unless we see a super-hot print. But whether the Fed will go ahead with a cut at its initial 2025 meetings will be influenced, among other key data highlights, by this CPI report, although it is employment that the Fed is now more focused on.
But after Friday’s somewhat of a softish NFP report, a 25-bps rate cut is now more likely than not. Indeed, market pricing of a December rate cut has risen to around 87% from 70% last week, although this has not yet had any further influence on the EUR/USD’s direction.

Source: TradingView.com
The EUR/USD has now had a few attempts to break above the 1.06 resistance area (i.e., the 1.0595-1.0610 range). So far, it has failed to post a daily close above this range to tip the balance in the bulls’ favour. But will that change as we head deeper into the week remains to be seen. For now, at least, the bulls will need to remain patient as we don’t have a concrete reversal signal to work with. A daily close above this resistance area could potentially pave the way for a short-squeeze rally towards the 1.0700 area, possibly 1.0775/80.
But while the 1.06 resistance area holds, the risks remain skewed to the downside. As such a break below the 1.0500 area is still a scenario that looks more likely than a sharp rally. The 1.0500 level is the most important support to watch in so far as the short-term outlook is concerned. A daily close below the 1.0450-1.0500 area could see the EUR/USD resume its bearish trend that started back in September. If that happens, then the next downside target would be the liquidity resting below the recent lows of around 1.0333 area. Thereafter, you have the round handles like 1.0300 and 1.0200 as the subsequent targets en route to potentially parity.
All told, the EUR/USD forecast is modestly bearish, and we could see the selling resume unless US CPI is super soft, or the ECB is not as dovish as markets are expecting.
— Written by Fawad Razaqzada, Market Analyst
Follow Fawad on Twitter @Trader_F_R
The Pound Sterling tumbled after failing to clear the 1.2800 figure for the third consecutive day, trading at 1.2720, down over 0.17% daily. Cable erased its earlier minuscule gains amid a session characterized by US Dollar strength, with the US Dollar Index (DXY) up over 0.19%, at 106.36.
The GBP/USD consolidates as it recovers from falling to multi-month lows at around 1.2480s. On its way north, the pair cleared the 1.2600 figure and November 29 peak of 1.2749 before aiming toward the December 6 high at 1.2811. The failure to extend its gains past the 200-day Simple Moving Average (SMA) of 1.2820 opened the door for a pullback to current spot prices.
On the other hand, sellers are moving in, as shown by the Relative Strength Index (RSI) punching below its neutral line, indicating that they’re gathering steam. If GBP/USD drops below 1.2700, the pair could slide towards 1.2600 before challenging the November 22 swing low of 1.2486.
The table below shows the percentage change of British Pound (GBP) against listed major currencies today. British Pound was the strongest against the New Zealand Dollar.
| USD | EUR | GBP | JPY | CAD | AUD | NZD | CHF | |
|---|---|---|---|---|---|---|---|---|
| USD | 0.46% | 0.17% | 0.55% | 0.15% | 1.03% | 1.15% | 0.44% | |
| EUR | -0.46% | -0.28% | 0.08% | -0.32% | 0.57% | 0.69% | -0.01% | |
| GBP | -0.17% | 0.28% | 0.33% | -0.03% | 0.85% | 0.97% | 0.27% | |
| JPY | -0.55% | -0.08% | -0.33% | -0.39% | 0.50% | 0.60% | -0.09% | |
| CAD | -0.15% | 0.32% | 0.03% | 0.39% | 0.89% | 1.01% | 0.31% | |
| AUD | -1.03% | -0.57% | -0.85% | -0.50% | -0.89% | 0.12% | -0.58% | |
| NZD | -1.15% | -0.69% | -0.97% | -0.60% | -1.01% | -0.12% | -0.69% | |
| CHF | -0.44% | 0.01% | -0.27% | 0.09% | -0.31% | 0.58% | 0.69% |
The heat map shows percentage changes of major currencies against each other. The base currency is picked from the left column, while the quote currency is picked from the top row. For example, if you pick the British Pound from the left column and move along the horizontal line to the US Dollar, the percentage change displayed in the box will represent GBP (base)/USD (quote).
As detailed in my previous article, USDJPY, Silver Forecast: Bullish Rebounds in Question, several bullish indicators emerged on Friday as USDJPY tested the 148.60 support level. This coincided with positive technical setups and market sentiment leaning towards a BOJ rate hike after the Fed’s expected rate cut in mid-December. Volatility risks remain on the horizon with US inflation data.
US indices started the year strong, recording successive highs before capping 2024 with December’s anticipated Santa Claus rally and New Year effect. This aligns with bullish momentum for Trump’s presidency.
Despite these highs, the Dow Jones faces bearish correction pressures from the 45,000 zone, driven by inflationary concerns, geopolitical instability, and profit-taking ahead of the holidays. As markets brace for 2025, the combination of these risks and uncertainties under Trump’s leadership sets the stage for volatility.


Source: Tradingview
USDJPY is still holding a bullish rebound from the key support at 148.60. The bullish indicators supporting the setup are:
If the 148.60 low holds firm, the next resistance is at 153.30, aligning with the lower boundary of the long-term trendline connecting consecutive lows from January 2023 to 2024. Longer-term resistance levels include 155, 157 and 160, reflecting significant Yen weakness and potential BOJ intervention risks. From the downside, the next level to watch at 146.80 in the event of further downside. Deeper declines could retest levels 144 and 140.

Source: Tradingview
For a longer-term technical analysis of the Dow chart, the details are published in the following article EURUSD, Dow Forecast: On Edge Ahead of Key US Data
On the daily time frame, the Dow is consolidating near the 45,000 level, forming another top amid overbought RSI conditions and negative divergence. The psychological implications of the 45,000 mark and its Fibonacci extension reinforce the significance of this zone.
The 4H RSI reflects a rebound potential, aligning with recorded highs at 44,300 in November.
Upside momentum could resume with a firm close above 45,200, eyeing resistance at 47,000. Conversely, a break below 44,280 could extend retracement towards 43,300, 42,200, and 41,500.

Source: Tradingview
As previously mentioned in EURUSD, Nasdaq Forecast: Inflation Data and Holiday Volatility, Nasdaq fell short of the 2,700-mark on Monday following momentum slowdowns in the Dow and S&P ahead of the US CPI and FOMC meeting.
The 4H RSI, displayed on the daily chart, reflects a retest of the neutral zone as the price tests 21,400 support.
Further upside can be confirmed with a close above 21,800, eyeing resistance at 22,800. A break below 21,280 could deepen corrections to 21,140, 20,800, and 20,300, aligning with the bottom border of the primary uptrend since October 2022 lows.
— Written by Razan Hilal, CMT on X:@Rh_waves and Forex.com Youtube
Coffee price world
Early in the morning of 28/11 (Vietnam time), on the London floor, the price of Robusta coffee futures for monthly delivery November 2024 was at 5.533 USD/ton, up 358 USD/ton compared to yesterday. The monthly delivery term January 2025 increased 382 USD/ton, trading at 5.496 USD/ton.
Arabica coffee prices on the New York floor for monthly delivery December 2024 traded at 323 cents/lb, up 15 cents/lb compared to yesterday’s trading level. For monthly delivery March 2025, trading was at 320 cents/lb, up 14 cents/lb.
Coffee prices increased sharply today. (Illustration photo)
Coffee prices in the country
Domestic coffee prices today also increased across localities, trading at 123.500 – 124.100 VND/kg.
Specifically, in the province Dak Lak, today’s coffee price is purchased at 124.000 VND/kg, an increase of 2.400 VND/kg compared to yesterday.
At Lam Dong, today’s coffee price was purchased at 123.500 VND/kg, an increase of 2.500 VND/kg compared to the previous trading session.
At Gia Lai, today’s coffee price is trading at 123.900 VND/kg, up 2.600 VND/kg.
Coffee prices in the province Dak Nong Today recorded an increase of 2.100 VND/kg, purchased at 124.100 VND/kg.
Global coffee prices continued their strong upward trend, reflecting deep concerns about future supply. Specifically, Arabica coffee prices increased by 1,33% to a 27-year high, while Robusta prices also increased by 1,27%, approaching the threshold of 5.200 USD/ton.
Rainfall in Minas Gerais, Brazil’s largest coffee-growing state, was below historical average last week, adding to supply concerns there. Somar Meteorologia reported just 6 mm of rainfall in Minas Gerais last week, or 10% of the historical average.
The low rainfall has raised concerns that coffee plants will not be able to fully recover and develop, leading to a sharp drop in output compared to the current crop. Previously, Brazil’s main coffee growing region experienced a prolonged period of historic drought, causing analysts to simultaneously reduce their forecasts for coffee production in the 2025-2026 crop year as well as the 2024-2025 crop year.
The US Department of Agriculture (USDA) Brazil office estimates the country’s coffee production for the 2024-2025 crop year at 66,4 million 60-kg bags, down 3,5 million bags from the previous forecast. The total production decline is mainly due to a decline in Arabica coffee as the growing region faces harsh weather conditions during the flowering and bean development stages.
In addition, exports in the 2024-2025 crop year are estimated to decrease by 5% compared to the previous forecast and 2,5 million bags lower than the previous crop year, to 44,25 million bags. At the same time, ending inventories in the 2024-2025 crop year are down 65% compared to the forecast of USDA headquarters, to 1,24 million bags, and ending inventories in the 2023-2024 crop year are also cut from 2,88 million bags to 1,68 million bags.
Regarding the long-term outlook, consulting firm Hedgepoint in its latest global market report forecasts that Brazil’s coffee output in the 2025-2026 crop year will only reach about 65,2 million bags, of which Arabica coffee output is expected to be at 42,6 million bags, down 1,4% compared to the previous crop.
Thanh Lam
Sources: https://vtcnews.vn/gia-ca-phe-hom-nay-28-11-tang-manh-len-muc-cao-nhat-tu-truoc-den-nay-ar910063.html
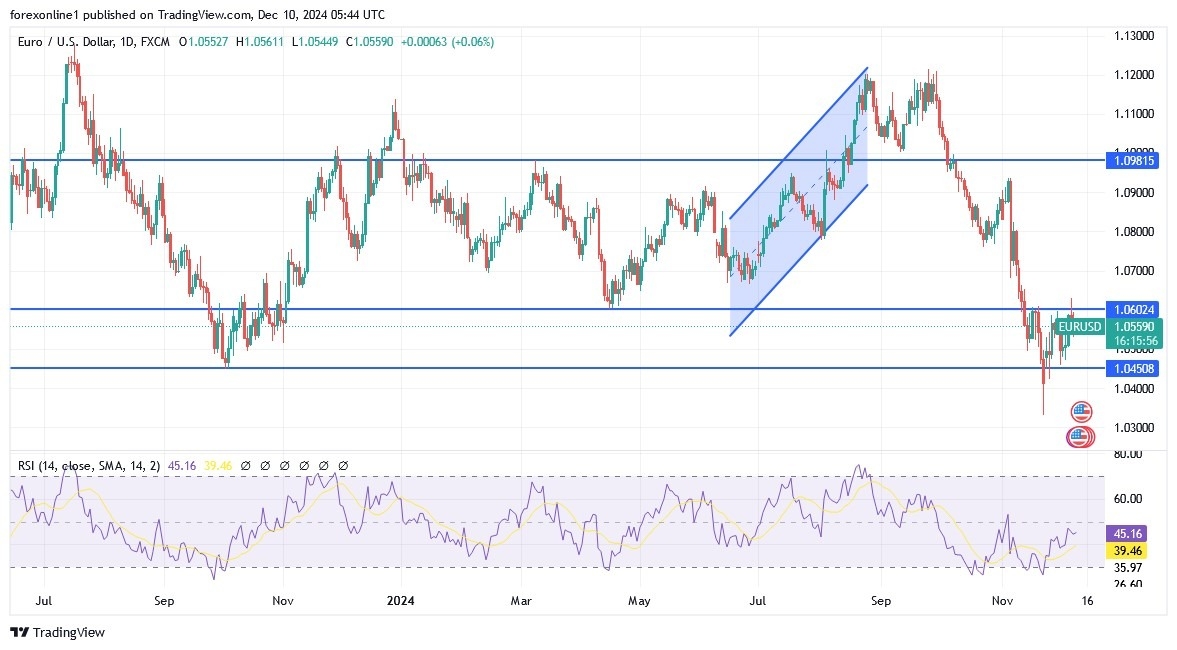
According to reliable currency trading company platforms, the selling of the Euro has developed into a sideways trend, and the chart also shows the boundaries of the narrow sideways range that has developed since mid-November. Overall, we believe that the coming days may see the Euro-Dollar retest the upper bound of the range at 1.0628. However, a daily close above this level would be a bullish development for those who want a stronger Euro. In general, the EUR/USD pair still needs to trade decisively above 1.06 (and even above 1.0660) to convincingly stop the current downtrend. However, the current rebound above 1.0550 provides at least an additional barrier for the Euro.
Therefore, the technical picture is one of resilience rather than strength. It seems that the markets are tired of buying the US dollar but are not confident enough to buy the Euro directly. Also, the movement of forex prices in recent days indicates the limits of what is called “Trump trading”. In addition, the fact that US interest rates and US Treasury yields remain near recent lows is a major headwind for the US dollar.

The main event for the Euro against other major currencies this week will be the European Central Bank’s decision, where a further interest rate cut is expected. Consensus expects a 25-basis point cut, although market pricing shows that some expect a stronger 50 basis point move. If the latter is implemented, the Euro will weaken. Therefore, the EUR/USD pair will test the bottom of the recent range towards support at 1.0450.
Although there is a strong argument for the ECB to accelerate the pace of policy easing by delivering a 50-basis point cut, it seems that a majority of the Governing Council members prefer 25-basis points, which would lower the deposit rate to 3.0%. Nevertheless, the policy statement will indicate that with downside risks clearly increasing, monetary policy could turn to a more neutral stance before long. We still believe that the ECB will cut the deposit rate further than investors expect next year. At the same time, the “dovish” message issued by the ECB will also be consistent with a weaker Euro exchange rate.
However, not all roads lead to weakening the Euro, and some analysts believe that the ECB will want to show caution, which could strengthen the currency.
We still prefer to sell the Euro Dollar from every upside level as the factors of weakness in the Euro are strong and may take time to remove or the opposite may happen, and things will get worse. Cautiously, attentions are turning cautiously to the European Central Bank announcement and US inflation figures.
The EUR/USD pair continues to be in a neutral position within an ascending triangle pattern, as the price formed higher lows and found resistance at the key psychological level of 1.0600. At the same time, the upper part of the triangle keeps the gains under control again, pushing the EUR/USD pair closer to the bottom around the secondary psychological level of 1.0550, which also coincides with the dynamic support at the moving averages. In terms of simple moving averages, the 100-day simple moving average appears to be crossing above the 200-day simple moving average, indicating that the trend is bullish or that support is likely to hold rather than break. Stronger upward momentum could stimulate a move above the triangle’s peak and a rise equal to the formation’s height, which extends about 250 pips.
At the same time, the Stochastic indicator is in the oversold zone, indicating exhaustion among the bears, so a shift upwards means that buyers are ready to take control of performance. Also, the oscillator has a large space to rise before reaching the overbought zone, so the price can continue to follow the same approach. Technically, the Relative Strength Index has more room to decline before reaching the oversold zone, so downward pressure may remain for a little longer. Ultimately, a break below the triangle bottom could lead to a decline equal to the formation’s height as well.
You can follow the Euro-Dollar recommendations and other free live trading recommendations exclusively through our website. However, it is necessary to consider not taking risks and activating take-profit and stop-loss orders to ensure the safety of the trading account from any sudden price reversals.
Ready to trade our EUR/USD Forex daily forecast? We’ve shortlisted the best forex broker list for you to check out.
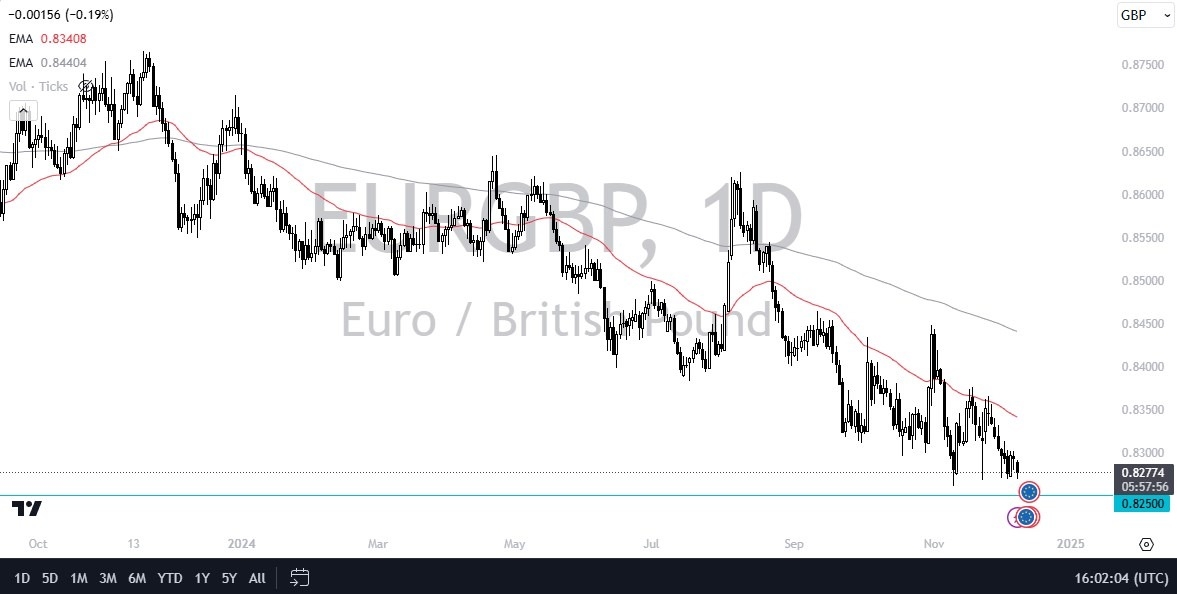
The European Union has a lot of issues right now, not the least of which can be summed up in one word: France. The French economy looks miserable, and of course there are plenty of political issues in that country as well that leads to instability. This is the biggest problem with a single currency for so many countries, just a handful of them can cause chaos. The fact that France is second only to Germany means that it has and outsized influence on what happens with Europe.
On the other side of the English Channel, we have the United Kingdom which of course isn’t doing as well as United States, but its biggest benefit for traders is that it’s not the European Union. The UK has been doing “okay” for a while, but it certainly has its own issues. However, this is a chart that I’ll be watching very closely because I think this could have massive ramifications across the board.
If the market were to break down below the 0.82 level, then I think the bottom falls out for the euro overall. In that environment, I would expect to see the euro struggle against pretty much anything, and therefore I would be all about Shorty not only this pair, but multiple others. With this, I think a major signal is starting to show itself, now it’s only a matter of whether or not we can see a breakdown. That breakdown could very well happen on Thursday, as the European Central Bank has an interest rate decision, and perhaps more importantly, an accompanying statement.
Ready to trade our free Forex signals? Here are the best Forex demo accounts to choose from.
GBP/USD rose to 1.2800 on Monday but failed to clear that hurdle for the second consecutive trading day. The pair stays in a consolidation phase at around 1.2750 early Tuesday.
The table below shows the percentage change of British Pound (GBP) against listed major currencies last 7 days. British Pound was the strongest against the Japanese Yen.
| USD | EUR | GBP | JPY | CAD | AUD | NZD | CHF | |
|---|---|---|---|---|---|---|---|---|
| USD | -0.45% | -0.74% | 1.33% | 0.98% | 1.30% | 1.05% | -0.78% | |
| EUR | 0.45% | -0.30% | 1.79% | 1.44% | 1.76% | 1.50% | -0.33% | |
| GBP | 0.74% | 0.30% | 2.11% | 1.73% | 2.06% | 1.81% | -0.05% | |
| JPY | -1.33% | -1.79% | -2.11% | -0.36% | -0.07% | -0.32% | -2.12% | |
| CAD | -0.98% | -1.44% | -1.73% | 0.36% | 0.31% | 0.07% | -1.75% | |
| AUD | -1.30% | -1.76% | -2.06% | 0.07% | -0.31% | -0.25% | -2.07% | |
| NZD | -1.05% | -1.50% | -1.81% | 0.32% | -0.07% | 0.25% | -1.82% | |
| CHF | 0.78% | 0.33% | 0.05% | 2.12% | 1.75% | 2.07% | 1.82% |
The heat map shows percentage changes of major currencies against each other. The base currency is picked from the left column, while the quote currency is picked from the top row. For example, if you pick the British Pound from the left column and move along the horizontal line to the US Dollar, the percentage change displayed in the box will represent GBP (base)/USD (quote).
The negative shift seen in risk mood helped the US Dollar (USD) hold its ground in the second half of the day on Monday and caused GBP/USD to erase its daily gains. Wall Street’s main indexes started the week on a bearish note and lost between 0.5% and 0.8% on a daily basis. Early Tuesday, US stock index futures trade mixed.
In the early American session on Tuesday, the US Bureau of Labor Statistics (BLS) will publish a revision to the third-quarter Unit Labor Costs. Markets expect the data to be reaffirmed at 1.9%. In case the BLS revises this figure higher, the immediate market reaction could be USD-positive and weigh on GBP/USD. On the flip side, a negative revision is likely to have the opposite effect on the pair’s action.
Nevertheless, investors could opt to wait for Wednesday’s November Consumer Price Index (CPI) data from the US before taking large positions. Until then, the risk perception could impact the USD’s valuation. If US stocks continue to push lower after the opening bell, the USD could preserve its strength and make it difficult for GBP/USD to attract bulls.
In case GBP/USD flips 1.2750 (Fibonacci 50% retracement of the latest downtrend) into resistance, buyers could be discouraged. In this scenario, 1.2700 (Fibonacci 38.2% retracement) could be seen as next support before 1.2660 (100-period SMA).
If GBP/USD stabilizes above 1.2750 and continues to use that level as support, the 200-period Simple Moving Average (SMA) at 1.2770 could act as next resistance before 1.2800 (Fibonacci 61.8% retracement).
The Pound Sterling (GBP) is the oldest currency in the world (886 AD) and the official currency of the United Kingdom. It is the fourth most traded unit for foreign exchange (FX) in the world, accounting for 12% of all transactions, averaging $630 billion a day, according to 2022 data. Its key trading pairs are GBP/USD, also known as ‘Cable’, which accounts for 11% of FX, GBP/JPY, or the ‘Dragon’ as it is known by traders (3%), and EUR/GBP (2%). The Pound Sterling is issued by the Bank of England (BoE).
The single most important factor influencing the value of the Pound Sterling is monetary policy decided by the Bank of England. The BoE bases its decisions on whether it has achieved its primary goal of “price stability” – a steady inflation rate of around 2%. Its primary tool for achieving this is the adjustment of interest rates. When inflation is too high, the BoE will try to rein it in by raising interest rates, making it more expensive for people and businesses to access credit. This is generally positive for GBP, as higher interest rates make the UK a more attractive place for global investors to park their money. When inflation falls too low it is a sign economic growth is slowing. In this scenario, the BoE will consider lowering interest rates to cheapen credit so businesses will borrow more to invest in growth-generating projects.
Data releases gauge the health of the economy and can impact the value of the Pound Sterling. Indicators such as GDP, Manufacturing and Services PMIs, and employment can all influence the direction of the GBP. A strong economy is good for Sterling. Not only does it attract more foreign investment but it may encourage the BoE to put up interest rates, which will directly strengthen GBP. Otherwise, if economic data is weak, the Pound Sterling is likely to fall.
Another significant data release for the Pound Sterling is the Trade Balance. This indicator measures the difference between what a country earns from its exports and what it spends on imports over a given period. If a country produces highly sought-after exports, its currency will benefit purely from the extra demand created from foreign buyers seeking to purchase these goods. Therefore, a positive net Trade Balance strengthens a currency and vice versa for a negative balance.
Gold’s price builds on the previous rebound near $2,670 in Tuesday’s Asian trades even as the US Dollar (USD) sticks to its recovery mode, awaiting US Consumer Price Index (CPI) data on Wednesday for fresh directional impetus.
Gold price takes advantage of a pause in the US Treasury yields upswing and expectations of more stimulus coming from China following weak inflation data on Monday. China’s CPI missed expectations in November, rising by 0.2% year on year (YoY), down from a 0.3% increase in October.
Additionally, rising Middle East geopolitical tensions, in the face of the sudden collapse of the Syrian government over the weekend, keep the haven demand for Gold price alive and kicking. Syrian rebels seized the capital, Damascus, ousting President Bashar al-Assad, who fled to Russia with his family seeking asylum.
According to Bloomberg, the leader of the Syrian rebel group, Mohammed Al Bashir, is set to form a transitional administration to “avoid slipping into chaos”.
On Monday, Gold price staged a decent comeback from eight-day lows of $2,613 as Middle East geopolitical tensions offset the renewed upside in the US Dollar and the US Treasury bond yields across the curve. US Treasury bond yields rebound was led by the anticipation of stubbornly high US inflation data, which could ramp up expectations for a hawkish interest rate cut by the US Federal Reserve (Fed) next week.
Markets see an 86% probability of the Fed lowering rates by 25 basis points (bps) next week. Meanwhile, for the January Fed meeting, the odds for another 25 bps rate cut stand at about 22%, the CME Group’s FedWatch Tool shows.
Looking ahead, all eyes remain on Wednesday’s key US inflation test as Gold price could see additional profit-taking following last week’s decline. Traders will likely resort to repositioning in the lead-up to the US CPI showdown.
Meanwhile, geopolitical developments will also be closely eyed in the absence of any top-tier US economic data due later this Tuesday.
The daily chart shows that the tide has turned in favor of the Gold price as the 14-day Relative Strength Index (RSI) pierced through the midline for the upside.
Gold price is now attempting to break the recent range to the north, battling with the key 50-day Simple Moving Average (SMA) at $2,668.
Acceptance above the latter on a daily closing basis is critical for providing extra legs to the ongoing Gold price recovery.
The next relevant resistance levels are seen at the $2,700 round level and the November 25 high of $2,721.
Conversely, the 21-day SMA at $2,633 will offer strong support to buyers in case the upside loses momentum.
The previous week’s low of $2,613 will be next on sellers’ radars, below which the 100-day SMA at $2,588 will be threatened.
Gold has played a key role in human’s history as it has been widely used as a store of value and medium of exchange. Currently, apart from its shine and usage for jewelry, the precious metal is widely seen as a safe-haven asset, meaning that it is considered a good investment during turbulent times. Gold is also widely seen as a hedge against inflation and against depreciating currencies as it doesn’t rely on any specific issuer or government.
Central banks are the biggest Gold holders. In their aim to support their currencies in turbulent times, central banks tend to diversify their reserves and buy Gold to improve the perceived strength of the economy and the currency. High Gold reserves can be a source of trust for a country’s solvency. Central banks added 1,136 tonnes of Gold worth around $70 billion to their reserves in 2022, according to data from the World Gold Council. This is the highest yearly purchase since records began. Central banks from emerging economies such as China, India and Turkey are quickly increasing their Gold reserves.
Gold has an inverse correlation with the US Dollar and US Treasuries, which are both major reserve and safe-haven assets. When the Dollar depreciates, Gold tends to rise, enabling investors and central banks to diversify their assets in turbulent times. Gold is also inversely correlated with risk assets. A rally in the stock market tends to weaken Gold price, while sell-offs in riskier markets tend to favor the precious metal.
The price can move due to a wide range of factors. Geopolitical instability or fears of a deep recession can quickly make Gold price escalate due to its safe-haven status. As a yield-less asset, Gold tends to rise with lower interest rates, while higher cost of money usually weighs down on the yellow metal. Still, most moves depend on how the US Dollar (USD) behaves as the asset is priced in dollars (XAU/USD). A strong Dollar tends to keep the price of Gold controlled, whereas a weaker Dollar is likely to push Gold prices up.