The main category of Forex News.
You can use the search box below to find what you need.
[wd_asp id=1]
The main category of Forex News.
You can use the search box below to find what you need.
[wd_asp id=1]
Silver price (XAG/USD) extends its gains for the second day, trading around $32.00 per troy ounce during the Asian hours on Tuesday. The daily chart analysis indicates a bullish bias, with the pair moving upwards within an ascending channel pattern. Additionally, the 14-day Relative Strength Index (RSI) remains above the 50 mark, further supporting the bullish sentiment.
The XAG/USD pair continues to trade above the nine- and 14-day Exponential Moving Averages (EMA), reinforcing a bullish outlook and signaling to strengthen short-term price momentum. This points to increasing buying interest and raises the likelihood of further price appreciation.
In terms of the upside, the Silver price finds a primary barrier around the upper boundary of the ascending channel at the $32.60 level. A break above this level could reinforce the bullish bias and support the XAG/USD pair to approach its November high at $33.13.
On the downside, the primary support appears at the nine-day EMA at $31.28, followed by the 14-day EMA at $31.17. The lower boundary of the ascending channel at $31.00 level could act as a major support.
A break below the descending channel could weaken the bullish bias and put downward pressure on the price of precious metal to test a “throwback support” at the psychological level of $30.00.
Silver is a precious metal highly traded among investors. It has been historically used as a store of value and a medium of exchange. Although less popular than Gold, traders may turn to Silver to diversify their investment portfolio, for its intrinsic value or as a potential hedge during high-inflation periods. Investors can buy physical Silver, in coins or in bars, or trade it through vehicles such as Exchange Traded Funds, which track its price on international markets.
Silver prices can move due to a wide range of factors. Geopolitical instability or fears of a deep recession can make Silver price escalate due to its safe-haven status, although to a lesser extent than Gold’s. As a yieldless asset, Silver tends to rise with lower interest rates. Its moves also depend on how the US Dollar (USD) behaves as the asset is priced in dollars (XAG/USD). A strong Dollar tends to keep the price of Silver at bay, whereas a weaker Dollar is likely to propel prices up. Other factors such as investment demand, mining supply – Silver is much more abundant than Gold – and recycling rates can also affect prices.
Silver is widely used in industry, particularly in sectors such as electronics or solar energy, as it has one of the highest electric conductivity of all metals – more than Copper and Gold. A surge in demand can increase prices, while a decline tends to lower them. Dynamics in the US, Chinese and Indian economies can also contribute to price swings: for the US and particularly China, their big industrial sectors use Silver in various processes; in India, consumers’ demand for the precious metal for jewellery also plays a key role in setting prices.
Silver prices tend to follow Gold’s moves. When Gold prices rise, Silver typically follows suit, as their status as safe-haven assets is similar. The Gold/Silver ratio, which shows the number of ounces of Silver needed to equal the value of one ounce of Gold, may help to determine the relative valuation between both metals. Some investors may consider a high ratio as an indicator that Silver is undervalued, or Gold is overvalued. On the contrary, a low ratio might suggest that Gold is undervalued relative to Silver.
Spot Gold advanced on Monday, trading as high as $2,667.31 a troy ounce during American hours. The bright metal found fresh demand for China after the People’s Bank of China (PBoC) resumed purchasing following a six-month pause. The US Dollar (USD), on the other hand, trades with a soft tone across the FX board as investors gear up for central banks’ announcements and first-tier United States (US) critical data.
The US will publish an update on inflation on Wednesday in the form of the Consumer Price Index (CPI). The Federal Reserve (Fed) prefers to base its decision on the more smoothed Personal Consumption Expenditures (PCE) Price Index, yet with the central bank’s announcement around the corner, market participants will be closely paying attention to the figures.
Ahead of the Fed, the Bank of Canada (BoC), the Reserve Bank of Australia (RBA) and the European Central Bank (ECB) will also have monetary policy meetings, while in the Fed’s aftermath, it will be the turn of the Bank of Japan (BoJ) and the Bank of England (BoE).
Meanwhile, Wall Street opened with a sour tone, with the three major indexes trading in the red. Government bond yields, on the other hand, ticked marginally higher.
The XAU/USD pair trades near its intraday high, and technical readings in the daily chart support an upward extension. The pair spent the day above a flat 20 Simple Moving Average (SMA), bouncing sharply from the media, usually a sign of mounting buying interest. At the same time, the 100 and 200 SMAs advance well below the shorter one, recovering their bullish poise. Finally, technical indicators bounced from around their midlines, offering modest upward slopes in line with recent resurgent buying.
In the near term, and according to the 4-hour chart, XAU/USD is also poised to extend gains. Buyers are challenging sellers aligned around a directionless 200 SMA while converging 20 and 100 SMAs provided intraday support. Technical indicators, in the meantime, head north above their midlines, albeit with uneven strength.
Support levels: 2,662.50 2,650.40 2,634.70
Resistance levels: 2,676.30 2,690.65 2,704.35
Precious metals gained ground throughout the European session on Monday and were still holding into the positive heading deeper into the US session. Gold and silver were buoyed by renewed optimism from China. A shift in Beijing’s monetary strategy provided a boost to Chinese stocks and rippled through global markets, lifting commodity prices, including gold. Add geopolitical tensions from the Middle East to Europe, and it’s clear why safe-haven assets like gold saw a recovery. The week ahead, however, brings high-stakes events like interest rate decisions from major central banks and key US inflation data, all set to influence the gold forecast.
China is signalling a more relaxed monetary policy for the coming year, sparking hopes of further stimulus. Such measures could be a game changer for China’s stock market. It remains to be seen if it will help lift consumer confidence to the point that it leads to a rise in gold demand in China. For now, traders are buying gold in anticipation but don’t expect this to provide a lasting support. Support for gold will have to come from other factors, particularly if we hear significantly more dovish tones from other central banks meeting in the next couple of weeks – the ECB and Fed, in particular. As well as the ECB this week, the Bank of Canada and Swiss National Bank are all on deck with policy announcements. Should these institutions lean toward easing more than investors expect for 2025, it might further support gold’s appeal, especially amidst lingering geopolitical uncertainties. However, if we hear less-than-dovish remarks then this may not provide much support, if at all, to gold prices.
Gold prices are stuck in a two-week range despite today’s 1.3% rise so far in the trading session. November marked a turning point with gold retreating from its October highs, ending a nine-month winning streak. This has left many investors adopting a “wait-and-see” approach. With the US Consumer Price Index (CPI) report and the Federal Reserve’s final meeting of the year looming, the gold forecast hinges on these pivotal events. Will gold break out of its consolidation phase, or is a deeper correction on the horizon?
While optimism around China’s stimulus boosted procyclical currencies, the Dollar Index remains near recent highs. A stronger dollar has been a significant headwind for gold, making it pricier for key consumers in China and India. Together, these nations account for over half the global jewellery market. Coupled with a shift toward riskier assets like tech stocks, gold’s allure has taken a hit. Even so, Monday’s recovery hints that gold’s consolidation might be nearing its end—though a confirmed breakout is still needed to reignite momentum.

Source: TradingView.com
Gold’s technical outlook looks unclear at this stage and more price action is needed to tip the balance either in the bulls’ or bears’ favour. So, let’s observe price action around some key levels on the gold chart to get a better idea of directional bias:
The short-term gold forecast remains murky, with competing factors like a strong dollar, geopolitical uncertainties, and major economic data releases shaping market sentiment. While long-term trends favour gold, immediate resistance levels and waning momentum call for caution. Traders are likely eyeing the upcoming CPI report and ECB meeting for a clearer direction. However, the Federal Reserve’s rate decision next week could ultimately be the decisive factor in gold’s next big move.
— Written by Fawad Razaqzada, Market Analyst
Follow Fawad on Twitter @Trader_F_R
Further bullish signs may include a daily close above the three-day high, or a daily close above the five-day high of 3.22, and then a daily close above the nearby uptrend line. The uptrend line must be watched visually. Natural gas is rallying following a successful test of support around the breakout area for a symmetrical triangle pattern, which includes a 61.8% Fibonacci retracement.
In other words, it is rising off a logical support zone that could complete the bearish retracement. Also, notice that over the past few days as natural gas was trying to find a bottom it was able to close above the 20-Day MA trend indicator each day.
The 20-Day MA is now at 3.11. Along with the internal uptrend line, the 20-Day line provides a dynamic support line for the trend. If support continues to be found at or above the 20-Day MA, the rising trend remains in place. Since a bullish breakout of a symmetrical triangle formation occurred recently, there is the potential for a new upswing for the developing bull trend. Following the initial breakout, above 3.02, natural gas was able to sustain strength and reclaim prior swing highs at 3.16 and 3.39. This is bullish behavior that should return to the market for natural gas once the correction is complete.
There was also a bullish reversal that triggered today on the weekly chart as last week’s high of 3.28 was exceeded to the upside. Therefore, the high provide another key near-term pivot to keep an eye on. A daily close above that level would provide another sign of strengthening.
For a look at all of today’s economic events, check out our economic calendar.
Political instability in the largest Eurozone economies has not been the sole factor behind the weakening of investor sentiment towards the Euro. Recently, the bloc’s economy has been facing numerous difficulties, including a significant slowdown. Also, the European Central Bank’s plans have not yielded satisfactory results. Forecasts currently indicate that France is expected to grow by 1.1% this year and 0.8% in 2025, while the German economy is expected to shrink by 0.1% this year, marking the second consecutive year of contraction, and then recover modestly by 0.7% in 2025. As for the largest economy in the Eurozone, Germany faces headwinds from a shortage of skilled labor, excessive bureaucracy, and high energy prices, and efforts to address these issues have been hampered by disagreements within the German Chancellor’s coalition. The Eurozone economy is expected to face significant challenges if the incoming Trump administration’s trade wars impact the bloc’s exports.
The US Dollar performed strongly following the release of details from the previous month’s US jobs report. The US economy added a total of 227,000 jobs, while the US unemployment rate rose to 4.2% from 4.1% previously. Also, hourly wages increased by 0.4%. Overall, the November US jobs report provided the latest evidence that the US labour market remains strong, although it has lost much of the momentum from the hiring boom of 2021-2023 when the US economy was recovering from the pandemic recession.
The gradual slowdown in the labour market is partly due to the high interest rates engineered by the Federal Reserve in its efforts to tame inflation. Furthermore, the Federal Reserve has raised interest rates 11 times in 2022 and 2023. Contrary to expectations, the economy has continued to grow despite significant increases in borrowing costs for consumers and businesses. However, since early this year, the labour market has been slowing.

According to the economic calendar, the performance of the EUR/USD pair this week may be influenced by the release of US inflation data and the announcement of European Central Bank policies. Regarding the first event, forecasts indicate that the US consumer price index reading will decline from 2.6% to 2.5% in November. Overall, US inflation has remained higher in recent months. It is worth noting that these figures will determine the course of US Federal Reserve policy in the coming months.
Regarding the second event, the European Central Bank’s announcement will be closely monitored, especially as the Eurozone economy faces domestic and international challenges. Expectations are high that the ECB will cut interest rates from 3.40% to 3.15% this week, and the main focus will be on the tone of the bank’s policy statement and the press conference held by ECB President Lagarde.
We still prefer to sell the Euro Dollar from every upward level, as the factors of the Euro’s weakness are strong and may take time to remove or the opposite may happen and things will get worse.
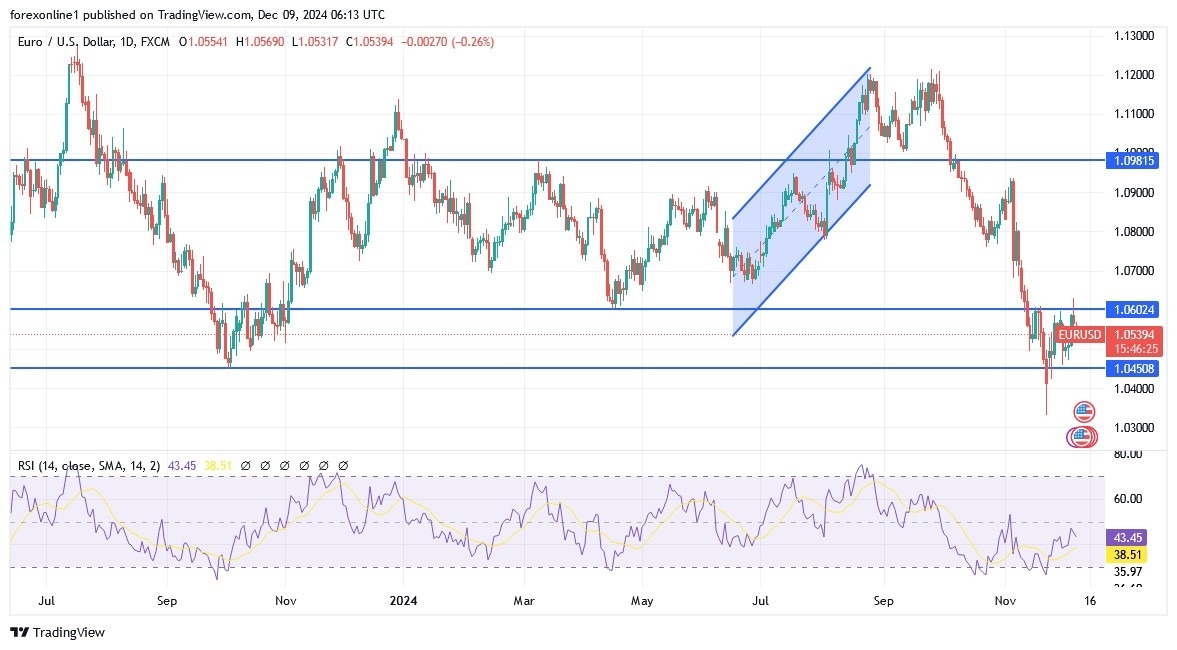
There is no change in my technical view of the performance of the Euro against the US Dollar EUR/USD, as the general trend is still bearish. as we mentioned before, stability around and below the support level of 1.0500 will continue to support the bears’ control over the trend, and moving below it will warn of a stronger downward movement to come. Technically, expectations of the Euro Dollar moving towards the parity price will increase if prices fall to the support levels of 1.0440 and 1.0365, respectively. In contrast, according to the performance on the daily chart, the first break of the Euro Dollar’s downward trend will be the break of the resistance of 1.0822. In general, we still prefer to sell the Euro Dollar from every upward level.
Ready to trade our daily EUR/USD Forex analysis? We’ve made this forex brokers list for you to check out.
The coffee market is in a period of strong volatility, with mixed signals coming from both coffee prices. world and domestically. While Brazilian Arabica coffee prices increased slightly in the morning of 12/10, domestic coffee prices decreased in key localities.
Considering the current supporting and risk factors, this article will take a deeper look at the growth potential and potential challenges for the coffee market in the short term.
World Coffee Market: Positive Signals from Brazilian Arabica
Brazilian Arabica coffee prices, the world’s most popular coffee, recorded a slight increase in the morning of 12/10. Monthly delivery futures December 2024 increased by 0.41% to 304.50 USD/ton, while monthly delivery futures March 2025 increased by 0.20% to 303.80 USD/ton. However, the two monthly delivery futures May 2025 and July 2025 decreased slightly, by 1.15% and 1.26%, respectively.
The rise in Brazilian Arabica prices reflects concerns about global coffee supplies. Brazil, the world’s largest coffee producer, is facing a prolonged drought that is affecting coffee crop yields.
Domestic coffee market: Signs of slight decline
While the world coffee market is showing positive signs, domestic coffee prices are showing a slight downward trend. Specifically, coffee prices updated at 4:30 a.m. on October 13, 2024 show that the domestic coffee market today decreased in key localities, with an average decrease of VND400/kg, ranging from VND113.000 to VND113.700/kg.
The decline in domestic coffee prices can be attributed to a number of factors, including: After months of strong growth, many coffee growers are cautious about selling their coffee. Supply is abundant and Vietnam’s new coffee harvest has begun, and supply is expected to be more abundant in the coming period. Heavy rains during the harvest period can affect the quality of coffee and lead to a price drop.
Based on current market developments, tomorrow’s coffee price October 14, 2024 is expected to have a slight upward trend.
| Coffee Price Forecast Tomorrow October 14, 2024: Balancing Growth and Risk |
Factors supporting prices: Prolonged drought in Brazil and lower-than-expected coffee production in Vietnam remain key factors driving up coffee prices. And a weaker US dollar against other currencies makes coffee cheaper for importing countries, boosting demand. Global coffee demand is growing strongly, especially in emerging markets.
Risk factors: Heavy rains during harvest season in Vietnam could affect coffee quality and lead to reduced production. Shipping bottlenecks through the Red Sea could impact coffee exports, leading to lower prices.
Tomorrow’s coffee price October 14, 2024 is expected to be a balanced result between supporting and risky factors. A slight upward trend can be recorded, but the market still has many potential fluctuations. Investors need to closely monitor market developments to make appropriate investment decisions.
*Information is for reference only
Sources: https://congthuong.vn/du-bao-gia-ca-phe-ngay-mai-14102024-tiep-tuc-giam-manh-352160.html
The EUR/USD is our featured currency pair this week, owing to the fact we have the European Central Bank’s key rate decision and important inflation data from the US coming in a week before the Federal Reserve’s own decision on interest rates. Ahead of these macro events, the EUR/USD forecast remains modestly bearish, although the currency pair has found some love today thanks to optimism about more stimulus measures being introduced in China, one of the Eurozone’s major exports destinations.
China’s government announced they will embrace a “moderately loose” strategy next year, in a sign of greater easing ahead that has been hailed by investors hungry for more stimulus today. The news caused Chinese equities and nearly all Chinese-linked assets rally, from copper to commodity stocks in the FTSE. The euro also found some mild support on the view that a stimulus-driven recovery in China will help support eurozone exports into that region. But most of the gains were evidenced in currencies that have even closer trade ties with China, such as the AUD. All eyes are now on the Central Economic Work Conference due to start on Wednesday, for signals of more fiscal support from China.
Well, analysts are expecting a standard 25 basis point rate cut at Thursday’s meeting of the Governing Council of the European Central Bank. There were talks of perhaps 50 basis points, which may still be under consideration. However, the ECB is more likely, in our view, to deliver a 25bp cut to take the deposit rate down to 3.15% from the current 3.40% and use the press conference to open the door to several further rate cuts in 2025. Today’s release of the latest Sentix Investor Confidence reading will certainly make the ECB’s doves more vocal. It is not just data that calls for looser policy: Governments in Paris and Berlin both collapsed over budget talks recently and this uncertainty is likely to weigh on growth further. The EUR/USD forecast could turn more bearish if the ECB turns out to be even more dovish than the market is expecting them to be right now.
US inflation data will be released this week, with CPI coming on Wednesday and PPI a day later. CPI is expected to rise to 2.7% y/y from 2.6% y/y previously. This will be the last set of key data before the Federal Reserve meets next week. Following Trump’s victory in the presidential election race, investors have sharply reduced their expectations about further US interest rate cuts in 2025. The upcoming December rate decision is unlikely to be impacted by this CPI report, unless we see a super-hot print. But whether the Fed will go ahead with a cut at its initial 2025 meetings will be influenced, among other key data highlights, by this CPI report, although it is employment that the Fed is now more focused on.
But after Friday’s somewhat of a softish NFP report, a 25-bps rate cut is now more likely than not. Indeed, market pricing of a December rate cut has risen to around 87% from 70% last week, although this has not yet had any further influence on the EUR/USD’s direction.

Source: TradingView.com
The EUR/USD has now had a few attempts to break above the 1.06 resistance area (i.e., the 1.0595-1.0610 range). So far, it has failed to post a daily close above this range to tip the balance in the bulls’ favour. But will that change as we head deeper into the week remains to be seen. For now, at least, the bulls will need to remain patient as we don’t have a concrete reversal signal to work with. A daily close above this resistance area could potentially pave the way for a short-squeeze rally towards the 1.0700 area, possibly 1.0775/80.
But while the 1.06 resistance area holds, the risks remain skewed to the downside. As such a break below the 1.0500 area is still a scenario that looks more likely than a sharp rally. The 1.0500 level is the most important support to watch in so far as the short-term outlook is concerned. A daily close below the 1.0450-1.0500 area could see the EUR/USD resume its bearish trend that started back in September. If that happens, then the next downside target would be the liquidity resting below the recent lows of around 1.0333 area. Thereafter, you have the round handles like 1.0300 and 1.0200 as the subsequent targets en route to potentially parity.
All told, the EUR/USD forecast is modestly bearish, and we could see the selling resume unless US CPI is super soft, or the ECB is not as dovish as markets are expecting.
— Written by Fawad Razaqzada, Market Analyst
Follow Fawad on Twitter @Trader_F_R
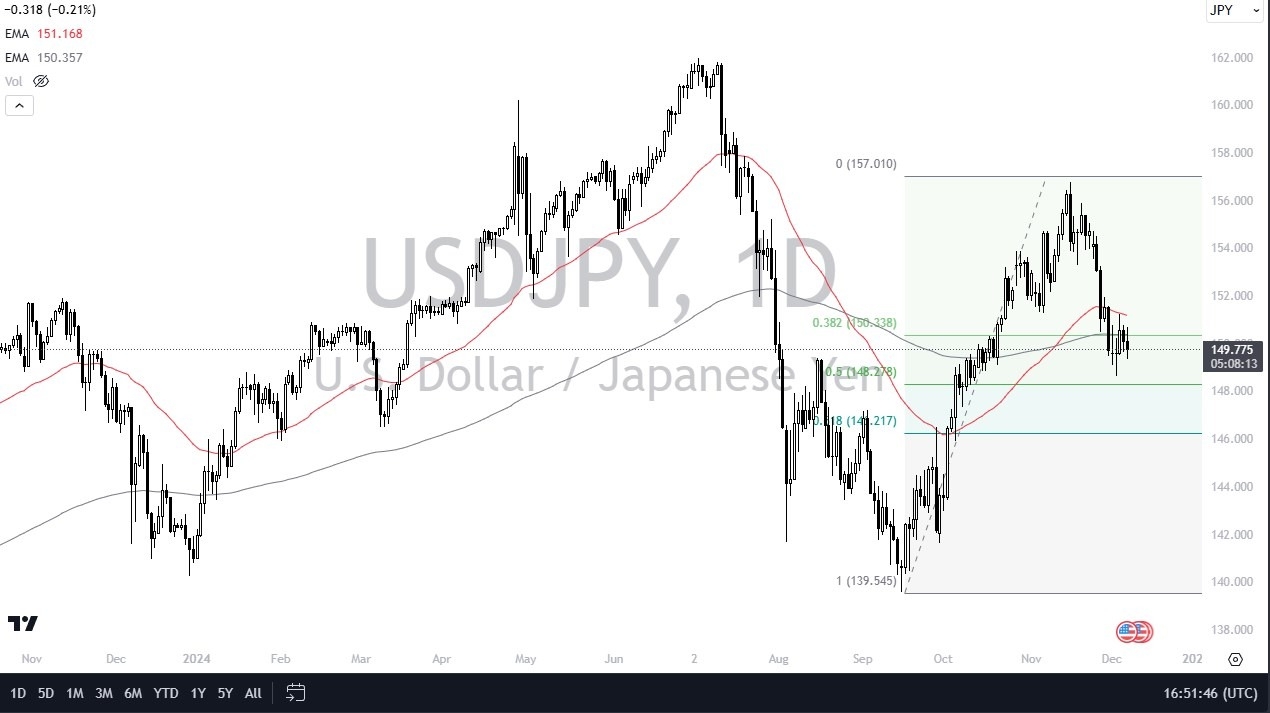
The candlestick for the Friday session is rather unimpressive, and we find ourselves sitting right around the crucial ¥150 level as well. With this being the case, think we have got a situation where traders are trying to figure out where to go next, but if we could get above the 50 Day EMA, then the market could really start to take off to the upside. This will be more likely than not if Jerome Powell sounds rather hawkish after the FOMC meeting, or perhaps even more impressively, if the Federal Reserve decides not to cut rates. Remember, the market has a 25 basis point rate cut priced in at the moment in the Fed Futures Funds markets.
While I’m not a huge Fibonacci ratio trader, it is worth noting that we had recently bounced from the 50% Fibonacci retracement level, and we are hanging around the 38.2% Fibonacci retracement level. While we haven’t necessarily set still, we really haven’t gone anywhere over the last week or so. The US dollar is stronger than most other currencies, but there are certain amount of traders out there pretending that the Bank of Japan can do something to tighten monetary policy. The endgame for Japan is a major collapse of the currency, just due to the massive amount of debt that the Japanese have been living on. However, that doesn’t mean it has to happen today, so I am waiting for a move above the 50 Day EMA to start buying again.
Want to trade our daily USD/JPY analysis and predictions? Here’s a list of forex brokers in Japan to check out.
According to Bloomberg Economics, US headline inflation is expected to be 0.2% month-on-month and 2.6% year-on-year last month, matching October’s figures. Forward-looking pricing and early submissions to the Bloomberg survey align with these expectations. For the Federal Reserve, steady inflation is likely to signal caution when assessing interest rate cuts at the December meeting. Experts at Bloomberg expect US core consumer prices—a better measure of underlying inflation pressures—to have risen by 0.3% in November, matching the previous month’s pace. Also, the data will be released during the Federal Reserve’s traditional blackout period on public comments ahead of the meeting. These figures, along with the non-farm payroll report released last week, will shape expectations for the Fed’s decision.
Despite the recent strong performance of the Pound, it may be susceptible to renewed selling in the coming trading sessions.
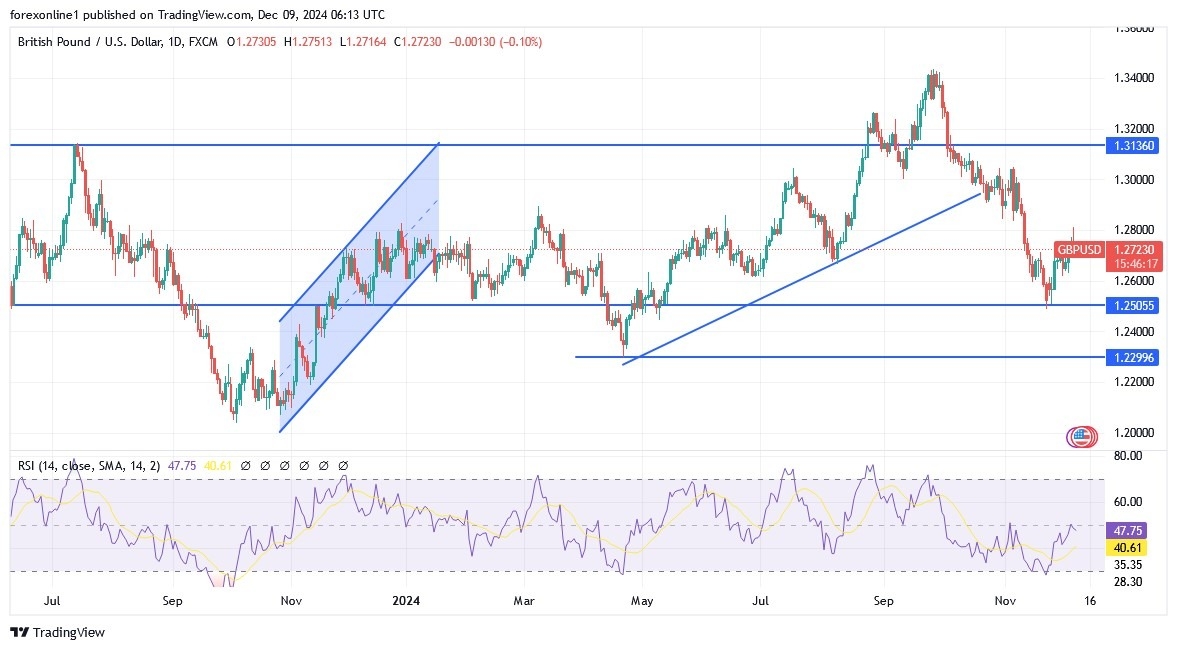
With the gains of the GBP/USD pair, the direction of the technical indicators, the RSI and the MACD, has shifted upwards, and to confirm the general trend has shifted to an upward trend, bulls should launch the currency pair towards the resistance levels of 1.2860. consequently, the psychological resistance of 1.3000. Otherwise, the technical gains of the pair will be subject to renewed selling operations to take profits, which we expect in the coming days. Especially, if the US inflation figures come out stronger than all expectations. The expected US trade wars have expanded, which increases the demand for buying the US dollar as a safe haven. As is known, the British pound is a risk currency. Decisively, it must be considered that returning to the 1.2600 level will end hopes for the recent rise for a period of time.
Ready to trade our Forex GBP/USD daily analysis and predictions? Here are the best forex trading platforms UK to choose from.
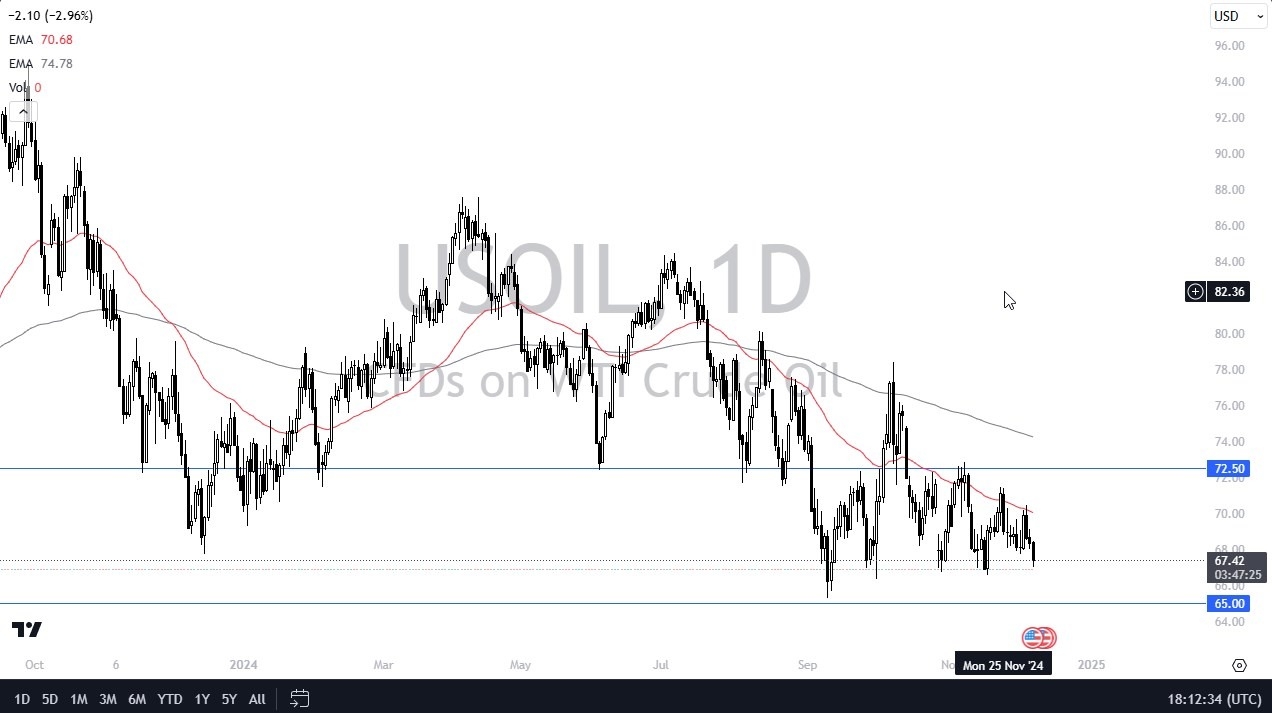
All things being equal, this is a market that I think if you see some type of bounce, you have to look at it as a short-term buying opportunity. The 50-day EMA is near the $70 level, and that of course is an area that I think would attract a lot of attention in and of itself, just due to the fact that it is such a big round hole number.
If we can break above there, then the crude oil market is likely to go looking to the $72.50 level above, which is a significant barrier also. If we were to break down below the $65 level, it’s likely that the bottom will fall out. But as things stand right now, I think what you’ve got here is a market that is just simply trying to hang on to the range that it’s been in for about three years.
The $65 level has been consistently important, so I like the idea of buying the pullback. Once we get a turnaround, perhaps a little bit of a balance in order to form a V on the chart, as it were. Whether or not we break out to the upside would be a completely different question, but as things stand right now, I think the market is just simply hanging around, killing time, seeing if it can find a reason to go higher. At this juncture, if you can watch the charts for short term trades, this is a market for you.
Ready to trade the daily crude oil Forex forecast? Here’s a list of some of the best Oil trading platforms to check out.