The main category of Forex News.
You can use the search box below to find what you need.
[wd_asp id=1]
The main category of Forex News.
You can use the search box below to find what you need.
[wd_asp id=1]
Because of that, if we break down from here, we could see the Euro just crater. That being said, it also somewhat lends itself to being a place for contrarian traders to get involved and start betting against the markets in general. It obviously would be a very difficult ride to the upside, but I think if we get beyond the 0.84 level, then you can have some credence for that.

If we break down below the 0.82 level, then like I said, we really start to drop perhaps all the way down to 0.77 before it’s all said and done. That would be a brutal sell-off, but not necessarily something that is out of the realm of possibility. I think both of these economies have major issues, but right now, I think the biggest problem that I know of is probably Germany, and that does not bode well for the euro overall.
The euro is basically a basket case at this point. And I think you continue to have the major issues of the fact that you have all of these countries that have trouble cooperating. We also have the issues in Ukraine and that’s not going anywhere. So really at this point in time, while I’m not necessarily overly bullish on the pound, I definitely don’t like the euro.That’s the main takeaway here. However, I am willing to go either way. If the market tells me, it’s time to start buying, then so be it.
Ready to trade our Forex daily forecast? We’ve shortlisted the best regulated forex brokers UK in the industry for you.
GBP/USD is trading at $1.26640, up 0.12%, showing a slight bullish tilt as it holds above the pivot point at $1.26443. Immediate resistance lies at $1.26916, with further targets at $1.27235 and $1.27500.
On the downside, key support levels to watch are $1.26179 and $1.25887. The pair is supported by an upward trendline, with the 50-day EMA at $1.26683 reinforcing near-term strength.
Meanwhile, the 200-day EMA at $1.26571 serves as a critical foundation for maintaining upward momentum. If prices remain above $1.26443, buyers could push toward the next resistance levels.
The Euro faced headwinds as manufacturing data across the Eurozone disappointed. Spain’s Manufacturing PMI dipped to 53.1 from 53.9, while Italy (44.5), France (43.1), and Germany (43.0) reported weaker-than-expected activity, all pointing to persistent contraction.
The bloc’s Final Manufacturing PMI held at 45.2, signaling ongoing economic challenges.
However, Italy’s unemployment rate improved to 5.8% from 6.0%. Markets now await Spanish unemployment data and France’s government budget balance for further direction.
The Silver price (XAG/USD) gains traction to near $30.90 during the early European session on Tuesday. The white metal edges higher due to the potential stimulus measures from China and ongoing geopolitical uncertainty.
However, JPMorgan analysts expect a near-term downside for base metals in early 2025 due to potential US tariffs on Chinese goods but see a recovery later in the year, bolstered by stronger Chinese economic stimulus and improved valuations.
According to the daily chart, Silver is set to resume its upside as the price crosses above the key 100-day Exponential Moving Average (EMA). However, further consolidation cannot be ruled out as the 14-day Relative Strength Index (RSI) hovers around the midline, indicating the neutral momentum of the white metal.
The immediate resistance level for XAG/USD emerges near the upper boundary of the Bollinger Band of $31.68. Any follow-through buying above this level could pave the way to the $32.90-$33.00 zone, representing the psychological level and the high of November 5. The additional upside filter to watch is $34.55, the high of October 29.
In the bearish event, sustained trading below $30.50, the 100-day EMA, could see a drop to $29.65, the low of November 28. A breach of the mentioned level could expose $27.70, the low of September 9.
Silver is a precious metal highly traded among investors. It has been historically used as a store of value and a medium of exchange. Although less popular than Gold, traders may turn to Silver to diversify their investment portfolio, for its intrinsic value or as a potential hedge during high-inflation periods. Investors can buy physical Silver, in coins or in bars, or trade it through vehicles such as Exchange Traded Funds, which track its price on international markets.
Silver prices can move due to a wide range of factors. Geopolitical instability or fears of a deep recession can make Silver price escalate due to its safe-haven status, although to a lesser extent than Gold’s. As a yieldless asset, Silver tends to rise with lower interest rates. Its moves also depend on how the US Dollar (USD) behaves as the asset is priced in dollars (XAG/USD). A strong Dollar tends to keep the price of Silver at bay, whereas a weaker Dollar is likely to propel prices up. Other factors such as investment demand, mining supply – Silver is much more abundant than Gold – and recycling rates can also affect prices.
Silver is widely used in industry, particularly in sectors such as electronics or solar energy, as it has one of the highest electric conductivity of all metals – more than Copper and Gold. A surge in demand can increase prices, while a decline tends to lower them. Dynamics in the US, Chinese and Indian economies can also contribute to price swings: for the US and particularly China, their big industrial sectors use Silver in various processes; in India, consumers’ demand for the precious metal for jewellery also plays a key role in setting prices.
Silver prices tend to follow Gold’s moves. When Gold prices rise, Silver typically follows suit, as their status as safe-haven assets is similar. The Gold/Silver ratio, which shows the number of ounces of Silver needed to equal the value of one ounce of Gold, may help to determine the relative valuation between both metals. Some investors may consider a high ratio as an indicator that Silver is undervalued, or Gold is overvalued. On the contrary, a low ratio might suggest that Gold is undervalued relative to Silver.
Gold price is nursing losses below $2,650 in Asian trades on Tuesday, though remaining in the recent range, awaiting the key US employment data for further trading directives. The US JOLTS Job Openings data will set off the critical week of top-tier labor data, offering hints on the US Federal Reserve’s (Fed) future interest rate cuts.
The focus now seems to have shifted toward the sentiment surrounding the Fed policy outlook following the latest speeches from several Fed policymakers and ahead of Friday’s Nonfarm Payrolls (NFP) data.
The US Dollar (USD) returned to the red in American trading on Monday after Fed Governor Christopher Waller said that “policy is still restrictive enough that an additional cut at our next meeting will not dramatically change the stance of monetary policy and allow ample scope to later slow the pace of rate cuts, if needed, to maintain progress toward our inflation target.”
The Greenback erased gains from the first half of Monday’s trading, spurred by broad risk-aversion as traders took account of US President-elect Donald Trump’s weekend warning against the so-called ‘BRICS’ nations. Trump threatened 100% tariffs on Brazil, Russia, India, China and South Africa if they create a new currency or support another currency that would replace the Greenback.
However, the revival of the haven demand for the USD early Tuesday keeps Gold buyers on the back seat. Persistent China’s economic concerns and the global tariff threat from Trump remain a drag on investors’ sentiment.
The next direction in Gold price will likely hinge on the upcoming US employment data and their impact on the Fed rate cut expectations. Markets are currently pricing in a 75% probability of a 25 basis points (bps) rate cut later this month, the CME Group’s FedWatch Tool shows, up from about 65% seen a day ago. Dovish Fed expectations tend to benefit the non-interest-bearing Gold price.
Meanwhile, Gold traders also remain wary of the geopolitical tensions between Russia and Ukraine and Israel and Iran, which could have a strong bearing on the traditional safe-haven asset, Gold price.
Having closed below the critical short-term 21-day Simple Moving Average (SMA) support, now at $2,641, Gold buyers seem reluctant to step in.
The 14-day Relative Strength Index (RSI) sits beneath the 50 level, justifying the cautious approach.
The previous week’s Bear Cross also remains in play, adding to the downside risks in Gold price.
Gold sellers need to crack the $2,621 static support to challenge the previous week’s low of $2,605.
A sustained drop below that level could expose the 100-day SMA at $2,577.
Conversely, recapturing the 21-day SMA support-turned-resistance at $2,641 is critical to reviving the recent recovery.
The next relevant resistance aligns at the 50-day SMA at $2,669, above which the $2,700 level will be on buyers’ radars.
JOLTS Job Openings is a survey done by the US Bureau of Labor Statistics to help measure job vacancies. It collects data from employers including retailers, manufacturers and different offices each month.
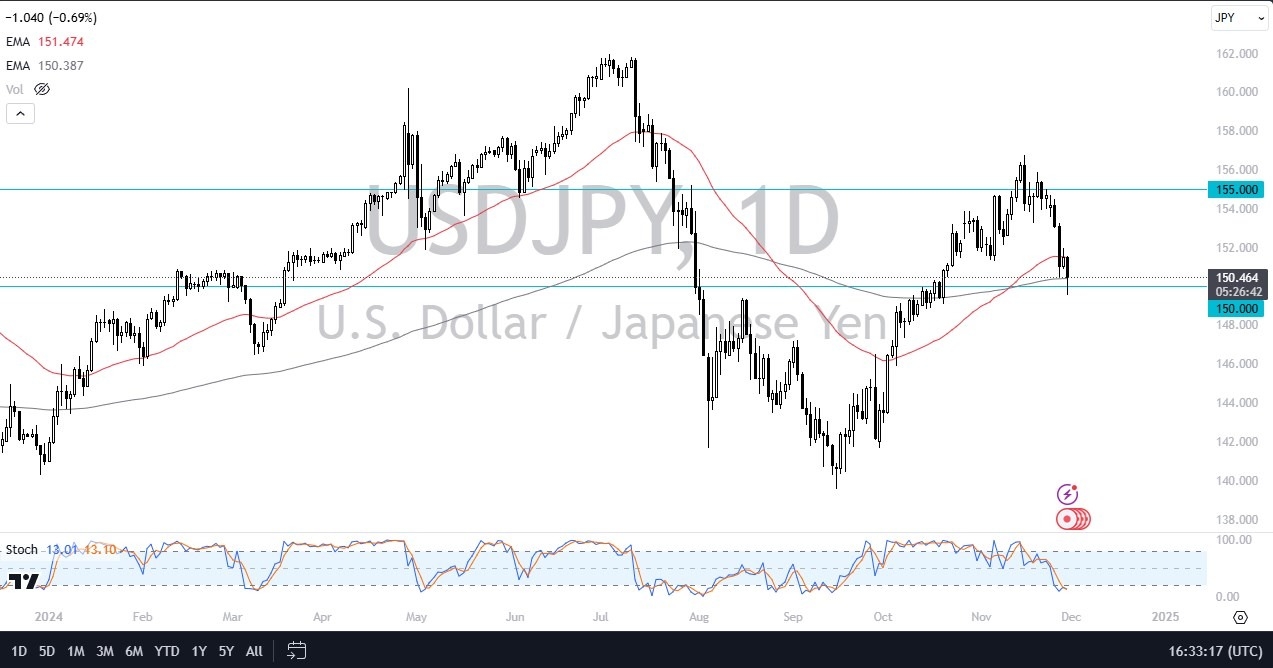
We are right around the 200 day EMA, so I would anticipate a certain amount of technical trading in this area regardless. The fact that the 150 yen level is a large round psychologically significant figure is probably something worth paying attention to anyways. Ultimately, I think this is a situation where if we can break above the top of the candlestick for the Friday session, then we could really start to take off towards the 155 yen level.
On the other hand, if we break down below the bottom of the candlestick for the USD/JPY trading session on Friday, then we could go down to the 148 in level, possibly even 146 yen. There is an interest rate differential that you need to pay close attention to. With that being said, I think you’ve got to look at this as a scenario where traders will probably continue to find one way or the other to take advantage of this interest rate differential.
If things settle down. When you look at the pullback that we’ve seen from the bounce, we’re only at about the 38.2% Fibonacci retracement level. So really, it is still technically bullish. It’s just been tough to be bullish over the last four or five sessions. A bounce from here though, would solidify the idea of people taking advantage of the carry trade. So, we’ll have to wait and see how that plays out.
Want to trade our USD/JPY forex analysis and predictions? Here’s a list of forex brokers in Japan to check out.
Previous resistance around the June peak of 3.16 was tested as support today. It has stalled the decline so far, but whether it continues to do so remains to be seen. The 50% retracement level is at 3.13, and it was almost reached today. Although natural gas has reached a price zone where support may be seen there is no sign of increasing demand or a bullish reversal. Therefore, the expectation is for a continuation lower upon a decisive drop below today’s low.
If natural gas does fall below today’s low and continues to decline, then previous resistance from the 3.02 swing high may be the next area of support. However, there are price levels nearby to be aware of as well. One guide is provided by the internal uptrend line. But clearer price levels where support may be seen are from 3.04 to 2.90.
A falling ABCD pattern (purple) reaches its 100% downside target around 3.04. Then there is both a prior swing high and the 61.8% Fibonacci retracement at 3.02. And most importantly, the 20-Day MA is at 3.01. The 20-Day line has been successfully tested twice as support since it was reclaimed on October 29.
There is also the possibility that the day’s low price completed a retracement. If that is the case a decisive rally above today’s high of 3.28 indicates improving demand. Friday’s high of 3.38 would then need to be reclaimed for further signs of strength. Since natural gas is within the first pullback following a decisive bull breakout, it presents an interesting potential setup that will be watched closely by market participants.
It is currently within the first pullback following a significant breakout. On November 20 natural gas busted through the 3.02 swing high resistance level and triggered a breakout of a symmetrical triangle pattern and the continuation of the uptrend begun from the 2024 low of 1.52.
For a look at all of today’s economic events, check out our economic calendar.
Today, the yield on 10-year US Treasury bonds rose to more than 4.2%, reflecting a two-week decline, and its gains came with increasing speculation among investors about the strong US economic performance before the new year 2025. Also, the rise in bond yields followed the rally in the US dollar after a sharp threat from Trump to the BRICS group of countries. Correspondingly, he stated that he would impose a 100% tariff if the BRICS countries created or supported a new currency that could replace the dollar.
In terms of monetary policy, financial markets are currently betting on the possibility of the Federal Reserve cutting US interest rates by 25 basis points this month by 67%, up from 53% a week ago. In general, investors are now focusing on US jobs data and statements from a number of US Federal Reserve policy officials.
According to stock trading platforms, US stock futures have seen little change today as investors seek new catalysts in the last month of 2024. Overall, US stock market indices have emerged from a strong week and month, with the three major indices rising between 1.1% and 1.45% last week and rising between 5.7% and 7.8% in November trading. Also, the Dow Jones and S&P 500 indices hit all-time highs on Friday. Simultaneously, these gains were largely driven by the rally that followed the election after the decisive victory of President-elect Donald Trump. Ultimately, the resilience of the US economy and the corporate sector also boosted investor sentiment.
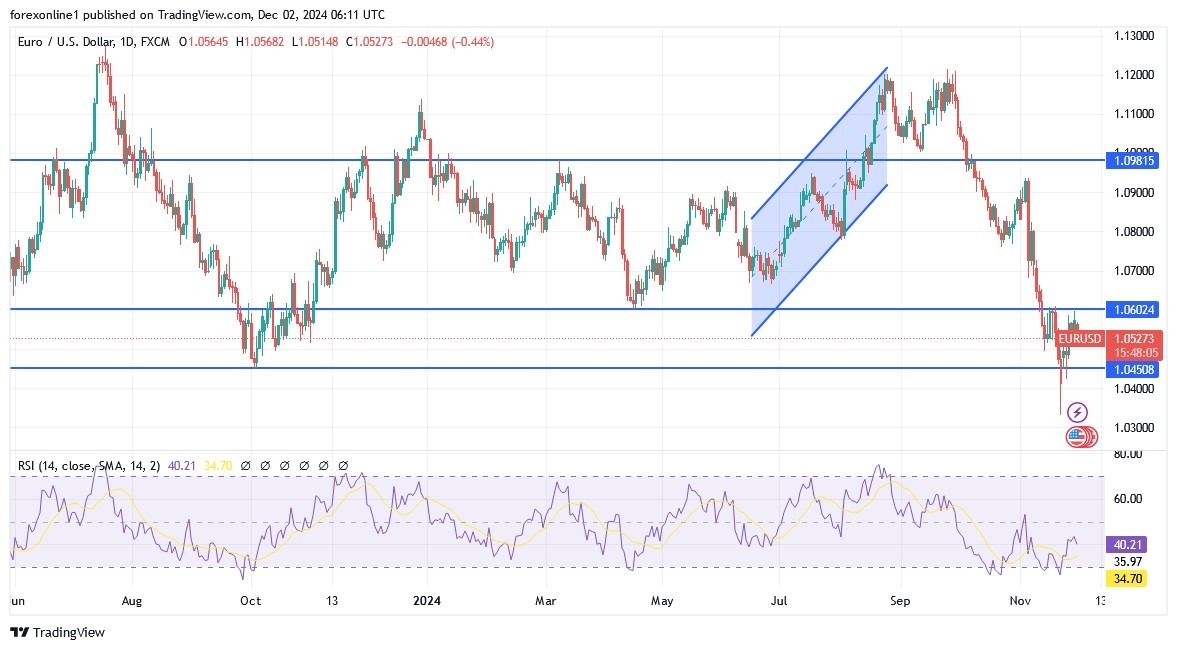
My technical outlook for the EUR/USD currency pair remains unchanged. The overall trend is still downward, and as we mentioned before and confirm now, the stability of the euro-dollar around and below the support level of 1.0500 will continue to encourage the dominance of the bears on the trend. Furthermore, the expectations will return to the proximity of the euro-dollar parity if the bears succeed in pushing the currency pair towards the support levels of 1.0455 and 1.0380 again. Technically, these levels and below will push the technical indicators towards strong oversold levels. Conversely, and based on the daily chart, the psychological resistance of 1.1000 will remain the most important for a shift in the euro-dollar direction to bullish.
Based on the above analysis, we recommend selling the EUR/USD currency pair from every upward level. To get EUR/USD signals and other free trading signals, follow our website exclusively. Favourably, consider a trading strategy that avoids risk and activates take-profit and stop-loss orders to ensure the safety of your trading account from any sudden price fluctuations.
Ready to trade our EUR/USD Forex analysis? We’ve made a list of the best forex trading platforms for beginners worth trading with.
The Pound Sterling tumbled over 0.50% against the Greenback on Monday, as the latter recovered from last week’s losses, remaining bid on Monday. At the time of writing, the GBP/USD trades at 1.2659, dropping after reaching a daily high of 1.2735.
The GBP/USD downtrend remains intact, and it could be threatened if buyers clear the 200-day Simple Moving Average (SMA) at 1.2818. Sellers must clear the November 28 daily low of 1.2644 before extending their drop to 1.2600. A breach of the latter will expose the latest major support at 1.2486, the November 22 swing low, followed by the current year’s low of 1.2299.
Conversely, if GBP/USD clears the 1.2700 figure, the first resistance would be the 1.2800 figure, followed by the 200-day SMA at 1.2818. Once those two levels are surpassed, it would emerge 1.2900 and the 50-day SMA as next key resistance at 1.2943.
The momentum remains bearish, as depicted by the Relative Strength Index (RSI), which aims to be lower at the beginning of December.
The table below shows the percentage change of British Pound (GBP) against listed major currencies today. British Pound was the strongest against the Australian Dollar.
| USD | EUR | GBP | JPY | CAD | AUD | NZD | CHF | |
|---|---|---|---|---|---|---|---|---|
| USD | 0.94% | 0.81% | 0.16% | 0.58% | 0.93% | 0.90% | 0.79% | |
| EUR | -0.94% | -0.17% | -0.77% | -0.34% | 0.08% | -0.03% | -0.13% | |
| GBP | -0.81% | 0.17% | -0.63% | -0.17% | 0.25% | 0.15% | 0.02% | |
| JPY | -0.16% | 0.77% | 0.63% | 0.43% | 0.81% | 0.77% | 0.57% | |
| CAD | -0.58% | 0.34% | 0.17% | -0.43% | 0.50% | 0.32% | 0.19% | |
| AUD | -0.93% | -0.08% | -0.25% | -0.81% | -0.50% | -0.11% | -0.27% | |
| NZD | -0.90% | 0.03% | -0.15% | -0.77% | -0.32% | 0.11% | -0.11% | |
| CHF | -0.79% | 0.13% | -0.02% | -0.57% | -0.19% | 0.27% | 0.11% |
The heat map shows percentage changes of major currencies against each other. The base currency is picked from the left column, while the quote currency is picked from the top row. For example, if you pick the British Pound from the left column and move along the horizontal line to the US Dollar, the percentage change displayed in the box will represent GBP (base)/USD (quote).
Resurgent US Dollar strength weighed modesty on Gold price, with XAU/USD posting intraday losses. The pair hovers around $2,640 in the American session and aims to extend its slump following better-than-anticipated United States (US) data.
S&P Global released the final estimate of the November Manufacturing Purchasing Manager Index (PMI), upwardly revised to 49.7 from the preliminary estimate of 48.8. The official ISM Manufacturing PMI for the same month printed at 48.4, better than the 47.5 expected and the previous 46.5.
Meanwhile, Wall Street trades mixed, with the Dow Jones Industrial Average down over 100 points, but the S&P500 and the Nasdaq Composite up for the day. The sentiment soured on weekend news, pointing to political turmoil in France and mounting tensions between the US and Russia after President-elect Donald Trump threatened to impose tariffs on BRICS countries over the weekend.
Attention this week will be on US employment data, as the country will release multiple job-related figures ahead of the Nonfarm Payrolls (NFP) report on Friday.
From a technical point of view, XAU/USD remains confined to familiar levels, still struggling to find a directional way. In the daily chart, the pair struggles around a mildly bearish 20 Simple Moving Average (SMA) while the 100 and 200 SMAs maintain their bullish slopes well below the current level. Technical indicators, however, have turned flat at around their midlines, in line with the absence of a clear trend.
In the near-term, and according to the 4-hour chart, XAU/USD is neutral-to-bearish the bright metal stands below a flat 20 SMA while above an also directionless 100 SMA not far below the shorter one. The 200 SMA, in the meantime, stands in the $2,690 region, providing dynamic resistance. Finally, technical indicators turned lower around their midlines, lacking momentum enough to support a bearish continuation.
Support levels: 2,626.70 2,611.35 2,598.70
Resistance levels: 2,643.30 2,655.00 2,671.55
Important DisclaimersThe content provided on the website includes general news and publications, our personal analysis and opinions, and contents provided by third parties, which are intended for educational and research purposes only. It does not constitute, and should not be read as, any recommendation or advice to take any action whatsoever, including to make any investment or buy any product. When making any financial decision, you should perform your own due diligence checks, apply your own discretion and consult your competent advisors. The content of the website is not personally directed to you, and we does not take into account your financial situation or needs.The information contained in this website is not necessarily provided in real-time nor is it necessarily accurate. Prices provided herein may be provided by market makers and not by exchanges.Any trading or other financial decision you make shall be at your full responsibility, and you must not rely on any information provided through the website. FX Empire does not provide any warranty regarding any of the information contained in the website, and shall bear no responsibility for any trading losses you might incur as a result of using any information contained in the website.The website may include advertisements and other promotional contents, and FX Empire may receive compensation from third parties in connection with the content. FX Empire does not endorse any third party or recommends using any third party’s services, and does not assume responsibility for your use of any such third party’s website or services.FX Empire and its employees, officers, subsidiaries and associates, are not liable nor shall they be held liable for any loss or damage resulting from your use of the website or reliance on the information provided on this website.Risk DisclaimersThis website includes information about cryptocurrencies, contracts for difference (CFDs) and other financial instruments, and about brokers, exchanges and other entities trading in such instruments. Both cryptocurrencies and CFDs are complex instruments and come with a high risk of losing money. You should carefully consider whether you understand how these instruments work and whether you can afford to take the high risk of losing your money.FX Empire encourages you to perform your own research before making any investment decision, and to avoid investing in any financial instrument which you do not fully understand how it works and what are the risks involved.