The main category of Forex News.
You can use the search box below to find what you need.
[wd_asp id=1]
The main category of Forex News.
You can use the search box below to find what you need.
[wd_asp id=1]
GBP/USD rose more than 1.5% in the previous week and registered weekly gains for the first time since late September. The pair, however, started the new week under bearish pressure and retreated slightly below 1.2700 by the European morning on Monday.
The table below shows the percentage change of British Pound (GBP) against listed major currencies today. British Pound was the weakest against the US Dollar.
| USD | EUR | GBP | JPY | CAD | AUD | NZD | CHF | |
|---|---|---|---|---|---|---|---|---|
| USD | 0.73% | 0.38% | 0.32% | 0.40% | 0.30% | 0.38% | 0.55% | |
| EUR | -0.73% | -0.39% | -0.41% | -0.32% | -0.34% | -0.33% | -0.15% | |
| GBP | -0.38% | 0.39% | -0.06% | 0.07% | 0.06% | 0.06% | 0.21% | |
| JPY | -0.32% | 0.41% | 0.06% | 0.11% | 0.05% | 0.13% | 0.21% | |
| CAD | -0.40% | 0.32% | -0.07% | -0.11% | 0.06% | -0.01% | 0.14% | |
| AUD | -0.30% | 0.34% | -0.06% | -0.05% | -0.06% | 0.00% | 0.15% | |
| NZD | -0.38% | 0.33% | -0.06% | -0.13% | 0.01% | -0.00% | 0.18% | |
| CHF | -0.55% | 0.15% | -0.21% | -0.21% | -0.14% | -0.15% | -0.18% |
The heat map shows percentage changes of major currencies against each other. The base currency is picked from the left column, while the quote currency is picked from the top row. For example, if you pick the British Pound from the left column and move along the horizontal line to the US Dollar, the percentage change displayed in the box will represent GBP (base)/USD (quote).
The renewed US Dollar (USD) strength forces GBP/USD to stay on the back foot. The market reaction to US President-elect Donald Trump’s comments on social media boosted the USD at the weekly opening.
Trump threatened BRICS members with 100% tariffs if they were to try to replace the USD. “We require a commitment from these countries that they will neither create a new BRICS currency, nor back any other currency to replace the mighty US Dollar or, they will face 100% tariffs, and should expect to say goodbye to selling into the wonderful US economy,” he said on X.
In addition to Trump comments, the cautious market mood makes it difficult for GBP/USD to gain traction. At the time of press, US stock index futures were down about 0.2% and the UK’s FTSE 100 Index was trading marginally lower on the day.
In the second half of the day, the ISM will release November Manufacturing PMI data. In case the headline comes in above 50 and shows a rebound into expansion territory in the manufacturing sector’s economic activity, the immediate reaction could help the USD gather further strength. Conversely, a weaker-than-forecast print could have the opposite effect on the currency and allow GBP/USD to hold its ground.
Despite the decline seen at the beginning of the week, the Relative Strength Index (RSI) indicator on the 4-hour chart holds slightly above 50 and GBP/USD manages to stay a float a few pips above the 100-period Simple Moving Average, suggesting that the buildup of bearish momentum is not yet strong enough to trigger a reversal.
On the downside, 1.2690 (100-period SMA) aligns as immediate support. If GBP/USD falls below this level and starts using it as resistance, 1.2630 (50-period SMA, static level) could be seen as next support before 1.2600. On the flip side, the pair could face resistance at 1.2750 (static level) ahead of 1.2800 (static level, round level) and 1.2825 (200-period SMA).
The Pound Sterling (GBP) is the oldest currency in the world (886 AD) and the official currency of the United Kingdom. It is the fourth most traded unit for foreign exchange (FX) in the world, accounting for 12% of all transactions, averaging $630 billion a day, according to 2022 data. Its key trading pairs are GBP/USD, also known as ‘Cable’, which accounts for 11% of FX, GBP/JPY, or the ‘Dragon’ as it is known by traders (3%), and EUR/GBP (2%). The Pound Sterling is issued by the Bank of England (BoE).
The single most important factor influencing the value of the Pound Sterling is monetary policy decided by the Bank of England. The BoE bases its decisions on whether it has achieved its primary goal of “price stability” – a steady inflation rate of around 2%. Its primary tool for achieving this is the adjustment of interest rates. When inflation is too high, the BoE will try to rein it in by raising interest rates, making it more expensive for people and businesses to access credit. This is generally positive for GBP, as higher interest rates make the UK a more attractive place for global investors to park their money. When inflation falls too low it is a sign economic growth is slowing. In this scenario, the BoE will consider lowering interest rates to cheapen credit so businesses will borrow more to invest in growth-generating projects.
Data releases gauge the health of the economy and can impact the value of the Pound Sterling. Indicators such as GDP, Manufacturing and Services PMIs, and employment can all influence the direction of the GBP. A strong economy is good for Sterling. Not only does it attract more foreign investment but it may encourage the BoE to put up interest rates, which will directly strengthen GBP. Otherwise, if economic data is weak, the Pound Sterling is likely to fall.
Another significant data release for the Pound Sterling is the Trade Balance. This indicator measures the difference between what a country earns from its exports and what it spends on imports over a given period. If a country produces highly sought-after exports, its currency will benefit purely from the extra demand created from foreign buyers seeking to purchase these goods. Therefore, a positive net Trade Balance strengthens a currency and vice versa for a negative balance.
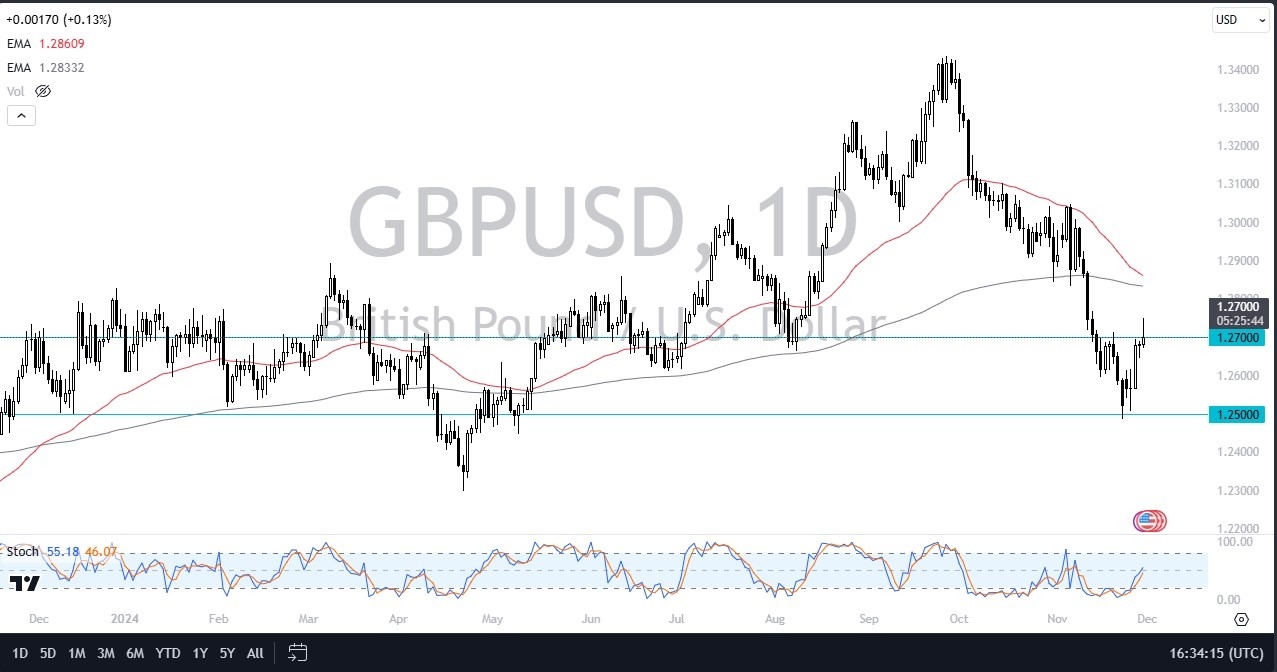
So, it’ll be interesting to see if we can go higher from here. If we can sustain and move above the top of this candlestick, then I think you do have a rally just waiting to happen, probably for about another 125 pips, maybe 150 pips from there. On the other hand, if we break down from here, that just tells me we’ve got more work to do in this range between 1.25 and 1.27.

All things being equal, a lot of this will come down to risk appetite because the US dollar is considered to be a safety currency. The British pound, while not necessarily the riskiest currency in the world, is considered to be a little further out on the spectrum. Interest rate differential is negligible between the United States and Great Britain. So, I don’t even think that comes into the picture. The pound has been a little bit more resilient against the greenback than many other currencies.
I watch this GBP/USD pair a lot just because it gives me an idea as to how the US dollar is doing because if it can squash the British pound, it’ll do a number on several other currencies, perhaps even currencies like the Japanese yen. So, I’m watching very closely. It’s a bit of a binary setup. We’ll just have to see how this plays out. If we break higher, we go higher. If we break down below the bottom of the candlestick we continue to see more back and forth.
Ready to trade our Forex GBP/USD daily forecast? We’ve shortlisted the best regulated forex brokers UK in the industry for you.
EUR/USD struggles to build on the previous week’s gains and declines toward 1.0500 in the European morning on Monday. The technical outlook points to a bearish tilt in the near term.
The table below shows the percentage change of Euro (EUR) against listed major currencies today. Euro was the weakest against the US Dollar.
| USD | EUR | GBP | JPY | CAD | AUD | NZD | CHF | |
|---|---|---|---|---|---|---|---|---|
| USD | 0.72% | 0.39% | 0.33% | 0.39% | 0.24% | 0.38% | 0.46% | |
| EUR | -0.72% | -0.36% | -0.38% | -0.31% | -0.38% | -0.32% | -0.22% | |
| GBP | -0.39% | 0.36% | -0.06% | 0.05% | -0.01% | 0.04% | 0.11% | |
| JPY | -0.33% | 0.38% | 0.06% | 0.06% | -0.04% | 0.09% | 0.08% | |
| CAD | -0.39% | 0.31% | -0.05% | -0.06% | 0.01% | -0.00% | 0.06% | |
| AUD | -0.24% | 0.38% | 0.00% | 0.04% | -0.01% | 0.05% | 0.10% | |
| NZD | -0.38% | 0.32% | -0.04% | -0.09% | 0.00% | -0.05% | 0.09% | |
| CHF | -0.46% | 0.22% | -0.11% | -0.08% | -0.06% | -0.10% | -0.09% |
The heat map shows percentage changes of major currencies against each other. The base currency is picked from the left column, while the quote currency is picked from the top row. For example, if you pick the Euro from the left column and move along the horizontal line to the US Dollar, the percentage change displayed in the box will represent EUR (base)/USD (quote).
The negative shift seen in risk mood and US President-elect Donald Trump’s comments on BRICS help the US Dollar (USD) gather strength at the beginning of the week.
Over the weekend, Trump warned against BRICS nations trying to replace the USD with their own currency. “We require a commitment from these countries that they will neither create a new BRICS currency, nor back any other currency to replace the mighty US Dollar or, they will face 100% tariffs, and should expect to say goodbye to selling into the wonderful US economy,” he said on X.
Meanwhile, US stock index futures were last seen losing above 0.2% on the day, reflecting the cautious market stance.
Later in the day, the ISM Manufacturing PMI data will be featured in the US economic docket. The headline PMI is forecast to edge higher to 47.5 in November from 46.5 in October. A reading above 50 could boost the USD and further weigh on the pair. On the other hand, a disappointing reading could hurt the USD with the immediate reaction. Nevertheless, EUR/USD’s recovery attempts could remain limited unless the risk mood improves in the second half of the day.
The Relative Strength Index (RSI) indicator on the 4-hour chart declined below 50 and EUR/USD closed the last three 4-hour candles below the 100-period Simple Moving Average (SMA), despite ending the week slightly above it.
On the downside, immediate support is located at 1.0500 (static level, round level) before 1.0440 (static level) and 1.0400 (static level, round level). Looking north, first resistance could be spotted at 1.0550 (100-period SMA) ahead of 1.0610 (static level) and 1.0660 (static level).
The Euro is the currency for the 19 European Union countries that belong to the Eurozone. It is the second most heavily traded currency in the world behind the US Dollar. In 2022, it accounted for 31% of all foreign exchange transactions, with an average daily turnover of over $2.2 trillion a day. EUR/USD is the most heavily traded currency pair in the world, accounting for an estimated 30% off all transactions, followed by EUR/JPY (4%), EUR/GBP (3%) and EUR/AUD (2%).
The European Central Bank (ECB) in Frankfurt, Germany, is the reserve bank for the Eurozone. The ECB sets interest rates and manages monetary policy. The ECB’s primary mandate is to maintain price stability, which means either controlling inflation or stimulating growth. Its primary tool is the raising or lowering of interest rates. Relatively high interest rates – or the expectation of higher rates – will usually benefit the Euro and vice versa. The ECB Governing Council makes monetary policy decisions at meetings held eight times a year. Decisions are made by heads of the Eurozone national banks and six permanent members, including the President of the ECB, Christine Lagarde.
Eurozone inflation data, measured by the Harmonized Index of Consumer Prices (HICP), is an important econometric for the Euro. If inflation rises more than expected, especially if above the ECB’s 2% target, it obliges the ECB to raise interest rates to bring it back under control. Relatively high interest rates compared to its counterparts will usually benefit the Euro, as it makes the region more attractive as a place for global investors to park their money.
Data releases gauge the health of the economy and can impact on the Euro. Indicators such as GDP, Manufacturing and Services PMIs, employment, and consumer sentiment surveys can all influence the direction of the single currency. A strong economy is good for the Euro. Not only does it attract more foreign investment but it may encourage the ECB to put up interest rates, which will directly strengthen the Euro. Otherwise, if economic data is weak, the Euro is likely to fall. Economic data for the four largest economies in the euro area (Germany, France, Italy and Spain) are especially significant, as they account for 75% of the Eurozone’s economy.
Another significant data release for the Euro is the Trade Balance. This indicator measures the difference between what a country earns from its exports and what it spends on imports over a given period. If a country produces highly sought after exports then its currency will gain in value purely from the extra demand created from foreign buyers seeking to purchase these goods. Therefore, a positive net Trade Balance strengthens a currency and vice versa for a negative balance.
The GBP/USD pair tumbles to near 1.2700 during the early European session on Monday, pressured by the firmer US Dollar (USD) broadly. The US President-elect Donald Trump’s tariff threats, the rising geopolitical tensions in West Asia and the rising expectation for less aggressive Fed rate cuts support the Greenback and act as a headwind for GBP/USD. The release of US ISM Manufacturing Purchasing Managers Index (PMI) data will be the highlight on Monday.
Technically, the negative view of GBP/USD prevails, with the price holding below the key 100-day Exponential Moving Average (EMA) on the daily chart. The downward momentum of the major pair is reinforced by the 14-day Relative Strength Index (RSI), which stands below the midline around 44.40.
The initial support level for GBP/USD emerges at the 1.2600 psychological level. Sustained bearish momentum could drag the major pair to the lower limit of the Bollinger Band at 1.2445. A break below this level could push prices lower toward 1.2331, the low of April 23.
On the bright side, the first upside barrier is located at 1.2834, the low of November 6. Extended gains above this level could pave the way for a test of the 1.2890-1.2900 zone, representing the round mark and the 100-day EMA. The psychological level and the upper boundary of the Bollinger Band of 1.3000 appear to be a tough nut to crack for bulls.
The Pound Sterling (GBP) is the oldest currency in the world (886 AD) and the official currency of the United Kingdom. It is the fourth most traded unit for foreign exchange (FX) in the world, accounting for 12% of all transactions, averaging $630 billion a day, according to 2022 data. Its key trading pairs are GBP/USD, also known as ‘Cable’, which accounts for 11% of FX, GBP/JPY, or the ‘Dragon’ as it is known by traders (3%), and EUR/GBP (2%). The Pound Sterling is issued by the Bank of England (BoE).
The single most important factor influencing the value of the Pound Sterling is monetary policy decided by the Bank of England. The BoE bases its decisions on whether it has achieved its primary goal of “price stability” – a steady inflation rate of around 2%. Its primary tool for achieving this is the adjustment of interest rates. When inflation is too high, the BoE will try to rein it in by raising interest rates, making it more expensive for people and businesses to access credit. This is generally positive for GBP, as higher interest rates make the UK a more attractive place for global investors to park their money. When inflation falls too low it is a sign economic growth is slowing. In this scenario, the BoE will consider lowering interest rates to cheapen credit so businesses will borrow more to invest in growth-generating projects.
Data releases gauge the health of the economy and can impact the value of the Pound Sterling. Indicators such as GDP, Manufacturing and Services PMIs, and employment can all influence the direction of the GBP. A strong economy is good for Sterling. Not only does it attract more foreign investment but it may encourage the BoE to put up interest rates, which will directly strengthen GBP. Otherwise, if economic data is weak, the Pound Sterling is likely to fall.
Another significant data release for the Pound Sterling is the Trade Balance. This indicator measures the difference between what a country earns from its exports and what it spends on imports over a given period. If a country produces highly sought-after exports, its currency will benefit purely from the extra demand created from foreign buyers seeking to purchase these goods. Therefore, a positive net Trade Balance strengthens a currency and vice versa for a negative balance.
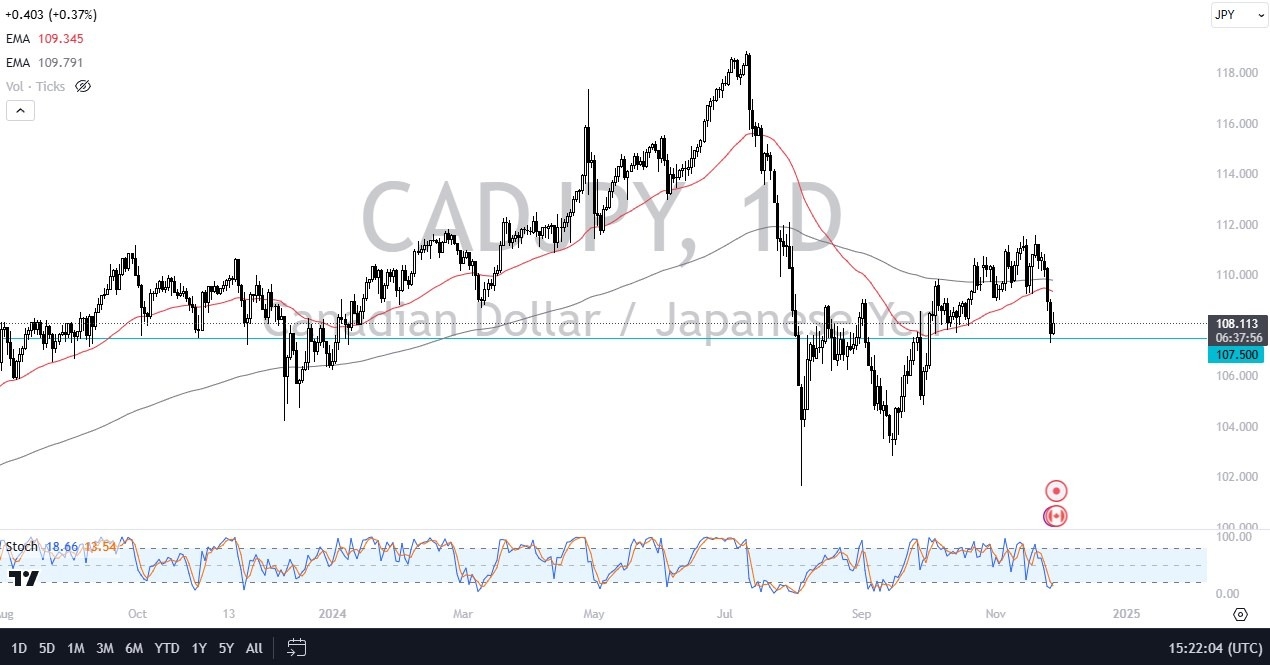
The 107.50 yen level is an area that I think a lot of people will be paying close attention to. Although I don’t think it’s a massive support level, I do think it’s one that has a little bit of history. If we can break higher from here and clear the 50 day EMA near the 109.50 yen level, then it opens up a move to the 111.50 yen level.
This CAD/JPY pair will more likely than not end up being a situation where it’s probably going to be more about the yen than anything else. Pay attention to how the Japanese yen is behaving against multiple other currencies, and you’ll probably get the direction of this pair correct. If we were to break down below the 107 point volume zero yen level, then it’s possible that we could see a steeper decline, perhaps all the way down to 104 yen.
That would accompany other yen related pairs falling. It wouldn’t just be this one. So again, I think this is more about the Japanese yen than it is the Canadian dollar. Although we do have Canadian GDP coming out on Friday that could change things. But recently all yen related pairs have all moved in the same manner and in the same type of momentum. And I think that continues to be the case going into the future.
Want to trade our daily forex analysis and predictions? Here’s a list of forex brokers in Japan to check out.
Giá cà phê hôm nay ngày December 1, 2024 trên thị trường world, at 4:30 am updated on the Vietnam Commodity Exchange MXV (world coffee prices are continuously updated by MXV, matching with world exchanges, the only channel in Vietnam that continuously updates and links with world exchanges). Today’s online coffee prices of the three main coffee futures exchanges ICE Futures Europe, ICE Futures US and B3 Brazil are continuously updated by Y5Cafe during the trading hours of the exchange, updated as follows:
Kết thúc phiên giao dịch, giá cà phê Robusta trên sàn London lúc 4h30 ngày December 1, 2024 tiếp tục giảm ở phiên thứ 2 trong tuần, mức giảm sâu từ 142-156 USD/tấn, dao động từ 5228- 5409 USD/tấn. Cụ thể, kỳ hạn giao hàng tháng January 2025 là 5.409 USD/tấn (giảm 156 USD/tấn); kỳ hạn giao hàng tháng March 2025 là 5.377 USD/tấn (giảm 151 USD/tấn); kỳ hạn giao hàng tháng May 2025 là 5.310 USD/tấn (giảm 144 USD/tấn) và kỳ hạn giao hàng tháng July 2025 là 5.228 USD/tấn (giảm 142 USD/tấn).
Tương tự, giá sàn giao dịch cà phê Arabica New York ngày November 30, 2024 cũng giảm, kết thúc phiên giao dịch trước đó giá cà phê trên sàn New York giảm ở mức từ 4,40- 5 cent/lb. Cụ thể, kỳ hạn giao hàng tháng March 2025 là 318.05 cent/lb (giảm 5 cent/lb); kỳ giao hàng tháng May 2025 là 315.50 cent/lb (giảm 5,20 cent/lb); kỳ giao hàng tháng July 2025 là 310.85 cent/lb (giảm 4,85 cent/lb) và kỳ giao hàng tháng September 2025 là 305,80 cent/lb (giảm 4,40 cent/lb).
Kết thúc phiên giao dịch, sáng ngày December 1, 2024, giá cà phê Arabica Brazil tăng, giảm hỗn hợp qua các kỳ hạn giao hàng, dao động từ 386,85 – 389,05 USD/tấn. Cụ thể, kỳ hạn giao hàng tháng December 2024 là 389,05 USD/tấn (giảm 14,85 USD/tấn); kỳ giao hàng tháng March 2025 là 393,70USD/tấn (tăng 1,20 USD/tấn); kỳ giao hàng tháng May 2025 là 393,15 USD/tấn (giảm 6,90 USD/tấn) và giao hàng tháng July 2025 là 386,85 USD/tấn (giảm 6,40 USD/tấn).
| Dự báo giá cà phê ngày mai December 2, 2024 sẽ tăng nhẹ |
Giá cà phê trong nước được cập nhật lúc 4h30 phút ngày December 1, 2024 như sau, giá cà phê trong nước quay đầu giảm, mức giảm nhẹ 1000 đồng/kg. Hiện giá thu mua trung bình tại các tỉnh Tây Nguyên là 130.200 đồng/kg.
Specifically, the coffee purchase price in the province Gia Lai ở mức 130.000 đồng/kg (giảm 1.000 đồng/kg so với phiên giao dịch trước); Tương tự, tại tỉnh Dak Nong cà phê cũng giảm 1.000 đồng/kg với giá 130.500 đồng/kg.
Price of green coffee beans (coffee beans, fresh coffee beans) in the province Lam Dong In districts such as Bao Loc, Di Linh, Lam Ha, coffee is purchased at 129.500 VND/kg.
Giá cà phê hôm nay (ngày 1/12) tại tỉnh Dak LakIn Cu M’gar district, coffee is purchased at 130.000 VND/kg, and in Ea H’leo district, Buon Ho town, it is purchased at 129.900 VND/kg.
Theo dự báo, giá cà phê ngày mai December 2, 2024 sẽ tăng nhẹ trở lại. Nguyên nhân được cho rằng do thời tiết không thuận lợi, thất thường tại hai nước sản xuất cà phê lớn nhất thế giới là Brazil và Việt Nam, mưa lớn ở các nước Nam Mỹ… Tại thị trường Việt Nam, mặc dù đang mùa thu hoạch rộ, giá cà phê đang neo ở mức cao nhưng nhiều nông dân chỉ bán lượng ít đủ chi phí công chăm sóc, thu hoạch, tưới tiêu, bón phân… còn đa số giữ lại vì mong chờ giá còn tăng.
Các chuyên gia cho rằng, hiện nay nguồn cung cà phê trên thị trường thế giới đang thiếu hụt và lượng cà phê tồn kho trên các sàn giao dịch quốc tế không nhiều. Điển hình, thời gian qua, giá cà phê Arabica trên sàn New York tăng liên tục. Vì thị trường này lo ngại sự thiếu hụt nguồn cung từ Brazil, do tình trạng khô hạn kéo dài ở nhiều vùng trồng.
Theo tính toán của các nông dân trồng cà phê ở Tây Nguyên Việt Nam, trung bình sản xuất ra mỗi kg cà phê có giá khoảng 30.000 – 40.000 đồng. Tuy nhiên, hiện nay giá bán đã lên trên 130.000 đồng/kg. Như vậy, người nông dân có lãi từ 2 – 3 lần chi phí đầu tư. Do đó, hiện nay nhu cầu mua đất mở rộng diện tích cà phê giúp thị trường đất rẫy không ngừng tăng giá.
Sources: https://congthuong.vn/du-bao-gia-ca-phe-ngay-mai-2122024-gia-ca-phe-tang-nhe-361861.html
Gold price (XAU/USD) edges lower to around $2,645 during the early Asian session on Monday. A recovery in the US Dollar broadly weighs on the precious metal. However, persistent geopolitical tensions could cap the downside for XAU/USD.
The yellow metal declined 3% in November, its worst monthly loss since September 2023. A victory of Donald Trump in the US Presidential election in November fuelled expectations that the Federal Reserve (Fed) would adopt a cautious approach to further rate cuts, which boost the Greenback and drag the USD-denominated Gold lower.
Nonetheless, the escalating geopolitical tensions could boost the Gold price, a traditional safe-haven asset. Russian and Syrian jets have carried out air strikes on Syrian rebels who are advancing through the country after seizing its second-largest city, per Reuters. “Persistent global uncertainties continue to drive demand for gold as a safe-haven asset,” Ole Hansen, head of commodity strategy at Saxo Bank, said in a note.
Traders brace for the US ISM Manufacturing Purchasing Managers’ Index (PMI) on Monday for fresh impetus. The Manufacturing PMI is projected to rise to 47.5 in November from 46.5 in the previous reading. On Friday, the attention will shift to the US Nonfarm Payrolls (NFP) for November.
Gold has played a key role in human’s history as it has been widely used as a store of value and medium of exchange. Currently, apart from its shine and usage for jewelry, the precious metal is widely seen as a safe-haven asset, meaning that it is considered a good investment during turbulent times. Gold is also widely seen as a hedge against inflation and against depreciating currencies as it doesn’t rely on any specific issuer or government.
Central banks are the biggest Gold holders. In their aim to support their currencies in turbulent times, central banks tend to diversify their reserves and buy Gold to improve the perceived strength of the economy and the currency. High Gold reserves can be a source of trust for a country’s solvency. Central banks added 1,136 tonnes of Gold worth around $70 billion to their reserves in 2022, according to data from the World Gold Council. This is the highest yearly purchase since records began. Central banks from emerging economies such as China, India and Turkey are quickly increasing their Gold reserves.
Gold has an inverse correlation with the US Dollar and US Treasuries, which are both major reserve and safe-haven assets. When the Dollar depreciates, Gold tends to rise, enabling investors and central banks to diversify their assets in turbulent times. Gold is also inversely correlated with risk assets. A rally in the stock market tends to weaken Gold price, while sell-offs in riskier markets tend to favor the precious metal.
The price can move due to a wide range of factors. Geopolitical instability or fears of a deep recession can quickly make Gold price escalate due to its safe-haven status. As a yield-less asset, Gold tends to rise with lower interest rates, while higher cost of money usually weighs down on the yellow metal. Still, most moves depend on how the US Dollar (USD) behaves as the asset is priced in dollars (XAU/USD). A strong Dollar tends to keep the price of Gold controlled, whereas a weaker Dollar is likely to push Gold prices up.
Softer wage growth, a sub-100k increase in nonfarm payrolls, and a higher unemployment rate could raise bets on a December rate cut. On the other hand, strong data could temper expectations for a December Fed rate cut.
In summary, rising bets on a December Fed rate cut on weak labor market data could drag the USD/JPY pair below 147.5. Conversely, upbeat labor market data may drive the pair toward 155.
Other US data include finalized private sector PMI and consumer sentiment numbers. However, barring marked revisions, they will likely play second fiddle to the labor market reports.
Near-term USD/JPY trends will hinge on upcoming Japanese and US data. Monetary policy divergence favoring the Japanese Yen could drive the USD/JPY below 147.5, while falling bets on a Fed rate cut or BoJ rate hike may push the pair toward 155.
Investors should stay alert, monitoring real-time data, central bank views, and expert commentary to adjust trading strategies accordingly. Don’t miss crucial market movements. Follow our real-time FX updates and stay ahead in the markets here!
The USD/JPY sits below the 50-day and 200-day EMAs, sending bearish price signals.
A USD/JPY break above the 200-day EMA could signal a move toward the 50-day EMA and the 151.685 resistance level. A breakout from the 151.685 resistance level may enable the bulls to target the trend line.
Investors should consider the economic indicators and central bank commentary, potentially affecting USD/JPY price trends.
Conversely, a drop below the 148.529 support level could bring the 147.5 level into play. A fall through 147.5 may give the bears a run at the 145.891 support level.
The 14-day RSI at 38.45 suggests a USD/JPY drop below the 148.529 support level before entering oversold territory (RSI< 30).
December 1, 2024 – Written by James Fuller
STORY LINK Pound to Dollar December Forecast: Trump Trade but Upside Still Expected
After an initial retreat to below 1.25, Bank of America (BoA) expects the Pound to Dollar exchange rate (GBP/USD) to strengthen to 1.38 at the end of 2025 with a further surge to 1.49 at the end of 2026.
ING, however, expects dollar strength to dominate and has a 12-month GBP/USD forecast of 1.24.
After posting gains for 8 successive weeks, the dollar succumbed to profit taking during the week.
In this context, position adjustment ahead of the Thanksgiving Holiday was a key factor.
Seasonal factors could play a significant short-term role.
Danske notes the risk of near-term dollar losses; “December has historically been the most bearish month for the broad USD, with an average monthly decline of 0.8%.”
There were no major US data releases during the week, but policy expectations surrounding a Trump Administration remained a key talking point.

Trump threatened to impose tariffs of 25% on imports from Mexico and Canada on day one of the new Administration which rattled markets.
According to ING; “Investors and corporate treasurers think they know what Donald Trump will mean for the dollar, having seen this film before in 2018-2019. European FX in particular looks the most vulnerable.”
Nordea expects upward pressure on yields; “We think strong economic activity and inflation above 2% inflation combined with an increasing budget deficit could move the US 10-year government rate back up toward 5% from its current level at 4.40%.”
The bank added; “It is hard to know how much the currency will offset the next iteration of tariffs, but we think that it could lead to a substantial appreciation of the dollar. This makes us more comfortable with our bullish dollar forecast.”
It sees a risk of GBP/USD trading below 1.20 next year.
Rhetoric from Bank of England officials maintained expectations of a very cautious stance and only slow interest rate cuts.
BoA expects the dollar will fail to hold initial gains and is bullish on the Pound.
On Sterling, it commented; “Heading into the new year, we have made some adjustments to our GBP profile to highlight our conviction that further upside is likely over the medium-term.”
As far as the dollar is concerned it noted; “Our baseline assumes that the USD will remain strong in the first half of next year, on the back of US tariffs, resilient US economy, and Fed stopping rate cuts early.”
The bank, however, expects that the dollar will retreat later in the year. It added; “This assumes that the US economy eventually resumes its landing, with some of the negative implications of trade protectionism also taking hold.”
HSBC maintains a bullish medium-term dollar stance; “In our opinion, the case for USD strength through 2025 is robust. It is based on expectations of fiscal stimulus and heightened import tariffs that together may slow the pace of Fed easing and keep interest rates elevated.
It added; “If the rest of the world is still languishing, at least in relative terms, then the USD is likely to remain strong.”
HSBC is, however, cautious over near-term trends; “Despite our belief in a strong USD through next year, we are a little wary of just how quickly it has strengthened.”
International Money Transfer? Ask our resident FX expert a money transfer question or try John’s new, free, no-obligation personal service! ,where he helps every step of the way,
ensuring you get the best exchange rates on your currency requirements.
I wrote on 24th November that the best trade opportunities for the week were likely to be:
The weekly gain of 0.32% equals 0.08% per asset.
Last week’s key takeaways were:
Apart from the inflation data, there were no data points last week that were truly interesting to the market, and even inflation is no longer the concern it was some months ago. Markets are more interested right now in global growth and the likely appointments of the upcoming Trump administration, which will take power in January. We saw US and European stock markets gaining again last week as risk sentiment in parts of the world improved, with the broad US S&P 500 Index rising to make a fresh all-time high last Friday.
The coming week’s schedule is lighter than last week and will likely be dominated by US Non-Farm Payrolls data on Friday.
I made no monthly forecast for November, as the long-term trends in the Forex market were too unclear.
For the month of December, I forecast that the EUR/USD currency pair will fall in value.
This week, I forecast that the AUD/JPY and CAD/JPY currency pairs will rise in value, as they fell by such unusually large amounts last week.
Last week, the Japanese Yen was the strongest major currency, while the Australian Dollar was the weakest. Volatility rose last week, with two-thirds of the most important Forex currency pairs and crosses changed in value by over 1%.
You can trade these forecasts in a real or demo Forex brokerage account.

Last week, the US Dollar Index printed a bearish candlestick that reversed the recent breakout to back underneath the resistance level at 105.81, as well as the upper trend line of the formerly dominant consolidating triangle chart pattern, which can be seen in the price chart below. The price fell sharply from the new 2-year high which was printed the previous week and closed not far from its low of the week. These are bearish signs, but it should be noted that the price is above its levels from three and six months ago, suggesting a long-term bullish trend in the greenback that should be exploitable.
I have plenty of technical and fundamental reasons to be bullish on the US Dollar. However, the upside over the coming week might be limited, so long-term trades long of the USD might be more successful than short-term trades.

Bitcoin saw a week of modest gains after it hit a record high just shy of $100,000 the previous week, then made a retracement deep enough to shake out many long positions. The price now seems to have resumed its climb towards the record high and $100,00.
The strong long-term bullish trend is something worth paying attention to, and it has been given a tailwind by the Republican victory in the recent US elections. I thought that $100,000 might be hard for the price to overcome and this still looks likely to be a pivotal point over the coming days or even weeks.
I am prepared to go long again of Bitcoin, having taken in my long trade from the $75k area after the price retraced to about $91k, but I want to see a daily (New York) close above $100,000 before entering such a new trade.

Last week, the EUR/USD currency pair printed a relatively strong bullish candlestick, rebounding from the lowest weekly close seen in almost two years which was made the previous week. The price is still below its levels from both 3 and 6 months ago, which is my preferred metric for calling a long-term bearish trend. The US Dollar Index is also in a long-term bearish trend. A final bearish filter is that the 50-day moving average is below the 100-day moving average, which validates the trend.
There are plenty of reasons to be short here, but I am a bit concerned about the strength of the bullish inflection from the recent multi-year low. On the other hand, this currency pair tends to make deep retracements within even its strongest trends.
I am prepared to enter new short trade from any rejection of a resistance level below $1.0620.

Last week, the USD/JPY currency pair printed a very strong bearish candlestick, which was unusually large and closed right on its low.
These are bearish signs, or at least signs of bearish momentum. The Japanese Yen was the strongest of all the major currencies last week. However, this seeming bearish reversal occurred at a multi-month high price, when this pair seemed to be preparing to establish a new long-term bullish trend.
There is a lot of volatility in the Japanese Yen and there has been for many months, making Yen pairs and crosses very interesting for day traders.
I cannot predict long-term direction here, but I can predict that anyone who is good at short-term trading and who needs volatility to profit would do well to be interested in this currency pair and maybe some of the Yen crosses too.

I expected that the USD/CHF currency pair would have potential support at $0.8805.
The H1 price chart below shows how the price action rejected this support level with an hourly inside bar, which followed a doji candlestick, marked by the up arrow within the price chart below. This rejection occurred right at the end of the London session last Wednesday, which can often be a great time for reversals in the US Dollar.
This trade gave a maximum profit of approximately 1.5 to 1.
This currency pair has been quite strongly positively correlated with the EUR/USD currency pair lately.

Last week saw the S&P 500 Index rise again to reach a new record high, and it closed the week quite near the high, which is a bullish sign. There is no sign more bullish than the fact that the price is trading bullishly in blue sky.
US stock markets are leading global equities, which is nothing unusual, boosted by President Trump’s reputation as doing anything to generate economic growth and stock market growth, as well as his announcement of his intention to put strong tariffs on imports from Mexico and China.
Maybe more importantly, the US stock market has been in a strong bullish trend for over one year now, so there is plenty of momentum supporting last week’s bullish move.
I see the S&P 500 Index as a buy.

Last week saw the USD/BRL currency pair rise strongly to make a new all-time high price, before it gave back some of its gains to close just below the previous record high made in 2020.
In other words, the Brazilian Real is in trouble and is reaching record lows.
The only note of caution for bulls here would be the fact that the price was unable to close above the 2020 high.
Many brokers do not offer the BRL to trade, and the very high overnight swap rates that come with being long of the BRL as a CFD can be a deterrent to trading this key emerging currency. However, anyone with BRL holdings might want to think about getting out or at least hedging the currency risk.
Brazil has taken quite an anti-American position in recent months, throwing its lot in fully with the BRICS countries and implying an alternative to the USD. One has to wonder what President Lula has said to President-Elect Trump in recent days, as its hard to imagine President Trump allowing such actions to go by unpunished. That may be contributing to the weakness of the Real.

Last week saw the USD/INR currency pair rise to make a new all-time high price, and it closed near the high of the week, painting a very bullish technical picture as it trades in blue sky. This has happened for each of the last few weeks.
The Indian Rupee is relatively weak and is reaching record lows.
Many brokers do not offer the INR to trade, and the very high overnight swap rates that come with being long of the INR as a CFD can be a deterrent to trading this key emerging currency. However, anyone with INR holdings might want to think about getting out or at least hedging the currency risk.
The relative weakness of the Indian Rupee is interesting because India’s economic metrics remain quite positive. This is likely partly due to relatively high inflation and interest rates, as well as the fear that India is so dependent upon manufacturing raw materials that it could be prone to very high levels of inflation if commodity prices spiral out of control again.

I see the best trading opportunities this week as
Ready to trade our weekly Forex forecast? Check out our list of the best Forex brokers worth reviewing.