The main category of Forex News.
You can use the search box below to find what you need.
[wd_asp id=1]
The main category of Forex News.
You can use the search box below to find what you need.
[wd_asp id=1]
December 1, 2024 – Written by James Fuller
STORY LINK Pound to Dollar December Forecast: Trump Trade but Upside Still Expected
After an initial retreat to below 1.25, Bank of America (BoA) expects the Pound to Dollar exchange rate (GBP/USD) to strengthen to 1.38 at the end of 2025 with a further surge to 1.49 at the end of 2026.
ING, however, expects dollar strength to dominate and has a 12-month GBP/USD forecast of 1.24.
After posting gains for 8 successive weeks, the dollar succumbed to profit taking during the week.
In this context, position adjustment ahead of the Thanksgiving Holiday was a key factor.
Seasonal factors could play a significant short-term role.
Danske notes the risk of near-term dollar losses; “December has historically been the most bearish month for the broad USD, with an average monthly decline of 0.8%.”
There were no major US data releases during the week, but policy expectations surrounding a Trump Administration remained a key talking point.

Trump threatened to impose tariffs of 25% on imports from Mexico and Canada on day one of the new Administration which rattled markets.
According to ING; “Investors and corporate treasurers think they know what Donald Trump will mean for the dollar, having seen this film before in 2018-2019. European FX in particular looks the most vulnerable.”
Nordea expects upward pressure on yields; “We think strong economic activity and inflation above 2% inflation combined with an increasing budget deficit could move the US 10-year government rate back up toward 5% from its current level at 4.40%.”
The bank added; “It is hard to know how much the currency will offset the next iteration of tariffs, but we think that it could lead to a substantial appreciation of the dollar. This makes us more comfortable with our bullish dollar forecast.”
It sees a risk of GBP/USD trading below 1.20 next year.
Rhetoric from Bank of England officials maintained expectations of a very cautious stance and only slow interest rate cuts.
BoA expects the dollar will fail to hold initial gains and is bullish on the Pound.
On Sterling, it commented; “Heading into the new year, we have made some adjustments to our GBP profile to highlight our conviction that further upside is likely over the medium-term.”
As far as the dollar is concerned it noted; “Our baseline assumes that the USD will remain strong in the first half of next year, on the back of US tariffs, resilient US economy, and Fed stopping rate cuts early.”
The bank, however, expects that the dollar will retreat later in the year. It added; “This assumes that the US economy eventually resumes its landing, with some of the negative implications of trade protectionism also taking hold.”
HSBC maintains a bullish medium-term dollar stance; “In our opinion, the case for USD strength through 2025 is robust. It is based on expectations of fiscal stimulus and heightened import tariffs that together may slow the pace of Fed easing and keep interest rates elevated.
It added; “If the rest of the world is still languishing, at least in relative terms, then the USD is likely to remain strong.”
HSBC is, however, cautious over near-term trends; “Despite our belief in a strong USD through next year, we are a little wary of just how quickly it has strengthened.”
International Money Transfer? Ask our resident FX expert a money transfer question or try John’s new, free, no-obligation personal service! ,where he helps every step of the way,
ensuring you get the best exchange rates on your currency requirements.
I wrote on 24th November that the best trade opportunities for the week were likely to be:
The weekly gain of 0.32% equals 0.08% per asset.
Last week’s key takeaways were:
Apart from the inflation data, there were no data points last week that were truly interesting to the market, and even inflation is no longer the concern it was some months ago. Markets are more interested right now in global growth and the likely appointments of the upcoming Trump administration, which will take power in January. We saw US and European stock markets gaining again last week as risk sentiment in parts of the world improved, with the broad US S&P 500 Index rising to make a fresh all-time high last Friday.
The coming week’s schedule is lighter than last week and will likely be dominated by US Non-Farm Payrolls data on Friday.
I made no monthly forecast for November, as the long-term trends in the Forex market were too unclear.
For the month of December, I forecast that the EUR/USD currency pair will fall in value.
This week, I forecast that the AUD/JPY and CAD/JPY currency pairs will rise in value, as they fell by such unusually large amounts last week.
Last week, the Japanese Yen was the strongest major currency, while the Australian Dollar was the weakest. Volatility rose last week, with two-thirds of the most important Forex currency pairs and crosses changed in value by over 1%.
You can trade these forecasts in a real or demo Forex brokerage account.

Last week, the US Dollar Index printed a bearish candlestick that reversed the recent breakout to back underneath the resistance level at 105.81, as well as the upper trend line of the formerly dominant consolidating triangle chart pattern, which can be seen in the price chart below. The price fell sharply from the new 2-year high which was printed the previous week and closed not far from its low of the week. These are bearish signs, but it should be noted that the price is above its levels from three and six months ago, suggesting a long-term bullish trend in the greenback that should be exploitable.
I have plenty of technical and fundamental reasons to be bullish on the US Dollar. However, the upside over the coming week might be limited, so long-term trades long of the USD might be more successful than short-term trades.

Bitcoin saw a week of modest gains after it hit a record high just shy of $100,000 the previous week, then made a retracement deep enough to shake out many long positions. The price now seems to have resumed its climb towards the record high and $100,00.
The strong long-term bullish trend is something worth paying attention to, and it has been given a tailwind by the Republican victory in the recent US elections. I thought that $100,000 might be hard for the price to overcome and this still looks likely to be a pivotal point over the coming days or even weeks.
I am prepared to go long again of Bitcoin, having taken in my long trade from the $75k area after the price retraced to about $91k, but I want to see a daily (New York) close above $100,000 before entering such a new trade.

Last week, the EUR/USD currency pair printed a relatively strong bullish candlestick, rebounding from the lowest weekly close seen in almost two years which was made the previous week. The price is still below its levels from both 3 and 6 months ago, which is my preferred metric for calling a long-term bearish trend. The US Dollar Index is also in a long-term bearish trend. A final bearish filter is that the 50-day moving average is below the 100-day moving average, which validates the trend.
There are plenty of reasons to be short here, but I am a bit concerned about the strength of the bullish inflection from the recent multi-year low. On the other hand, this currency pair tends to make deep retracements within even its strongest trends.
I am prepared to enter new short trade from any rejection of a resistance level below $1.0620.

Last week, the USD/JPY currency pair printed a very strong bearish candlestick, which was unusually large and closed right on its low.
These are bearish signs, or at least signs of bearish momentum. The Japanese Yen was the strongest of all the major currencies last week. However, this seeming bearish reversal occurred at a multi-month high price, when this pair seemed to be preparing to establish a new long-term bullish trend.
There is a lot of volatility in the Japanese Yen and there has been for many months, making Yen pairs and crosses very interesting for day traders.
I cannot predict long-term direction here, but I can predict that anyone who is good at short-term trading and who needs volatility to profit would do well to be interested in this currency pair and maybe some of the Yen crosses too.

I expected that the USD/CHF currency pair would have potential support at $0.8805.
The H1 price chart below shows how the price action rejected this support level with an hourly inside bar, which followed a doji candlestick, marked by the up arrow within the price chart below. This rejection occurred right at the end of the London session last Wednesday, which can often be a great time for reversals in the US Dollar.
This trade gave a maximum profit of approximately 1.5 to 1.
This currency pair has been quite strongly positively correlated with the EUR/USD currency pair lately.


Last week saw the S&P 500 Index rise again to reach a new record high, and it closed the week quite near the high, which is a bullish sign. There is no sign more bullish than the fact that the price is trading bullishly in blue sky.
US stock markets are leading global equities, which is nothing unusual, boosted by President Trump’s reputation as doing anything to generate economic growth and stock market growth, as well as his announcement of his intention to put strong tariffs on imports from Mexico and China.
Maybe more importantly, the US stock market has been in a strong bullish trend for over one year now, so there is plenty of momentum supporting last week’s bullish move.
I see the S&P 500 Index as a buy.

Last week saw the USD/BRL currency pair rise strongly to make a new all-time high price, before it gave back some of its gains to close just below the previous record high made in 2020.
In other words, the Brazilian Real is in trouble and is reaching record lows.
The only note of caution for bulls here would be the fact that the price was unable to close above the 2020 high.
Many brokers do not offer the BRL to trade, and the very high overnight swap rates that come with being long of the BRL as a CFD can be a deterrent to trading this key emerging currency. However, anyone with BRL holdings might want to think about getting out or at least hedging the currency risk.
Brazil has taken quite an anti-American position in recent months, throwing its lot in fully with the BRICS countries and implying an alternative to the USD. One has to wonder what President Lula has said to President-Elect Trump in recent days, as its hard to imagine President Trump allowing such actions to go by unpunished. That may be contributing to the weakness of the Real.

Last week saw the USD/INR currency pair rise to make a new all-time high price, and it closed near the high of the week, painting a very bullish technical picture as it trades in blue sky. This has happened for each of the last few weeks.
The Indian Rupee is relatively weak and is reaching record lows.
Many brokers do not offer the INR to trade, and the very high overnight swap rates that come with being long of the INR as a CFD can be a deterrent to trading this key emerging currency. However, anyone with INR holdings might want to think about getting out or at least hedging the currency risk.
The relative weakness of the Indian Rupee is interesting because India’s economic metrics remain quite positive. This is likely partly due to relatively high inflation and interest rates, as well as the fear that India is so dependent upon manufacturing raw materials that it could be prone to very high levels of inflation if commodity prices spiral out of control again.

I see the best trading opportunities this week as
Ready to trade our weekly Forex forecast? Check out our list of the best Forex brokers worth reviewing.
Experts predict that coffee prices on November 8, 2024 may continue to fall due to the US dollar reaching a four-month high, pushing coffee prices down, and fluctuations in the international market.
The US dollar surged to a four-month high after the White House officially opened for Donald Trump to return. With the US presidential election almost over, the market expects Mr. Trump’s policies on immigration, tariffs and trade to boost US growth.
Commenting on the market this week, industry insiders said that Robusta coffee prices calculated according to the monthly price January 2025 are forecast to continue to decrease with the target level possibly being 3.946 USD/ton. At this support level, the Robusta market can find buying and it is not excluded that the price will bounce back from here. However, if this level fails, Robusta prices can go down to 3.800 USD/ton.
For the December 2014 arabica coffee price, there is a lot of room for further declines and a possible technical low of 235,30 cents/lb. This is a level that should find some buying demand on a technical basis.
However, in the long term, the impact of the heat wave and prolonged lack of irrigation water occurring in the first months of 2024, coinciding with the time when coffee trees flower and bear fruit, has caused some coffee gardens to have wilted leaves, dry flowers, and young fruits, reducing productivity and output.
Recorded in the trading session on November 7, 2024, today’s coffee price increased by 600 VND/kg, ranging from 106.500-107.000 VND/kg. Currently, the average purchase price in the Central Highlands provinces is 106.800 VND/kg, the highest purchase price in Dak Nong, Dak Lak, Gia Lai, Kon Tum provinces is 107.000 VND/kg.
 |
| Coffee price forecast for November 8, 2024: Domestic price continues to decrease, will the world price increase again? |
Specifically, the coffee purchase price in Gia Lai province (Chu Prong) is 107.000 VND, an increase of 600 VND/kg compared to yesterday, in Pleiku and La Grai the same price is 106.900 VND/kg; In Kon Tum province, the price is 107.000 VND/kg, an increase of 600 VND/kg compared to yesterday; In Dak Nong province, coffee is purchased at the highest price of 107.000 VND/kg, an increase of 600 VND/kg compared to yesterday.
The price of green coffee beans (coffee beans, fresh coffee beans) in Lam Dong province in districts such as Bao Loc, Di Linh, Lam Ha, coffee is purchased at 106.500 VND/kg, an increase of 600 VND/kg compared to yesterday.
Domestic coffee price (date 7/11) in Dak Lak province; in Cu M’gar district, coffee is purchased at about 107.000 VND/kg, an increase of 600 VND/kg compared to yesterday, and in Ea H’leo district, Buon Ho town, it is purchased at the same price of 106.900 VND/kg.
Updated world coffee prices at 20:00 on November 7, 2024 Vietnam time on the London exchange, the price of Robusta coffee futures contract for monthly delivery January 2025 on the London exchange was at 4.425 USD/ton, up 118 USD compared to the beginning of the trading session.
 |
| Coffee price today November 7, 2024: Robusta coffee price on London floor. (Photo: Screenshot giacaphe.com |
The monthly delivery term March 2025 is 4.363 USD/ton, up 115 USD; the monthly delivery term May 2025 is 4.302 USD/ton, up 113 USD and the monthly delivery term July 2025 is 4.222 USD/ton, up 107 USD.
 |
| Arabica coffee price on New York floor on November 7, 2024. (Photo: Screenshot of giacaphe.com) |
Of which, the price of Arabica coffee on the New York floor at 20:00 on November 7, 2024 increased in all terms, fluctuating at 252.60 – 257.30 cents/lb.
Specifically, the monthly delivery term December 2024 is 257.30 cents/lb; up 8.55 cents/lb compared to the beginning of the session. The monthly delivery term March 2025 is 256.4560 cents/lb, up 8.40 cents/lb; the monthly delivery term May 2025 is 254.90 cents/lb, up 8.20 cents/lb and the monthly delivery term July 2025 is 252.60 cents/lb, up 8.05 cents/lb.
 |
| Brazilian Arabica coffee price on November 7, 2024.(Photo: Screenshot of giacaphe.com) |
Brazilian Arabica coffee prices today at 21:00 p.m. November 7, 2024 increased and decreased in opposite directions. Specifically, the monthly delivery term December 2024 was 313.00 USD/ton, up 3.01%; the monthly delivery term March 2025 was 312.30 USD/ton, up 3.04%; the monthly delivery term May 2025 was 302.15 USD/ton, down 0.62% and the monthly delivery term July 2025 was 299.20 USD/ton, down 0.63%.
Robusta coffee traded on ICE Futures Europe (London floor) opens at 16:00 and closes at 00:30 (the next day), Vietnam time.
Arabica coffee on the ICE Futures US floor (New York floor) opens at 16:15 p.m. and closes at 01:30 a.m. (the next day), Vietnam time.
Commenting on the current market, the Vietnam Coffee and Cocoa Association (Vicofa) said that product prices turning down is a common occurrence during the harvest season. In addition, the European Union has postponed anti-deforestation regulations for another 12 months, reducing supply pressure.
However, coffee prices will only fall in the short term. Vietnam’s coffee output this year is forecast to fall by about 10% due to heat and drought in some Central Highlands regions reducing productivity, while inventories from the previous crop have been depleted.
Information for reference only. Prices may vary depending on locality.
The GBP/USD weekly forecast suggests a rebound in the pound as the fading Trum trade puts downward pressure on the greenback.
The pound had its strongest week since September as the dollar eased from its peak with the fading Trump trade. Data during the week showed that the US economy expanded by 2.8% as expected. Meanwhile, the core PCE price index increased by 0.3%, in line with expectations. Consequently, market participants were more confident that the Fed would cut rates in December.
-Are you looking for the best AI Trading Brokers? Check our detailed guide-
Meanwhile, optimism over Trump’s win and policy changes faded, leading to a decline in the dollar and Treasury yields. Markets will now wait to see if Trump will pass his policy proposals in the coming year
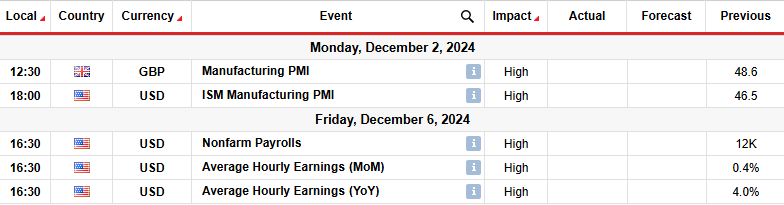
Next week, the UK will release figures on business activity in the manufacturing sector. Flash figures recently showed a slowdown in the economy, pushing market participants to increase the likelihood of a more aggressive Bank of England rate cut cycle.
Meanwhile, US reports will include the manufacturing PMI and nonfarm payrolls report. Recent flash PMI numbers robust business activity in November. Therefore, there is a chance this trend will continue, lowering the likelihood of a Fed rate cut in December.
Meanwhile, the nonfarm payrolls report will show the state of the labor market. If job growth remains slow like last month, it will increase expectations for a rate cut in December. On the other hand, if job growth jumps, the Fed might end the year with a pause.
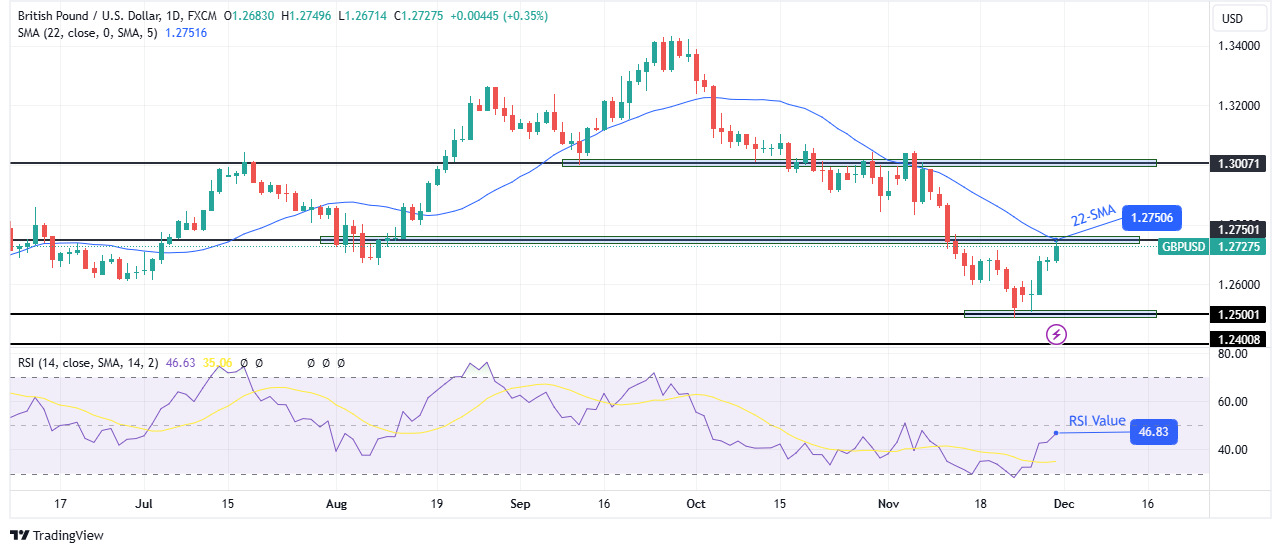
On the technical side, the GBP/USD price has rebounded to retest the 22-SMA resistance after finding support at the 1.2500 level. The rebound has also allowed the price to retest the 1.2750 resistance level. Therefore, there is a strong barrier for bulls which might see the price bouncing lower.
-Are you looking for the best MT5 Brokers? Check our detailed guide-
If bears return at the 22-SMA, they will aim to make a new low below the 1.2500, continuing the downtrend. On the other hand, there is a slight chance that bulls will break above the SMA next week. Such an outcome would signal a reversal and allow the price to revisit the 1.3007 resistance level.
Looking to trade forex now? Invest at eToro!
75% of retail investor accounts lose money when trading CFDs with this provider. You should consider whether you can afford to take the high risk of losing your money.
The USD/JPY weekly forecast supports further downside for the pair as the yen finds relief due to the increasing bets for a BoJ rate hike.
The USD/JPY pair had a bearish week as the yen rallied on a higher likelihood of a Bank of Japan rate hike in December. At the same time, the dollar eased as market focus shifted to the likelihood of a Fed rate cut in December.
-Are you looking for the best AI Trading Brokers? Check our detailed guide-
Data during the week revealed that core inflation in Tokyo increased more than expected. As a result, traders were pricing a higher chance that BoJ policymakers will hike rates by 25-bps in December. At the same time, US inflation figures came in line with expectations, solidifying bets for a December rate cut.
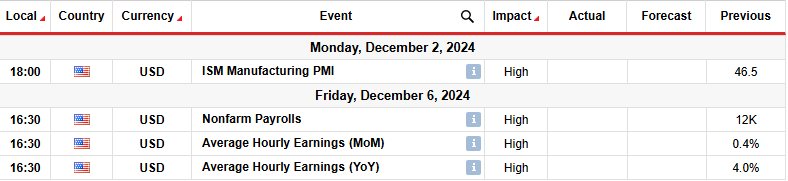
Next week, traders will focus on economic reports from the US, including the manufacturing PMI and monthly employment figures. The PMI report will show the level of business activity in the manufacturing sector.
Meanwhile, the employment report will show the state of the labor market. In the previous month, job growth slowed significantly to 12,000 raising fears of deterioration. Another downbeat month will solidify bets for a December rate cut.
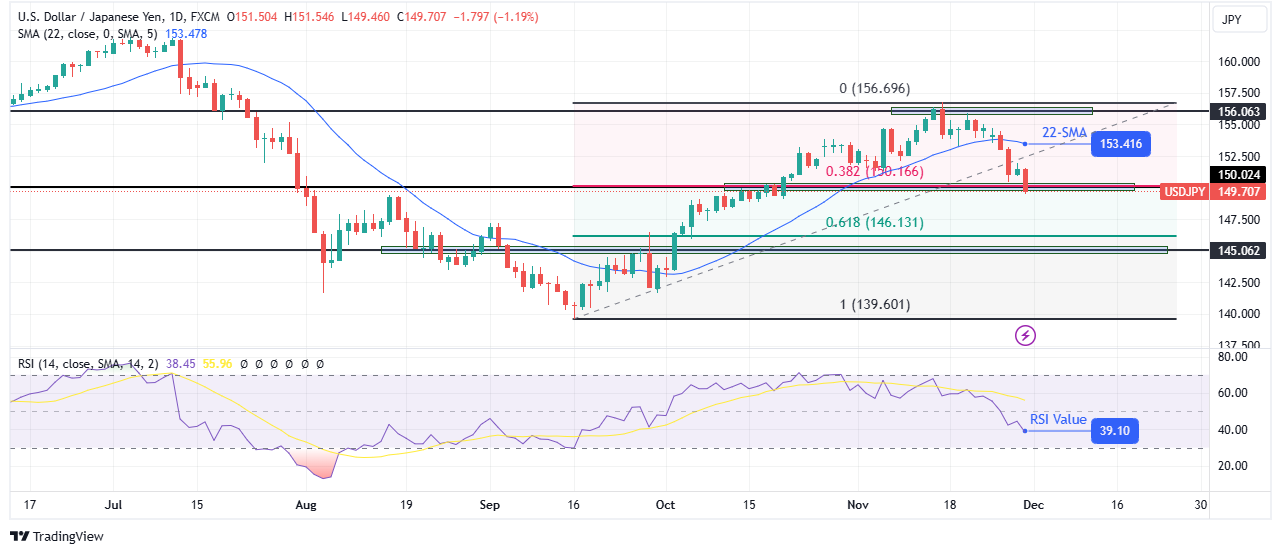
On the technical side, the USD/JPY price has reversed to the downside after finding solid resistance at the 156.06 level. Bears resurfaced at this resistance with a bearish engulfing candle that led to a break below the 22-SMA. At the same time, the RSI broke below the 50 level and entered into bearish territory.
-Are you looking for the best MT5 Brokers? Check our detailed guide-
However, the price must now start making lower highs and lows to confirm a new downtrend. At the moment, bears are facing strong support from the 150.02 level and the 0.382 Fib retracement level. A break below this support zone will allow USD/JPY to set its sights on lower support levels including 145.06 and the 0.618 Fib.
Meanwhile, if the price breaks back above the SMA, it might revisit the 156.06 resistance. A break above would confirm a continuation of the previous bullish trend.
Looking to trade forex now? Invest at eToro!
75% of retail investor accounts lose money when trading CFDs with this provider. You should consider whether you can afford to take the high risk of losing your money.
It is possible that a falling ABCD pattern is forming, although it is not perfect given the initial AB decline covers only one day. Looking at the pattern on a 4-hour chart (not shown) presents a clearer view of the pattern as the high candle is subsequently reversed. In the daily chart, there has not yet been a drop below last Friday’s low. The initial target from the pattern is 3.04. This essentially extends the next lower target zone around that is around the breakout level for a symmetrical triangle pattern at 3.02 and the 61.8% Fibonacci retracement level, also at 3.02.
Natural gas is in the process of its first pullback following a decisive upside breakout of a large symmetrical triangle pattern last week on a rally above 3.02. Buying after the first pullback following a decisive breakout through a key pivot level is one of the better risk management entry strategies and active investors and traders deploy.
The downside is typically relatively narrow, while the upside has the benefit of a bullish pattern on the higher time frames. Market participants are drawn by the growing recognition that a long-term breakout recently occurred. Eventual follow-through to the breakout is anticipated. November ended at the highest monthly closing price for natural gas since October 2023. That is bullish behavior.
The idea for buying off the first pullback is that since a breakout recently occurred, in an uptrend a bullish reversal has the potential to be the beginning of a new trend (prior trend reversal) or new swing within a larger trend. The price dynamic should provide better upside potential relative to downside risk since a trader can more quickly identify when things aren’t going according to plan and exit relatively early before a larger decline.
For a look at all of today’s economic events, check out our economic calendar.
Silver price advanced on Friday and finished the session with gains of over 1.33%, yet printed losses of 2.30% in the week. A weak US Dollar sponsored a leg up in the grey metal, which has cleared the 100-day Simple Moving Average (SMA) of $30.35. At the time of writing, the XAG/USD trades at $30.60.
XAG/USD Price Forecast: Technical outlook
The grey metal is neutral to downward biased, consolidated, and fluctuated around the 100-day SMA. Neither buyers nor sellers have been able to move Silver’s price outside of the $29.64-$31.52 range.
Oscillators such as the Relative Strength Index (RSI) remain bearish, though there have been signs that buyers are gathering steam.
Hence, for a bullish continuation, buyers must clear the $31.00. Once cleared, the next stop would be the top of the range at $31.52 before buyers could target the 50-day SMA at $31.74, ahead of the $32.00 figure.
On the other hand, if XAG/USD drops below the 100-day SMA of $30.35, the next support would be the $30.00 mark. On further weakness, sellers could aim to the 200-day SMA at $29.10.
XAG/USD Price Chart – Daily
Silver is a precious metal highly traded among investors. It has been historically used as a store of value and a medium of exchange. Although less popular than Gold, traders may turn to Silver to diversify their investment portfolio, for its intrinsic value or as a potential hedge during high-inflation periods. Investors can buy physical Silver, in coins or in bars, or trade it through vehicles such as Exchange Traded Funds, which track its price on international markets.
Silver prices can move due to a wide range of factors. Geopolitical instability or fears of a deep recession can make Silver price escalate due to its safe-haven status, although to a lesser extent than Gold’s. As a yieldless asset, Silver tends to rise with lower interest rates. Its moves also depend on how the US Dollar (USD) behaves as the asset is priced in dollars (XAG/USD). A strong Dollar tends to keep the price of Silver at bay, whereas a weaker Dollar is likely to propel prices up. Other factors such as investment demand, mining supply – Silver is much more abundant than Gold – and recycling rates can also affect prices.
Silver is widely used in industry, particularly in sectors such as electronics or solar energy, as it has one of the highest electric conductivity of all metals – more than Copper and Gold. A surge in demand can increase prices, while a decline tends to lower them. Dynamics in the US, Chinese and Indian economies can also contribute to price swings: for the US and particularly China, their big industrial sectors use Silver in various processes; in India, consumers’ demand for the precious metal for jewellery also plays a key role in setting prices.
Silver prices tend to follow Gold’s moves. When Gold prices rise, Silver typically follows suit, as their status as safe-haven assets is similar. The Gold/Silver ratio, which shows the number of ounces of Silver needed to equal the value of one ounce of Gold, may help to determine the relative valuation between both metals. Some investors may consider a high ratio as an indicator that Silver is undervalued, or Gold is overvalued. On the contrary, a low ratio might suggest that Gold is undervalued relative to Silver.
Coffee price today November 29, 2024 on the market world, at 4:30 am updated on the Vietnam Commodity Exchange MXV (world coffee prices are continuously updated by MXV, matching with world exchanges, the only channel in Vietnam that continuously updates and links with world exchanges). Today’s online coffee prices of the three main coffee futures exchanges ICE Futures Europe, ICE Futures US and B3 Brazil are continuously updated by Y5Cafe during the trading hours of the exchange, updated as follows:
At the end of the trading session, the price of Robusta coffee on the London floor at 4:30 a.m. on November 29, 2024 continued to increase slightly compared to the previous trading session, an increase of 10 – 32 USD/ton, ranging from 2.277 – 5.613 USD/ton. Specifically, the monthly delivery term January 2025 was 5.565 USD/ton (up 32 USD/ton); the monthly delivery term March 2025 was 5.528 USD/ton (up 32 USD/ton); the monthly delivery term May 2025 was 5.454 USD/ton (up 20 USD/ton) and the monthly delivery term July 2025 was 5.370 USD/ton (up 10 USD/ton).
On 29/11, the New York Arabica Coffee Exchange was closed for Thanksgiving. At the end of the previous trading session, coffee prices on the New York Stock Exchange were quite high. Specifically, the monthly delivery term March 2025 was 323.05 cent/lb; the monthly delivery term May 2025 was 320.70 cent/lb; the monthly delivery term July 2025 was 315.70 cent/lb and the monthly delivery term September 2025 was 310.20 cent/lb.
At the end of the trading session, on the morning of November 29, 2024, the price of Brazilian Arabica coffee increased and decreased mixedly across delivery terms, ranging from 393.25 – 403.90 USD/ton. Specifically, the monthly delivery term December 2024 was 399.20 USD/ton (down 4.70 USD/ton); the monthly delivery term March 2025 was 401.80 USD/ton (up 3.10 USD/ton); the monthly delivery term May 2025 was 400.05 USD/ton (up 19.05 USD/ton) and the monthly delivery term July 2025 was 393.25 USD/ton.
Robusta coffee traded on the ICE Futures Europe (London exchange) opens at 16:00 and closes at 00:30 (next day), Vietnam time. Arabica coffee on the ICE Futures US (New York exchange) opens at 16:15 and closes at 01:30 (next day), Vietnam time. For Arabica coffee traded on the B3 Brazil exchange, it will open from 19:00 – 02:35 (next day) Vietnam time.
According to forecasts, tomorrow’s coffee prices November 30, 2024 Robusta coffee prices on the London floor and Arabica coffee prices in New York will continue to increase. Meanwhile, according to forecasts, the price of Arabica coffee in Brazil will show signs of slowing down. As for domestic coffee prices, it is likely to exceed 130.000 VND/kg, approaching the record threshold of 134.400 VND/kg.
Domestic coffee prices were updated at 4:30 a.m. on November 29, 2024 as follows: Domestic coffee prices continued to increase sharply, increasing from 4.000 – 4.100 VND/kg. Currently, the average purchase price in the Central Highlands provinces is 128.000 VND/kg.
| Coffee prices tomorrow November 30, 2024 are forecast to continue to increase |
Specifically, the coffee purchase price in the province Gia Lai at 127.900 VND/kg (up 4.000 VND/kg compared to the previous trading session); Meanwhile, in the province Dak Nong Coffee was also purchased at the highest price of 128.200 VND/kg (an increase of 4.100 VND/kg).
Price of green coffee beans (coffee beans, fresh coffee beans) in the province Lam Dong In districts such as Bao Loc, Di Linh, Lam Ha, coffee is purchased at 127.500 VND/kg.
Coffee price today (date 29/11) in the province Dak LakIn Cu M’gar district, coffee is purchased at 128.000 VND/kg, and in Ea H’leo district, Buon Ho town, it is purchased at 127.900 VND/kg.
Domestic coffee prices are forecast to exceed VND 130.000/kg in the next session on November 30, 2024.
According to the Department of Industry and Trade of Dak Lak province, in the 2023-2024 coffee crop, the whole province exported 264.404 tons of coffee (down 54.095 tons compared to the previous crop), accounting for 17,9% of the whole country.
Export turnover reached 915,795 million USD (an increase of 168,238 million USD compared to the previous crop year), accounting for 16,9% of the whole country.
Compared to the 2022-2023 crop year, the province’s coffee exports decreased in volume but increased in value due to the continuous increase in coffee prices in the last crop year. Of which, coffee bean exports reached 783,895 million USD, an increase of 24,5%.
Instant coffee exports reached 131,9 million USD, accounting for 14,4% of the province’s total coffee export turnover. Compared to the 2022-2023 coffee crop, instant coffee export turnover increased by 14,173 million USD.
Sources: https://congthuong.vn/du-bao-gia-ca-phe-ngay-mai-30112024-gia-ca-phe-vuot-moc-130000-dongkg-361586.html
Brent Crude oil prices are expected to average $74.53 a barrel next year, the monthly Reuters poll of dozens of analysts showed on Friday, as the experts downgraded their price outlook for the seventh consecutive month.
Brent Crude prices are set to average $74.53 per barrel next year as weaker global demand growth and enough supply would offset the impact of a potential delay to the OPEC+ cuts, said 41 analysts and economists in the survey.
Last month, the analysts had expected Brent Crude prices to average $76.61 per barrel in 2025.
The analyst consensus estimate in the Reuters poll has now been downgraded for the seventh month in a row.
So far this year, Brent Crude has averaged $80 a barrel.
The analysts expect the U.S. benchmark, WTI Crude, average $70.69 per barrel next year, the Reuters survey showed. The latest forecast is $2 a barrel lower than the October consensus of $72.73 per barrel.
Many analysts expect OPEC+ to extend the current cuts for at least a month, and even for the entire first quarter of 2025, as oil prices continue to be weak, with Brent in the lower $70s and WTI trading below the $70 mark.
Stricter U.S. sanctions against Iran under Donald Trump and geopolitical tensions could provide some support to prices early next year, but overall, expected tepid demand will weigh down on oil prices, according to analysts.
Early on Friday, oil prices were set for a weekly loss despite a flare-up in the Middle East and the virtual certainty that OPEC+ would not be bringing any barrels back anytime soon. Both benchmarks have dropped since the start of the week when the U.S. brokered a ceasefire between Israel and Lebanon’s Hezbollah was announced.
On Thursday, OPEC said that the OPEC+ group would move the meeting on its near-term oil production plans to December 5 from December 1, due to a scheduling conflict.
By Tsvetana Paraskova for Oilprice.com
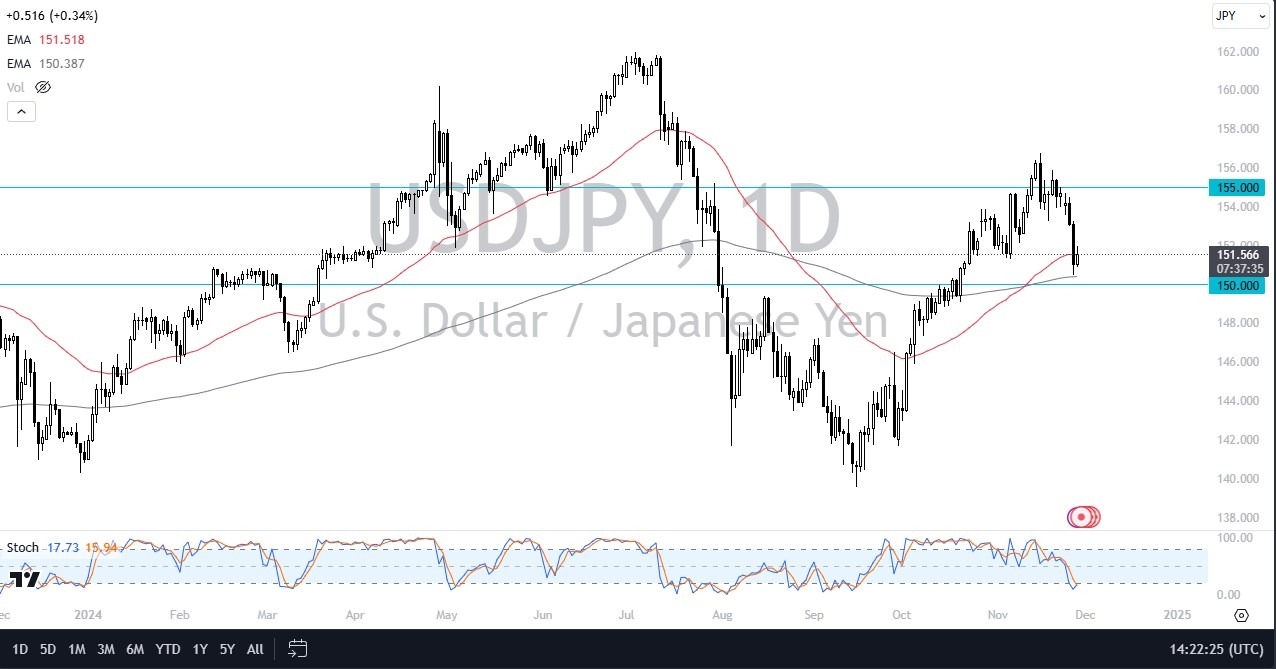
All things being equal, this is a very strong uptrend, and I think that probably continues to be the case over the longer term, because of a whole slew of fundamental reasons. With this, I think you got a situation where traders are taken advantage of the interest rate differential, in the so-called “carry trade.” The “carry trade” has lost its luster over the last couple of weeks, so what we need to see is a little bit of financial stability. There are a lot of questions as to whether or not the Bank of Japan will do something to stabilize the yen, but really at this point in time anything that the Bank of Japan does will more likely than not be somewhat lackluster.
Going forward, I think you’ve got a situation where a lot of traders will continue to look for an opportunity to take advantage of the interest rate differential, and of course try to find some type of support near the ¥150 level. The ¥150 level is a major spot on the chart, and therefore I think you’ve got a scenario where a lot of traders are going to be paying close attention to this region. You probably have a lot of options traders there as well, so that comes into the picture also.
The size of the candlestick during the trading session on Wednesday was rather brutal, but the question now is whether or not that was a bit of a “washout” for the sellers. After all, there may have been a couple of different things going on at the same time. Not only would you have people trying to take advantage of a weakening US dollar, but you might have had a lot of US-based traders just simply collecting profit before the holiday.
Want to trade our daily USD/JPY forex analysis and predictions? Here’s a list of forex brokers in Japan to check out.