The main category of Forex News.
You can use the search box below to find what you need.
[wd_asp id=1]
The main category of Forex News.
You can use the search box below to find what you need.
[wd_asp id=1]

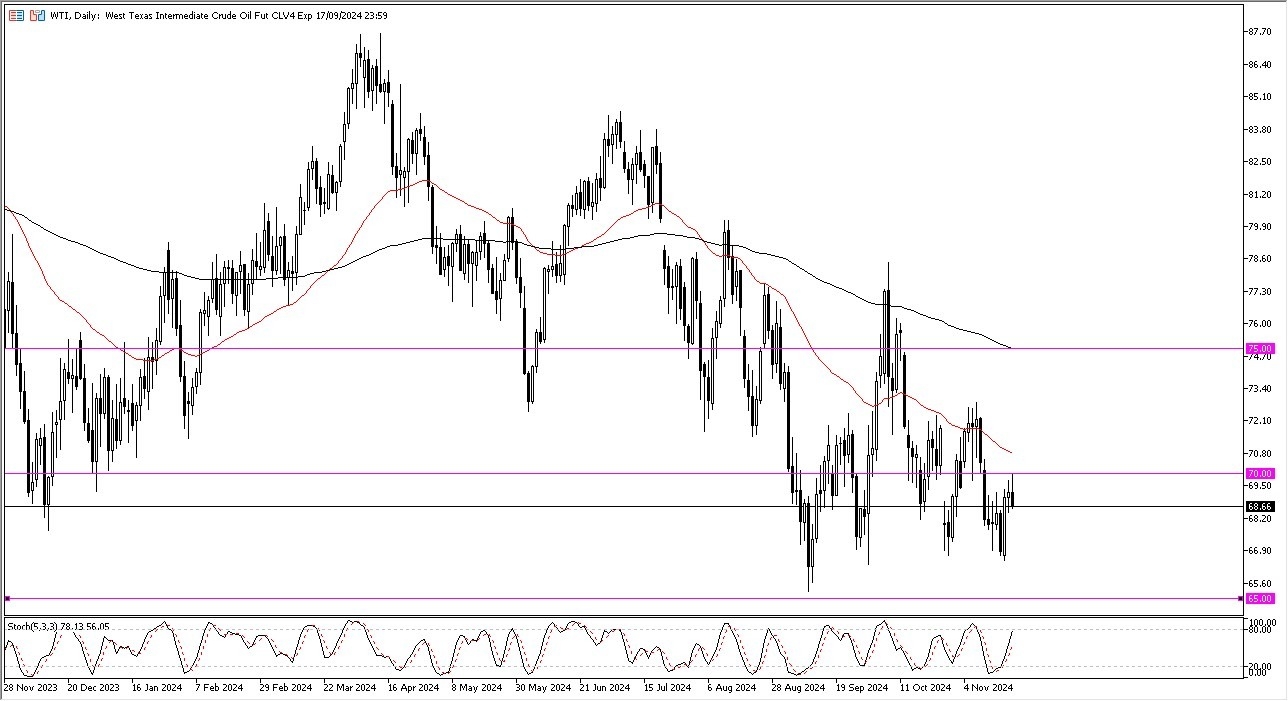
Crude oil has been very noisy as of late, but there are a lot of concerns about demand. That just doesn’t seem to be as much as the global economy is slowing down. All of this being said, it is worth noting that the Trump administration in the United States will almost certainly increase production and therefore add more supply to the mix. But on the other side of this equation, and this is one that might be a bit more immediate, the escalation in Ukraine is going to make some people nervous about Russian supply. Furthermore, let’s not forget that the Middle East can go up in flames at any time as well.
So, with all of this being said, I do think we’re closer to a bottom than a top, but a short term pullback does make a certain amount of sense. If we could break above the $70 level, it could open up a move to roughly $70.50 followed by $72. All things being equal, this is a range-bound but somewhat limp market. With this, I would focus on short term trading more than anything else, perhaps looking at smaller positions as well.
Ready to trade Oil market analysis and predictions? Here are the best Oil trading brokers to choose from.
The USD/JPY outlook shows the yen nears a six-week high after hotter-than-expected Tokyo inflation figures. At the same time, the dollar remained fragile with the ongoing Thanksgiving holiday.
–Are you interested to learn more about forex options trading? Check our detailed guide-
The yen rallied on Friday and was heading for a 3% gain this week as markets raised the likelihood of a Bank of Japan rate hike in December. Data revealed that Tokyo’s core CPI increased by 2.2% in November, above forecasts of 2.1%. Moreover, it was a big increase from the previous month when inflation rose by 1.8%. The surge in price pressures brightened the outlook for the yen as the BoJ will be more willing to hike interest rates.
Consequently, market participants are pricing a 57% chance of a rate hike in December. The yen has suffered since Trump won the US election. Initially, Japan’s currency had recovered at the prospect of an aggressive Fed rate cutting cycle. However, that outlook has shifted significantly, with markets now pricing a gradual pace next year. Therefore, there is more pressure on the Bank of Japan to do something to support its currency.
On the other hand, the dollar was frail on Friday amid the Thanksgiving holiday. At the same time, traders are more convinced the Fed will cut rates in December after inflation figures on Wednesday came in line with expectations. The next major report will show the state of the labor market, further shaping the outlook for Fed rate cuts.
Market participants do not expect any key reports from Japan or the US. Therefore, traders will keep absorbing Japan’s inflation figures.
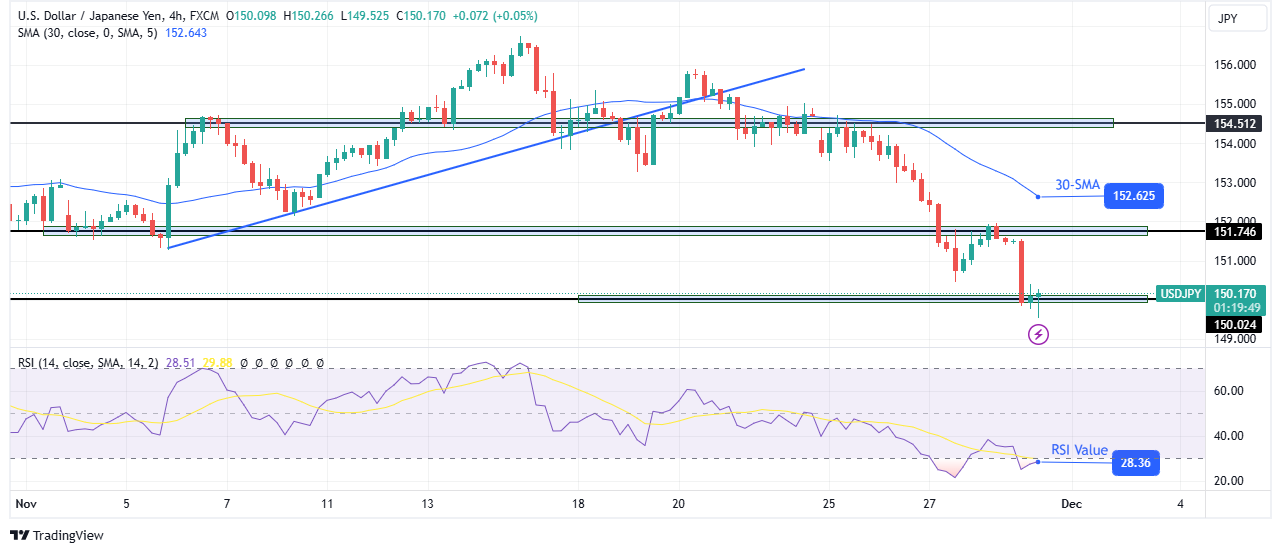
On the technical side, the USD/JPY price has dipped below the 150.02 support before pulling back above the level. The price trades well below the 30-SMA, with the RSI in the oversold region, indicating a strong bearish bias.
–Are you interested in learning more about scalping forex brokers? Check our detailed guide-
Bears made a sharp decline after the price retested the 151.74 level as resistance. They are now facing the 150.02 support level. A break below this level will continue the downtrend with a new low. However, the price might pull back to retest the 30-SMA before making new lows.
Looking to trade forex now? Invest at eToro!
67% of retail investor accounts lose money when trading CFDs with this provider. You should consider whether you can afford to take the high risk of losing your money.
Copper, the third most used metal, plays a crucial role in the energy transition, particularly in electrification and renewable energy. Recent market movements, particularly China’s stimulus measures, have led to significant volatility in copper prices, making the metal’s future uncertain.
Copper futures are actively traded on major platforms like the London Metal Exchange (LME), COMEX, and the Multi-Commodity Exchange (MCX) in India. Copper is the third most used metal globally, particularly in modern industries.
Chile is the top producer, contributing over one-third of the world’s supply, followed by Peru, the Democratic Republic of the Congo, China, the United States, and others. The largest copper importers include China, Japan, India, South Korea, and Germany.
Copper prices have shown significant volatility in October 2024, driven primarily by economic developments in China. The country’s central bank introduced a substantial stimulus package in late September to revive its economy, including monetary measures like lowering interest rates and easing mortgage payments.
These actions briefly boosted copper demand and drove the London Metal Exchange three-month (LME 3M) copper price to a four-month high of $9,995 per metric ton on September 27.
However, the optimism was short-lived as market participants realized that details about the spending of the stimulus package were unclear. This, combined with a stronger U.S. dollar and weaker demand for copper, led to a price dip.
By October 17, the LME 3M copper price had fallen to $9,506 per metric ton as reported and shown below by S&P Global Commodity Insights.
On Monday, copper futures fell to around $4.31 per pound after gaining in the prior two sessions. This decline was driven by a stronger dollar and rising U.S. Treasury yields as a resilient US economy dampened hopes for significant interest rate cuts by the Federal Reserve.
Meanwhile, investors are watching the upcoming National People’s Congress meeting in China (November 4-8) for updates on debt and fiscal measures.
Global copper supply has faced challenges, particularly from production setbacks in key regions. A significant incident affecting supply was a fire at Freeport-McMoRan Inc.’s Manyar smelter in Indonesia, which delayed the smelter’s production start to early 2025. This event has resulted in adjustments to the concentrate market deficit forecast.
Other production challenges included reduced output at key smelters in China, including Baiyin and Jinxin, further tightening the concentrate supply.
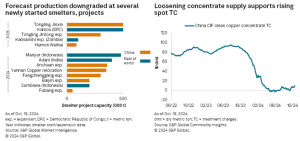
Despite these supply disruptions, treatment charges (TC) for copper concentrates could stay at $35 per dry metric ton in 2025. This suggests that tightness in concentrate supply will persist, potentially causing upward pressure on smelter margins.
The Chinese market exhibited mixed signals. Following the national holidays in early October, downstream copper buyers anticipated further price drops, leading to a slowdown in new orders.
As a result, production cuts were reported among wire and cable manufacturers. Some buyers shifted to using copper scrap due to its greater availability, delaying purchases of primary copper.
Not all demand indicators were weak. China’s electric vehicle (EV) sector provided a boost, with EV production rising 48.8% year-over-year in September 2024. This trend supported higher demand for copper components, crucial in EV manufacturing.
Copper is the best metal for conducting electricity, so it is critical for EVs and batteries, as well as other green energy sources like wind and solar.
An EV uses about 3x more copper than a regular gas-powered car. As the shift to cleaner energy continues, EVs are expected to increase their share of total copper demand from around 11% in 2021 to over 20% by 2040.
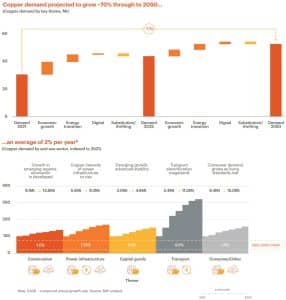
Looking ahead, experts expect copper prices to stay under pressure due to the current balance of supply and demand. However, potential boosts in orders at lower prices and seasonal demand could provide support for prices.
For 2025, the forecast is for a tighter concentrate market, with a predicted shortfall of 848,000 metric tons. This, in turn, could help stabilize prices around $9,825 per metric ton. Despite current challenges, the outlook suggests a mix of cautious optimism and continued volatility in the copper market.
GBP/JPY is trying to pierce the trendline for the uptrend since the August lows. If it is successful and decisively breaches the trendline, it will suggest a follow-through lower to a fresh downside target at 186.20, the 61.8% Fibonacci of the down move prior to the trendline (blue rectangle on chart).
The pair is now in a short and probably medium-term downtrend (since the October 31 high) and according to technical analysis lore trends have a tendency to extend, suggesting the odds favor even more downside to come.
GBP/JPY is making its way down to the next target for the pair at around 189.56, the low of the Right-Angled triangle that formed in late September and early October.
It is also possible it could bounce from the current level at the trendline which is a support level.
The Relative Strength Index (RSI) is not yet oversold which indicates the pair could still have further to fall before it gets oversold.
A decisive breach of the trendline would be one accompanied by a long red candlestick that closed near its lows and well clear of the trendline, or three consecutive red candles that breached the level.
© 2000-2024. All rights reserved.
This site is managed by Teletrade D.J. LLC 2351 LLC 2022 (Euro House, Richmond Hill Road, Kingstown, VC0100, St. Vincent and the Grenadines).
The information on this website is for informational purposes only and does not constitute any investment advice.
The company does not serve or provide services to customers who are residents of the US, Canada, Iran, The Democratic People’s Republic of Korea, Yemen and FATF blacklisted countries.
Making transactions on financial markets with marginal financial instruments opens up wide possibilities and allows investors who are willing to take risks to earn high profits, carrying a potentially high risk of losses at the same time. Therefore you should responsibly approach the issue of choosing the appropriate investment strategy, taking the available resources into account, before starting trading.
Use of the information: full or partial use of materials from this website must always be referenced to TeleTrade as the source of information. Use of the materials on the Internet must be accompanied by a hyperlink to teletrade.org. Automatic import of materials and information from this website is prohibited.
Please contact our PR department if you have any questions or need assistance at pr@teletrade.global.
Silver price (XAG/USD) recovers further to near $31.00 in North American session on Friday. The white metal bounced back on Thursday after posting a fresh 11-week low near $29.60. The asset strengthens as investors fear that Russia could launch a nuclear attack on Ukraine.
Russia threatens a possible nuclear-capable ballistic missile strike on Ukraine, followed by firing a series of Intermediate Range Ballistic Missiles (IRBM) on 17 targets, including defense and energy facilities. The prevailing war between Russia and Ukraine keeps the demand for safe-haven assets intact. This was the second-largest Russian attack on Ukraine, according to Ukraine’s energy ministry. Historically, the safe-haven appeal of precious metals such as Silver increases at times of global market uncertainty or heightened geopolitical risks.
In the Middle East, tensions between Israel and Iran have eased, with a ceasefire coming into effect early this week.
Meanwhile, the US Dollar (USD) rebounds strongly as investors shift focus to the United States (US) labor market and business activity data, which will be released next week. The US Dollar Index (DXY), which tracks the Greenback’s value against six major currencies, bounces back after posting a fresh two-week low near 105.60.
Silver price rebounds strongly after sliding to near the upward-sloping trendline around $29.50, which is plotted from the February 29 low of $22.30 on a daily timeframe. Still, the outlook of the Silver price is bearish as a bear cross, represented by 20 and 50-day Exponential Moving Average (EMA) around $31.30, points to an escalation in the downside trend.
The white metal weakened after the breakdown of the horizontal support plotted from the May 21 high of $32.50.
The 14-day Relative Strength Index (RSI) oscillates in the 40.00-60.00 range, suggesting a sideways trend.
Silver is a precious metal highly traded among investors. It has been historically used as a store of value and a medium of exchange. Although less popular than Gold, traders may turn to Silver to diversify their investment portfolio, for its intrinsic value or as a potential hedge during high-inflation periods. Investors can buy physical Silver, in coins or in bars, or trade it through vehicles such as Exchange Traded Funds, which track its price on international markets.
Silver prices can move due to a wide range of factors. Geopolitical instability or fears of a deep recession can make Silver price escalate due to its safe-haven status, although to a lesser extent than Gold’s. As a yieldless asset, Silver tends to rise with lower interest rates. Its moves also depend on how the US Dollar (USD) behaves as the asset is priced in dollars (XAG/USD). A strong Dollar tends to keep the price of Silver at bay, whereas a weaker Dollar is likely to propel prices up. Other factors such as investment demand, mining supply – Silver is much more abundant than Gold – and recycling rates can also affect prices.
Silver is widely used in industry, particularly in sectors such as electronics or solar energy, as it has one of the highest electric conductivity of all metals – more than Copper and Gold. A surge in demand can increase prices, while a decline tends to lower them. Dynamics in the US, Chinese and Indian economies can also contribute to price swings: for the US and particularly China, their big industrial sectors use Silver in various processes; in India, consumers’ demand for the precious metal for jewellery also plays a key role in setting prices.
Silver prices tend to follow Gold’s moves. When Gold prices rise, Silver typically follows suit, as their status as safe-haven assets is similar. The Gold/Silver ratio, which shows the number of ounces of Silver needed to equal the value of one ounce of Gold, may help to determine the relative valuation between both metals. Some investors may consider a high ratio as an indicator that Silver is undervalued, or Gold is overvalued. On the contrary, a low ratio might suggest that Gold is undervalued relative to Silver.
The Pound Sterling (GBP) snapped a two-week downtrend and staged a comeback against the US Dollar (USD), driving the GBP/USD pair back to the 1.2700 threshold.
GBP/USD returned to the green as a dramatic week drew to a close. Markets witnessed a steep correction in the USD, courtesy of the US fundamental catalysts, offering a much-needed respite to the Pound Sterling buyers.
Starting the week, they jumped in on Monday, helping the pair rebound from the six-month low of 1.2488, set on November 22. The Greenback saw a bearish opening gap in tandem with the US Treasury bond yields and extended the downside in response to the weekend news that US President-elect Donald Trump named billionaire Scott Bessent as his Treasury Secretary. Bessent’s appointment to the critical position in the Trump administration reassured the US bond market as he is seen as a fiscal conservative.
The GBP/USD recovery paused on Tuesday after the Greenback found fresh safe-haven demand following US President-elect Donald Trump’s announcement of a 25% tariff on all products from Mexico and Canada and an additional 10% tariff on goods from China once he takes over his office on January 20. Intensifying risk aversion on the looming threat of a global trade war curbed appetite for high-beta currencies such as the British Pound.
However, USD sellers returned on Wednesday alongside risk appetite on easing geopolitical tensions between Israel and Lebanon. Reuters reported that “a ceasefire between Israel and Iran-backed group Hezbollah came into effect at 0200 GMT on Wednesday after US President Joe Biden said both sides accepted an agreement brokered by the United States and France.”
The US currency also suffered due to sustained expectations that the US Federal Reserve (Fed) will likely cut interest rates by 25 basis points (bps) in December. The weakness extended into Thanksgiving Thursday, especially after Wednesday’s US core Personal Consumption Expenditure (PCE) Price Index data failed to alter Fed rate cut expectations for next month.
The Fed’s preferred inflation gauge, the core PCE Price Index, increased at 0.3% on a monthly basis and an annual reading of 2.8%, aligning with market expectations. Thin trading conditions also left the Greenback miring in the weekly troughs, aiding the additional upswing in the Pound Sterling.
On Friday, nothing seemed different from the fundamental perspective as sentiment around the US Dollar remained tepid, pushing GBP/USD to the highest level in two weeks above 1.2700.
Meanwhile, there was no high-impact economic data from the UK during the week, while Bank of England (BoE) policymakers continued to voice caution about further rate cuts. Deputy Governor Clare Lombardelli said Tuesday that she needs to see more evidence of cooling price pressures before she backs another interest rate reduction, per Bloomberg.
An action-packed week unfolds after a relatively quiet one, with labor data from the US likely to dominate the week. In contrast, the UK economic calendar lacks any high-impact data releases in the upcoming week.
Apart from the data publication, risk sentiment will play a pivotal role in influencing the higher-yielding Pound Sterling as global trade war fears mount following US President-elect Donald Trump’s announcement of tariffs on Mexico, Canada, and China.
On Monday, the US Institute for Supply Management (ISM) Manufacturing Purchasing Managers’ Index (PMI) will stand out following the releases of the S&P Global final UK and US Manufacturing PMI reports.
The US JOLTS Job Openings Survey will be the only vital data published on Tuesday. Wednesday will feature the top-tier US ADP Employment Change and ISM Services PMI data. Additionally, appearances from BoE Governor Andrew Bailey and Fed Chairman Jerome Powell will hog the limelight that day.
Powell’s appearance will be his last public one before the Fed enters the ‘blackout period’ on December 7.
The usual weekly US Jobless Claims will be reported on Thursday, followed by BoE policymaker Megan Greene’s speech.
All eyes will be on Friday’s critical US Nonfarm Payrolls (NFP) for fresh signs on labor market conditions and the Fed’s rate outlook.
Speeches from several Fed policymakers will be listed throughout the week and could be significant as the ‘blackout’ period kicks on Saturday ahead of the December 17-18 policy meeting.
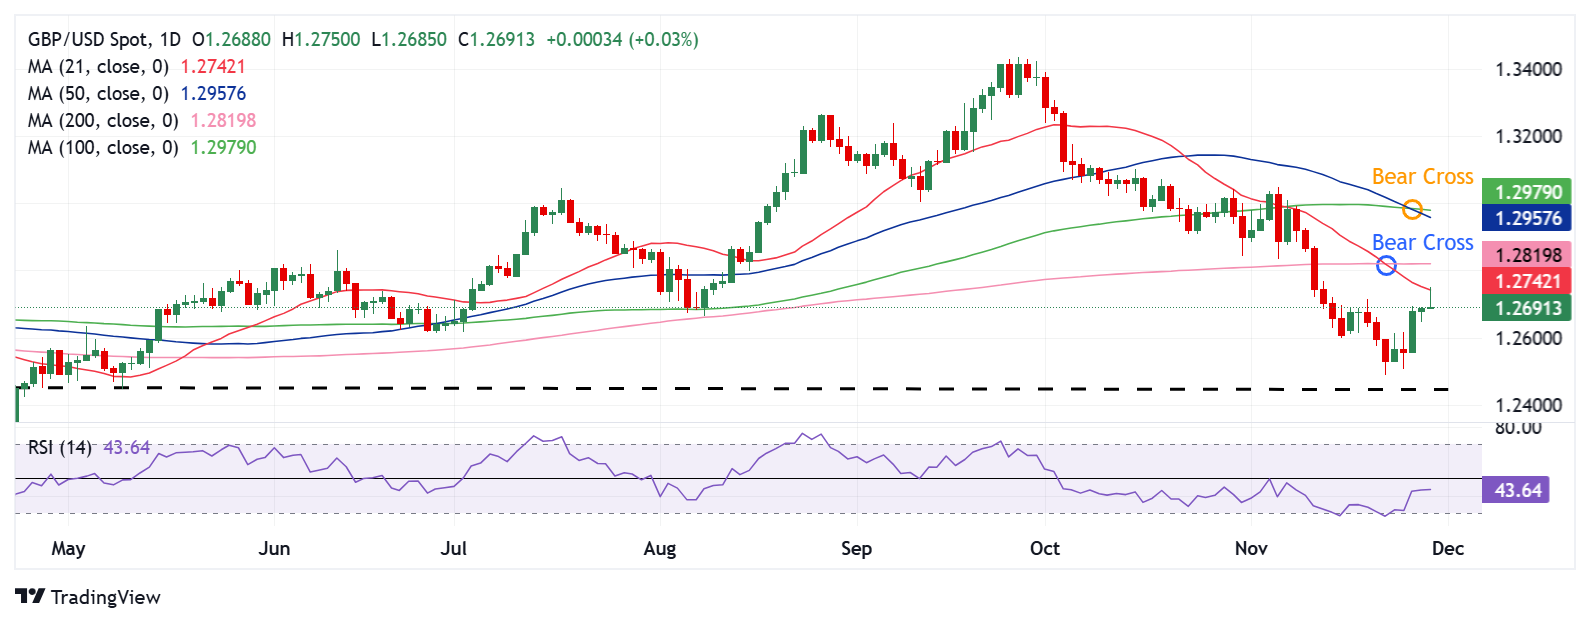
From a short-term technical outlook, the GBP/USD pair’s downside risks remain intact as long as the 14-day Relative Strength Index (RSI) remains below the 50 level.
Despite the latest recovery, the leading indicators currently trade near 45.
Adding credence to the negative outlook, the pair charted dual Bear Crosses on the daily time frame.
On November 22, the 21-day Simple Moving Average (SMA) closed below the 200-day SMA, while the 50-day SMA cut the 100-day SMA from above on a daily closing basis on November 27.
The Pound Sterling needs a sustained break above the 200-day SMA at 1.2820 to initiate a meaningful uptrend toward the strong contention area near 1.2975, where the 50-day SMA and the 100-day SMA hang.
Further up, the 1.3000 psychological level could challenge the bearish commitments.
On the downside, strong support aligns at the 1.2600 round level, below which the weekly low of 1.2507 will be tested.
A failure to defend that level will open the downside toward the six-month low of 1.2487, followed by the May 9 low of 1.2446.
Nonfarm Payrolls (NFP) are part of the US Bureau of Labor Statistics monthly jobs report. The Nonfarm Payrolls component specifically measures the change in the number of people employed in the US during the previous month, excluding the farming industry.
The Nonfarm Payrolls figure can influence the decisions of the Federal Reserve by providing a measure of how successfully the Fed is meeting its mandate of fostering full employment and 2% inflation. A relatively high NFP figure means more people are in employment, earning more money and therefore probably spending more. A relatively low Nonfarm Payrolls’ result, on the either hand, could mean people are struggling to find work. The Fed will typically raise interest rates to combat high inflation triggered by low unemployment, and lower them to stimulate a stagnant labor market.
Nonfarm Payrolls generally have a positive correlation with the US Dollar. This means when payrolls’ figures come out higher-than-expected the USD tends to rally and vice versa when they are lower. NFPs influence the US Dollar by virtue of their impact on inflation, monetary policy expectations and interest rates. A higher NFP usually means the Federal Reserve will be more tight in its monetary policy, supporting the USD.
Nonfarm Payrolls are generally negatively-correlated with the price of Gold. This means a higher-than-expected payrolls’ figure will have a depressing effect on the Gold price and vice versa. Higher NFP generally has a positive effect on the value of the USD, and like most major commodities Gold is priced in US Dollars. If the USD gains in value, therefore, it requires less Dollars to buy an ounce of Gold. Also, higher interest rates (typically helped higher NFPs) also lessen the attractiveness of Gold as an investment compared to staying in cash, where the money will at least earn interest.
Nonfarm Payrolls is only one component within a bigger jobs report and it can be overshadowed by the other components. At times, when NFP come out higher-than-forecast, but the Average Weekly Earnings is lower than expected, the market has ignored the potentially inflationary effect of the headline result and interpreted the fall in earnings as deflationary. The Participation Rate and the Average Weekly Hours components can also influence the market reaction, but only in seldom events like the “Great Resignation” or the Global Financial Crisis.
Silver (XAG/USD) continues its upward trend for the second consecutive session, hovering around $30.70 during the Asian trading hours on Friday. This rally in Silver price is largely driven by escalating geopolitical tensions. Reports suggest that Russian President Vladimir Putin warned of a possible nuclear-capable ballistic missile strike on Ukraine, following Moscow’s recent large-scale attacks on key energy infrastructure.
Meanwhile, a ceasefire between Israel and the Lebanese militant group Hezbollah was successfully maintained on Wednesday, thanks to a deal brokered by the United States and France. This truce has enabled residents to begin returning to their homes. However, Israel is still engaged in military operations against Hamas in the Gaza Strip.
Furthermore, the weakening of the US Dollar (USD) is making dollar-denominated Silver more affordable for buyers with foreign currencies, boosting its demand. Additionally, the US bond market has strengthened after US President-elect Donald Trump selected Wall Street veteran and fiscal conservative Scott Bessent as the US Treasury Secretary.
Markets are closely monitoring upcoming US data for further clues about the Federal Reserve’s (Fed) monetary policy direction. On Wednesday, US core PCE prices for October met expectations, keeping investor hopes alive for another rate cut in December. However, other data indicated a resilient economy, suggesting that the Fed may take a cautious approach in the coming year.
According to the CME FedWatch Tool, futures traders are now pricing in a 66.5% probability of a 25 basis point rate cut in December, up from 55.9% a week ago. However, they expect the Fed to keep rates unchanged during its January and March meetings.
Silver is a precious metal highly traded among investors. It has been historically used as a store of value and a medium of exchange. Although less popular than Gold, traders may turn to Silver to diversify their investment portfolio, for its intrinsic value or as a potential hedge during high-inflation periods. Investors can buy physical Silver, in coins or in bars, or trade it through vehicles such as Exchange Traded Funds, which track its price on international markets.
Silver prices can move due to a wide range of factors. Geopolitical instability or fears of a deep recession can make Silver price escalate due to its safe-haven status, although to a lesser extent than Gold’s. As a yieldless asset, Silver tends to rise with lower interest rates. Its moves also depend on how the US Dollar (USD) behaves as the asset is priced in dollars (XAG/USD). A strong Dollar tends to keep the price of Silver at bay, whereas a weaker Dollar is likely to propel prices up. Other factors such as investment demand, mining supply – Silver is much more abundant than Gold – and recycling rates can also affect prices.
Silver is widely used in industry, particularly in sectors such as electronics or solar energy, as it has one of the highest electric conductivity of all metals – more than Copper and Gold. A surge in demand can increase prices, while a decline tends to lower them. Dynamics in the US, Chinese and Indian economies can also contribute to price swings: for the US and particularly China, their big industrial sectors use Silver in various processes; in India, consumers’ demand for the precious metal for jewellery also plays a key role in setting prices.
Silver prices tend to follow Gold’s moves. When Gold prices rise, Silver typically follows suit, as their status as safe-haven assets is similar. The Gold/Silver ratio, which shows the number of ounces of Silver needed to equal the value of one ounce of Gold, may help to determine the relative valuation between both metals. Some investors may consider a high ratio as an indicator that Silver is undervalued, or Gold is overvalued. On the contrary, a low ratio might suggest that Gold is undervalued relative to Silver.
After posting small gains on Thursday, GBP/USD gathered bullish momentum and climbed to its highest level in over two weeks at 1.2750 early Friday.
Following the Thanksgiving Day holiday in the US, the US Dollar (USD) came under renewed selling pressure amid a positive shift seen in risk mood in the Asian session and helped GBP/USD gain traction. Additionally, US Treasury bond yields continued to stretch lower, making it difficult for the USD to find a foothold.
The table below shows the percentage change of British Pound (GBP) against listed major currencies this week. British Pound was the strongest against the US Dollar.
| USD | EUR | GBP | JPY | CAD | AUD | NZD | CHF | |
|---|---|---|---|---|---|---|---|---|
| USD | -1.47% | -1.40% | -2.61% | 0.37% | -0.15% | -1.04% | -1.26% | |
| EUR | 1.47% | -0.10% | -1.75% | 1.25% | 1.26% | -0.15% | -0.37% | |
| GBP | 1.40% | 0.10% | -1.66% | 1.37% | 1.37% | -0.04% | -0.27% | |
| JPY | 2.61% | 1.75% | 1.66% | 3.06% | 2.97% | 1.68% | 1.58% | |
| CAD | -0.37% | -1.25% | -1.37% | -3.06% | -0.36% | -1.38% | -1.64% | |
| AUD | 0.15% | -1.26% | -1.37% | -2.97% | 0.36% | -1.39% | -1.61% | |
| NZD | 1.04% | 0.15% | 0.04% | -1.68% | 1.38% | 1.39% | -0.22% | |
| CHF | 1.26% | 0.37% | 0.27% | -1.58% | 1.64% | 1.61% | 0.22% |
The heat map shows percentage changes of major currencies against each other. The base currency is picked from the left column, while the quote currency is picked from the top row. For example, if you pick the British Pound from the left column and move along the horizontal line to the US Dollar, the percentage change displayed in the box will represent GBP (base)/USD (quote).
At the time of press, US stock index futures were up between 0.3% and 0.4%, while the UK’s FTSE 100 Index was trading flat on the day.
Later in the session, the Bank of England (BoE) will publish the Financial Stability Report, which is unlikely to trigger a significant market reaction. The US economic calendar will not offer any high-impact macroeconomic data releases. Moreover, stock and bond markets in the US will close early. Hence, the trading action is likely to turn subdued heading into the weekend. Month-end flows and position adjustments on the last business day of November, however, could ramp up market volatility and trigger irregular action in GBP/USD toward the end of the European session.
GBP/USD was last seen trading slightly above 1.2700, where the 100-period Simple Moving Average (SMA) on the 4-hour chart is located. While this level remains intact as support, technical buyers could remain interested. On the upside, 1.2760 (static level) aligns as next resistance before 1.2800 (round level, static level) and 1.2835 (200-period SMA).
In case 1.2700 support fails, 1.2640 (20-period SMA, static level) could be seen as next support ahead of 1.2600 (static level, round level).
The Pound Sterling (GBP) is the oldest currency in the world (886 AD) and the official currency of the United Kingdom. It is the fourth most traded unit for foreign exchange (FX) in the world, accounting for 12% of all transactions, averaging $630 billion a day, according to 2022 data. Its key trading pairs are GBP/USD, also known as ‘Cable’, which accounts for 11% of FX, GBP/JPY, or the ‘Dragon’ as it is known by traders (3%), and EUR/GBP (2%). The Pound Sterling is issued by the Bank of England (BoE).
The single most important factor influencing the value of the Pound Sterling is monetary policy decided by the Bank of England. The BoE bases its decisions on whether it has achieved its primary goal of “price stability” – a steady inflation rate of around 2%. Its primary tool for achieving this is the adjustment of interest rates. When inflation is too high, the BoE will try to rein it in by raising interest rates, making it more expensive for people and businesses to access credit. This is generally positive for GBP, as higher interest rates make the UK a more attractive place for global investors to park their money. When inflation falls too low it is a sign economic growth is slowing. In this scenario, the BoE will consider lowering interest rates to cheapen credit so businesses will borrow more to invest in growth-generating projects.
Data releases gauge the health of the economy and can impact the value of the Pound Sterling. Indicators such as GDP, Manufacturing and Services PMIs, and employment can all influence the direction of the GBP. A strong economy is good for Sterling. Not only does it attract more foreign investment but it may encourage the BoE to put up interest rates, which will directly strengthen GBP. Otherwise, if economic data is weak, the Pound Sterling is likely to fall.
Another significant data release for the Pound Sterling is the Trade Balance. This indicator measures the difference between what a country earns from its exports and what it spends on imports over a given period. If a country produces highly sought-after exports, its currency will benefit purely from the extra demand created from foreign buyers seeking to purchase these goods. Therefore, a positive net Trade Balance strengthens a currency and vice versa for a negative balance.
The GBP/USD pair is trading at $1.27310, up 0.38%, supported by a bullish breakout above the pivot point at $1.26833. The pair finds immediate resistance at $1.27677, with further levels to watch at $1.28050 and $1.28463. On the downside, key support lies at $1.26455, followed by $1.25890 and $1.25318.
The 50-day EMA at $1.26422 strengthens near-term support, while the 200-day EMA at $1.27035 provides an intermediate threshold. A sustained move above $1.26833 keeps the pair’s bullish momentum intact, targeting higher resistance zones.
However, a break below this level could signal a reversal toward support at $1.25890. For now, the pair remains in an upward trajectory, with cautious optimism prevailing.
The Euro faced pressure as German retail sales declined by 1.5%, well below the forecast of -0.5%. Meanwhile, German import prices rose 0.6%, signaling higher costs.
French data showed consumer spending fell 0.4%, with inflation slightly easing as the French prelim CPI dropped to -0.1%.
Core CPI Flash Estimate y/y is expected at 2.8%, with German unemployment change at 20K. All eyes are on Buba President Nagel’s remarks later today.