The main category of Forex News.
You can use the search box below to find what you need.
[wd_asp id=1]
The main category of Forex News.
You can use the search box below to find what you need.
[wd_asp id=1]
The table below shows the percentage change of Euro (EUR) against listed major currencies today. Euro was the strongest against the Japanese Yen.
| USD | EUR | GBP | JPY | CAD | AUD | NZD | CHF | |
|---|---|---|---|---|---|---|---|---|
| USD | -0.24% | -0.05% | 0.43% | -0.04% | -0.05% | 0.28% | -0.23% | |
| EUR | 0.24% | 0.36% | 0.77% | 0.32% | 0.35% | 0.64% | 0.14% | |
| GBP | 0.05% | -0.36% | 0.43% | -0.05% | -0.02% | 0.27% | -0.24% | |
| JPY | -0.43% | -0.77% | -0.43% | -0.48% | -0.41% | -0.09% | -0.58% | |
| CAD | 0.04% | -0.32% | 0.05% | 0.48% | 0.01% | 0.32% | -0.18% | |
| AUD | 0.05% | -0.35% | 0.02% | 0.41% | -0.01% | 0.29% | -0.21% | |
| NZD | -0.28% | -0.64% | -0.27% | 0.09% | -0.32% | -0.29% | -0.50% | |
| CHF | 0.23% | -0.14% | 0.24% | 0.58% | 0.18% | 0.21% | 0.50% |
The heat map shows percentage changes of major currencies against each other. The base currency is picked from the left column, while the quote currency is picked from the top row. For example, if you pick the Euro from the left column and move along the horizontal line to the US Dollar, the percentage change displayed in the box will represent EUR (base)/USD (quote).
Gold price extends its gradual recovery mode and tests the critical $2,670 resistance early Friday, having hit a weekly low of $2,605 on Tuesday. A broadly subdued US Dollar (USD) performance alongside the US Treasury bond yields lend support to the Gold price upswing.
Despite the growing risks of a global tariff war, US President-elect Donald Trump’s tariffs announcements earlier in the week, the USD maintained its downbeat performance against its major rivals amid sustained bets that the US Federal Reserve (Fed) will lower interest rates by 25 basis points (bps) in December.
The in-line with expectations US Personal Consumption Expenditure (PCE) Price Index data released on Wednesday failed to deter Fed rate cut expectations as markets now pricing in about a 63% chance of a December Fed rate reduction, the CME Group’s FedWatch Tool shows, up from about 55% seen a week ago.
The dovish sentiment around the Fed’s next policy action continues to underpin the non-interest-bearing Gold price.
Meanwhile, the traditional safe-haven Gold price also capitalizes on renewed geopolitical tensions between Russia and Ukraine after several media outlets reported that Russian President Vladimir Putin threatened to attack decision-making centres in the Ukrainian capital of Kyiv with the country’s new ballistic missile, Oreshnik.
This came after Moscow launched a “comprehensive” strike on Ukraine’s energy grid overnight in retaliation to Ukraine’s “continued attacks” using US-supplied Atacms missiles on Russian soil.”
Looking ahead, it remains to be seen if the Gold price will build on the recovery momentum amid thin trading conditions, as US traders could be away due to the Thanksgiving long weekend. Further, the Gold price could also benefit if the US Dollar sees a fresh leg lower amid extended declines in the USD/JPY pair.
The sharp rebound in the Japanese Yen comes after the Tokyo inflation data arrived hotter than expected and bolstered rate hike bets from the Bank of Japan (BoJ) next month.
It’s an empty US docket on Friday, therefore, the Eurozone inflation report could somewhat drive the sentiment along with the end-of-the-week flows, impacting the Gold price action.
Technically, Gold buyers are fighting back control, justified by the 14-day Relative Strength Index (RSI) briefly recapturing the 50 level.
However, with the Bear Cross still playing out, Gold price’s bullish conviction could likely peter out.
If Gold buyers fail to find acceptance above the 50-day SMA at $2,670 on a daily closing basis, sellers will likely jump back, sending the bright metal back toward the previous day’s low of $2,621.
The next support aligns at the weekly low of $2,605, below which a drop toward the 100-day SMA at $2,573 cannot be ruled out.
On the flip side, a sustained move above the 50-day SMA at $2,670 could open up the upside toward the $2,700 level.
Further north, the November 25 high of $2,721 will be put to the test.
Gold has played a key role in human’s history as it has been widely used as a store of value and medium of exchange. Currently, apart from its shine and usage for jewelry, the precious metal is widely seen as a safe-haven asset, meaning that it is considered a good investment during turbulent times. Gold is also widely seen as a hedge against inflation and against depreciating currencies as it doesn’t rely on any specific issuer or government.
Central banks are the biggest Gold holders. In their aim to support their currencies in turbulent times, central banks tend to diversify their reserves and buy Gold to improve the perceived strength of the economy and the currency. High Gold reserves can be a source of trust for a country’s solvency. Central banks added 1,136 tonnes of Gold worth around $70 billion to their reserves in 2022, according to data from the World Gold Council. This is the highest yearly purchase since records began. Central banks from emerging economies such as China, India and Turkey are quickly increasing their Gold reserves.
Gold has an inverse correlation with the US Dollar and US Treasuries, which are both major reserve and safe-haven assets. When the Dollar depreciates, Gold tends to rise, enabling investors and central banks to diversify their assets in turbulent times. Gold is also inversely correlated with risk assets. A rally in the stock market tends to weaken Gold price, while sell-offs in riskier markets tend to favor the precious metal.
The price can move due to a wide range of factors. Geopolitical instability or fears of a deep recession can quickly make Gold price escalate due to its safe-haven status. As a yield-less asset, Gold tends to rise with lower interest rates, while higher cost of money usually weighs down on the yellow metal. Still, most moves depend on how the US Dollar (USD) behaves as the asset is priced in dollars (XAU/USD). A strong Dollar tends to keep the price of Gold controlled, whereas a weaker Dollar is likely to push Gold prices up.
A decisive break out of the triangle pattern triggered with a move above 3.02 on November 20. Since the bull breakout has only just begun, an eventual continuation to higher prices is anticipated once the current correction is complete. This is just the first pullback following the breakout through key price levels.
Not only was there a triangle breakout but also a clear continuation of the rising trend that began from the 2024 low in February. It is shown as a rising ABCD pattern (orange) on the chart. Within that trend is a smaller ABCD pattern (purple) that rises from the August swing low. That second pattern triggered a bullish continuation on the rally above 3.02.
It remains to be seen whether the correction will be short in duration or prolonged. Resistance was seen at the top of the rising trend channel last week from a high of 3.56. A sharp intraday decline followed, culminating in a bearish reversal day. The parallel channel shows an organized price structure that reflects symmetry in the behavior or price. A rising middle line (dotted) shows price action roughly equal distance above and below the line.
Given that there is symmetry, there is a good chance that the lower channel line is tested as support before the bearish correction is complete. This doesn’t mean that it will reach the lower line, just that there is a good chance that it might. The recent two long red candles, first on November 22 and then again yesterday, show distribution, and they may be providing a clue that there is more selling to come before the correction completes. However, that outlook would switch if there was a sharp rise above Wednesday’s high of 3.47 and it was sustained.
For a look at all of today’s economic events, check out our economic calendar.
The Japanese Yen price found strong momentum to achieve gains amid expectations that the Bank of Japan may raise interest rates again early next month. In this regard, Bank of Japan Governor Kazuo Ueda recently indicated the possibility of raising interest rates in December, citing concerns about the weakness of the Japanese Yen. Financial markets are now pricing in a roughly 60% chance of a 25-basis point rate hike in Japan next month, up from around 50% just a week ago. The Japanese yen will react to Friday’s release of inflation data in Tokyo, which could provide additional insights into the future direction of the Bank of Japan’s policy.
According to recent trading, the yield on the 10-year Japanese government bond fell to around 1.06% on Thursday, hitting a two-week low, tracking a decline in US Treasury yields as US inflation data came in in line with expectations, suggesting no major change in the path of US rate cuts. In Japan, investors are closely watching the Bank of Japan’s monetary policy stance, with speculation growing that the central bank could raise interest rates again at its meeting next month. Financial markets are pricing in a 60% chance of a 25bp rate hike next month, up from around 50% just a week ago.

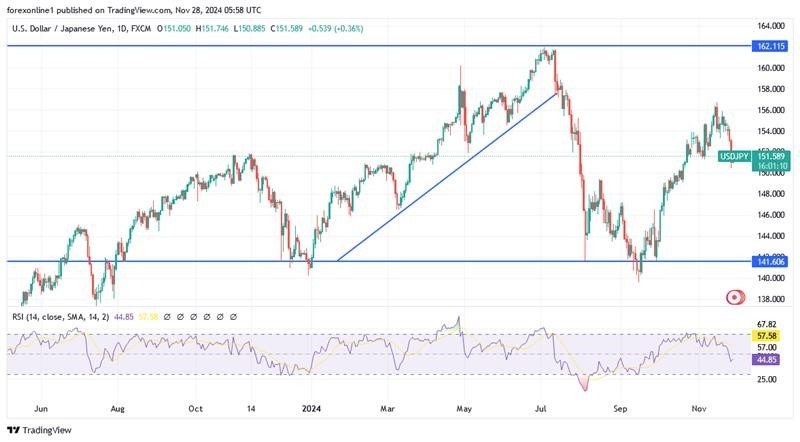
The bearish momentum of USD/JPY has added to the overall decline in the US dollar as US PCE inflation data came in line with expectations, suggesting a slight change in the Fed’s approach to cutting US interest rates. Technically, and based on the performance on the daily chart, the 150.00 support level will remain a dividing line for USD/JPY in the coming days. Stability below the level will encourage bears to move towards stronger support levels, the closest of which are 148.80 and 147.00 respectively. On the other hand, in the same time frame, if USD/JPY returns above the 153.60 resistance, it will be important for bulls to control the pair.
We recommend buying the US dollar/Japanese yen from every downward level. Always be careful not to take risks and activate profit limit and stop loss orders to ensure the safety of your trading account from any price reversals that may come suddenly.
Want to trade our USD/JPY Forex analysis and predictions? Here’s a list of forex brokers in Japan to check out.
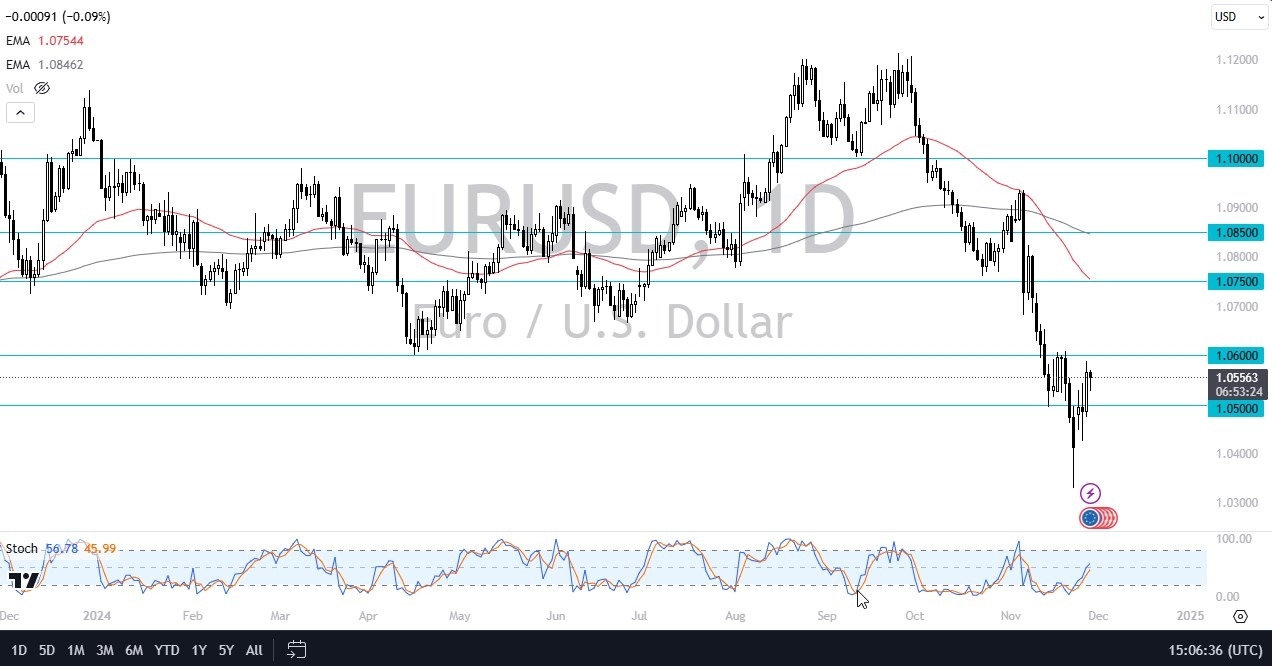
But ultimately, this is a pair that I still think would favor the US dollar longer term. The fact is that the United States is about to enter a renaissance in the business world, at least as far as the way the government approaches it. And one would think that there will be a lot of investment in America.
At the same time, we have the land war in Ukraine, and it is getting hotter. So, I think the upside in the euro is a little somewhat limited in that sense as well. The EUR/USD market looks very much like one that is just bouncing from an oversold condition, which makes quite a bit of sense. The US dollar has swallowed everything over the last several months.
With this being said, I expect short-term traders to be buyers of euros and longer-term traders to look for some type of opportunity to pick up cheap dollars. It is a bit of a two-speed market. It just depends on what timeframe you’re looking at. But like I said, based on the action that we’ve seen over the last couple of days, we are doing everything we can to break above 1.06 and I am seeing similar action in other currency pairs, such as the British Pound. After all, it’s quite common for these pairs to move based on the US dollar itself, as in general, if you can get the trajectory of the US dollar correct, you can generally do okay when it comes to most forex pairs.
Ready to trade our daily EUR/USD Forex forecast? Here’s a list of some of the top forex brokers in Europe to check out.
On the other side, if we were to drop from here, I think there is a massive amount of support down near the 1.25 level. Ultimately, we are leaning toward the upside, and I do think that we are starting to see the US dollar give up some of its strength against certain currencies that are a little better suited to prevail at this point. The British pound has been very stubborn against the greenback in relation to other currencies, so it’s possible that we could see the British pound lead the way to any type of sell off when it comes to the greenback.
I think this comes down to whether or not the US dollar starts to strengthen. If it does, then that will more likely than not kill the idea of a breakout. We will probably drop from here to go down to the 1.25 level. Anything below the 1.25 level would be extreme US dollar strength, and you would probably just see the US dollar swallow almost everything, and at that point in time it’s possible that we could see the best traits being shorting other currency such as the euro or the Australian dollar. While the British pound would drop in that scenario, may not drop as quickly.
On the other hand, if the US dollar starts to weaken everywhere else, it’s likely that we would see the British pound lead the way and it could move much quicker than others. At that point in time, I think we will probably go looking to the 1.2850 level rather quickly. Keep in mind the 200 Day EMA is in that same vicinity.
Ready to trade our daily GBP/USD Forex forecast? Here’s some of the best forex broker UK reviews to check out.
Important DisclaimersThe content provided on the website includes general news and publications, our personal analysis and opinions, and contents provided by third parties, which are intended for educational and research purposes only. It does not constitute, and should not be read as, any recommendation or advice to take any action whatsoever, including to make any investment or buy any product. When making any financial decision, you should perform your own due diligence checks, apply your own discretion and consult your competent advisors. The content of the website is not personally directed to you, and we does not take into account your financial situation or needs.The information contained in this website is not necessarily provided in real-time nor is it necessarily accurate. Prices provided herein may be provided by market makers and not by exchanges.Any trading or other financial decision you make shall be at your full responsibility, and you must not rely on any information provided through the website. FX Empire does not provide any warranty regarding any of the information contained in the website, and shall bear no responsibility for any trading losses you might incur as a result of using any information contained in the website.The website may include advertisements and other promotional contents, and FX Empire may receive compensation from third parties in connection with the content. FX Empire does not endorse any third party or recommends using any third party’s services, and does not assume responsibility for your use of any such third party’s website or services.FX Empire and its employees, officers, subsidiaries and associates, are not liable nor shall they be held liable for any loss or damage resulting from your use of the website or reliance on the information provided on this website.Risk DisclaimersThis website includes information about cryptocurrencies, contracts for difference (CFDs) and other financial instruments, and about brokers, exchanges and other entities trading in such instruments. Both cryptocurrencies and CFDs are complex instruments and come with a high risk of losing money. You should carefully consider whether you understand how these instruments work and whether you can afford to take the high risk of losing your money.FX Empire encourages you to perform your own research before making any investment decision, and to avoid investing in any financial instrument which you do not fully understand how it works and what are the risks involved.
Spot Gold remains lifeless below the $2,650 level on a quiet Thursday as investors gear up for an extended weekend. The batch of United States (US) macroeconomic data released on Wednesday anticipated the ongoing quietness, as all American markets are closed amid the Thanksgiving Holiday.
On a positive note, the bright metal finds support in mounting expectations that the Federal Reserve (Fed) will deliver another 25 basis points (bps) interest rate cut when it meets in mid-December. At the time, according to the CME FedWatch Toll, the odds are roughly 70%.
Meanwhile, European stocks closed in the green, led by the tech sector amid receding concerns about the US imposing fresh tariffs on China’s products.
From a technical point of view, XAU/USD has made little progress. It’s trading barely up for a third consecutive day, still confined to the lower end of its weekly range after plummeting on Monday. Technical readings in the daily chart show that the risk skews to the downside, as Gold is meeting sellers around a bearish 20 Simple Moving Average (SMA) for a second consecutive day. The 100 and 200 SMAs, in the meantime, remain well below their current level, partially losing their upward strength. Finally, technical indicators head nowhere within negative levels, in line with absent buying interest.
In the near term, and according to the 4-hour chart, XAU/USD is neutral-to-bearish. The pair is trading just above converging 20 and 100 SMAs, with the shorter one offering a firmer downward slope, suggesting mounting selling pressure. The 200 SMA, in the meantime, remains directionless far above the shorter ones. Technical indicators suggest the bright metal may fall further as both rotated south around their mid-lines, reflecting mounting selling pressure.
Support levels: 2,626.70 2,611.35 2,598.70
Resistance levels: 2,643.30 2,655.00 2,671.55
The US dollar came under selling pressure after economic calendar data indicated that the Federal Reserve’s preferred inflation measure would not be enough to prevent another cut in US interest rates in December. According to the announcement, the core Personal Consumption Expenditures (PCE) price index rose 0.27% in October, the largest monthly increase since March. However, the figure was slightly below expectations, which had pointed to 0.3%. Following the data results, financial markets are now betting on a 66% chance of a US interest rate cut by the Federal Reserve at the last meeting of 2024. According to Fed funds futures, up from a 63% chance on Tuesday.
These events coincide with the decline in the US dollar price ahead of today’s US holiday. According to the data results, the 12-month PCE price index rose to 2.8% from 2.7% in October (and 3.4% a year ago), indicating a recent rise in inflationary pressures and should be enough to ensure the Federal Reserve maintains a cautious stance on cutting US interest rates in the coming months. This will naturally limit the weakness of the US dollar. However, in the near term, the US dollar is retreating slightly.
Analysts at HSBC believe that “the decline in the US dollar is also likely to reflect some unwinding of pre-US Thanksgiving holiday positioning.” Also, investment bank analysts see the possibility of US dollar selling as month-end flows begin to dominate the action. These are flows created by portfolio managers who buy and sell currencies to rebalance their portfolios to account for the previous month’s forex market movements. In the same context, Deutsche Bank’s end-of-month model sees the possibility of US dollar weakness, noting that the moves that occurred after the elections in US assets have generated some large rebalancing signals on relative performance. Meanwhile, with demand for the EUR/USD pair and supply of the USD/SEK and USD/CHF pairs as the largest signals within their model.
Generally, the weakness of the US dollar was also expected from a technical perspective, as many analysts noted that the November rally seemed overextended and deserved a downward correction.
Overall, most analysts see USD strength as a feature of 2025. However, the pace of gains makes it look overvalued over shorter time frames, opening the door to a December setback.
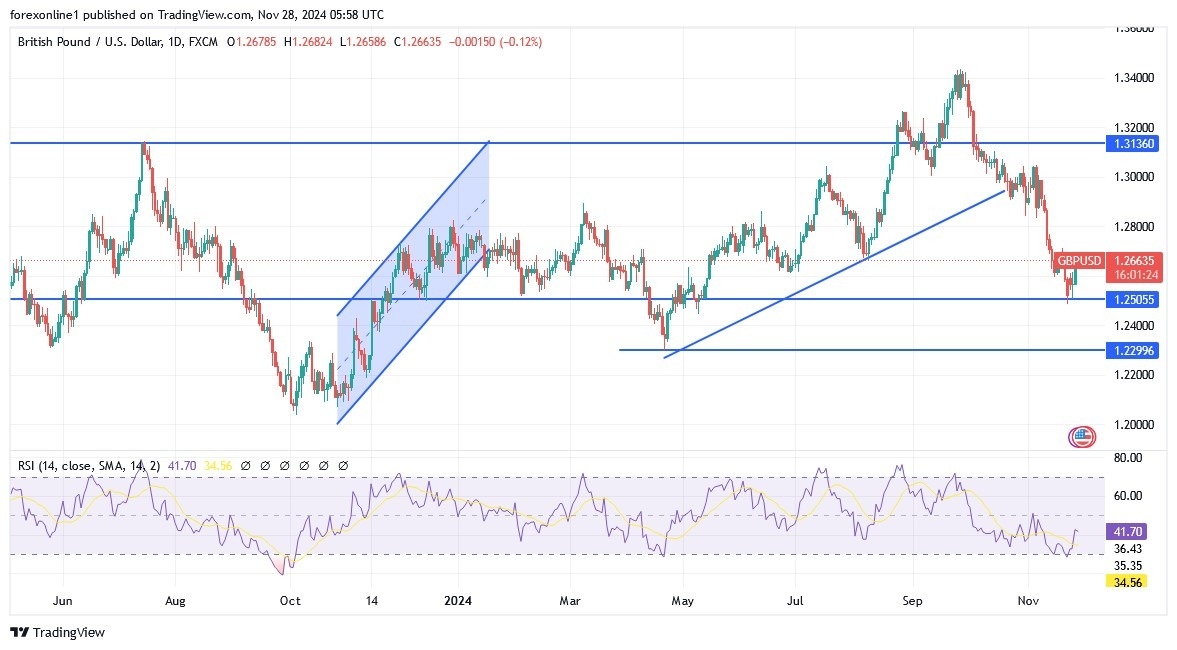
According to the performance on the daily chart above, the GBP/USD price is still at the beginning of forming an upward launch base, which means that the currency pair still lacks the strong momentum to start moving upward. Dear reader, you should take into account that the direction of the technical indicators has not turned upward yet. To start doing so, bulls should launch the GBP/USD currency pair towards the resistance levels of 1.2775 and then the psychological resistance of 1.3000 first. Otherwise, the general trend will remain bearish.
You should be cautious today as there is a holiday in the US markets, which may weaken liquidity amid traders staying away from trading screens.
Ready to trade our daily GBP/USD Forex analysis? Check out the best forex trading company in UK worth using.
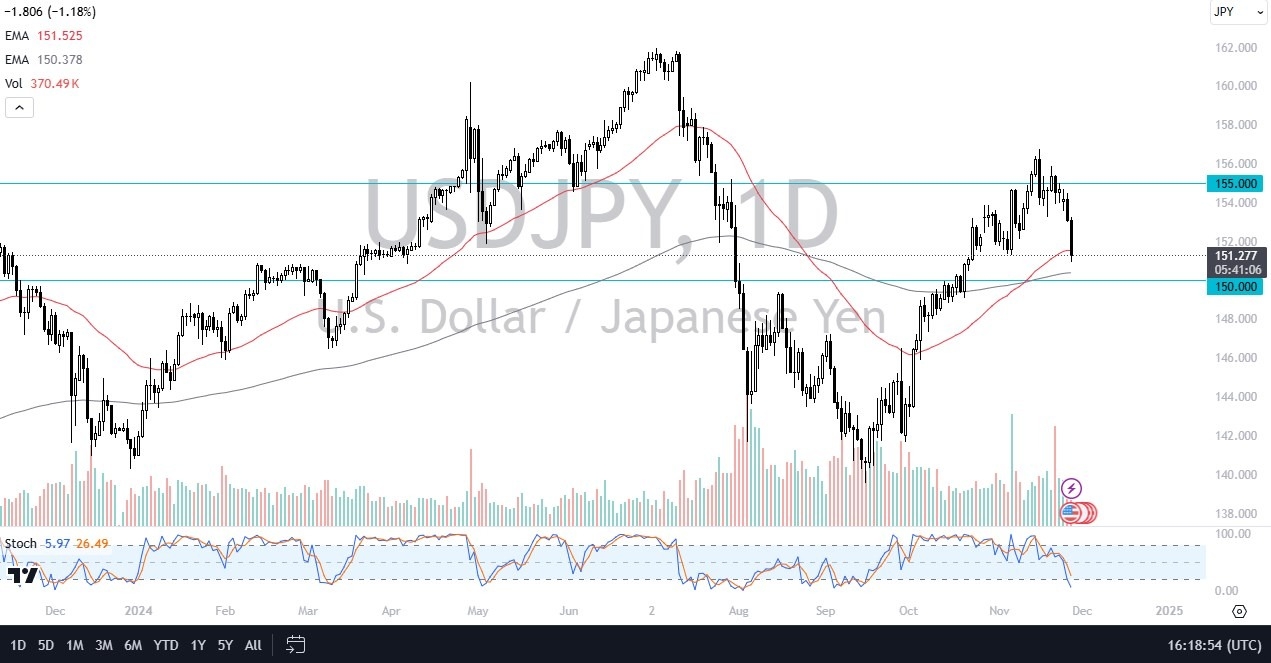
At this point, when I look at the dollar against the Japanese yen, the first thing I see is that the 150 yen level underneath is backed up by the 200 day EMA. So, I think we’re getting close to an area where value hunting will begin. I would need to see a drop and then a bounce from here, perhaps something like a hammer to start to think about buying again.
The interest rate differential does favor the US dollar and in the longer term, that should come into the picture and start moving the market. If we were to break down below the 148 yen level, that could change everything. But until then, I think we still have a situation where the US dollar probably continues to outperform the Japanese yen over the longer term.
That being said, it really was only about two months ago that we were at 140 yen. So, it’s not a big surprise to see this little bit of a pullback. I don’t know that it makes any difference for the trend. I think it’s a little early to call that, but when you look at a Fibonacci retracement from the entire move, the 150 yen level ties together with the 38.2% Fib. So, it’s possible that might be where people get interested again. This would be a great value, assuming that the overall trend will continue over the longer term.
Want to trade our USD/JPY forex analysis and predictions? Here’s a list of forex brokers in Japan to check out.