The main category of Forex News.
You can use the search box below to find what you need.
[wd_asp id=1]
The main category of Forex News.
You can use the search box below to find what you need.
[wd_asp id=1]
The Japanese Yen (JPY) buying remains uninterrupted on Wednesday, which, along with a modest US Dollar (USD) weakness, drags the USD/JPY pair below the 152.00 mark, or a three-week low during the early European session. Against the backdrop of geopolitical risks stemming from the protracted Russia-Ukraine war, concerns about US President-elect Donald Trump’s tariff plans turn out to be key factors driving flows towards the safe-haven JPY.
Furthermore, expectations that Trump’s US Treasury Secretary nominee, Scott Bessent will restrain budget deficits continue to drag the US Treasury bond yields lower. This, in turn, keeps the USD bulls on the defensive near the weekly low and offers additional support to the lower-yielding JPY. That said, the uncertainty over the Bank of Japan’s (BoJ) rate-hike plans could act as a headwind for the JPY ahead of Wednesday’s important US macro releases.
From a technical perspective, the overnight close below the 100-period Simple Moving Average (SMA) on the 4-hour chart and the subsequent downfall favors bearish traders. Moreover, oscillators on the daily chart have just started gaining negative traction and support prospects for a further USD/JPY depreciating move. Hence, some follow-through weakness towards the very important 200-day SMA, currently pegged around the 152.00 mark, looks like a distinct possibility. A convincing break below the latter could expose the monthly swing low, around the 151.30-151.25 region.
On the flip side, the 153.00 round figure might now act as an immediate hurdle ahead of the 153.25-153.30 region. A sustained strength beyond the latter might trigger a short-covering rally and allow the USD/JPY pair to reclaim the 154.00 mark. The upward trajectory could extend further towards the 154.60 intermediate hurdle en route to the 155.00 psychological mark and the next relevant hurdle near the 155.35-155.40 area.
The real Gross Domestic Product (GDP) Annualized, released quarterly by the US Bureau of Economic Analysis, measures the value of the final goods and services produced in the United States in a given period of time. Changes in GDP are the most popular indicator of the nation’s overall economic health. The data is expressed at an annualized rate, which means that the rate has been adjusted to reflect the amount GDP would have changed over a year’s time, had it continued to grow at that specific rate. Generally speaking, a high reading is seen as bullish for the US Dollar (USD), while a low reading is seen as bearish.
According to the minutes of the latest meeting of the US Federal Reserve, Fed officials indicated broad support for a cautious approach to future US interest rate cuts considering the strength of the US economy and declining inflation. The minutes stated, “Participants expected that if incoming data were consistent with their current assessments, with inflation continuing to move down sustainably toward 2% and the U.S. economy remaining near maximum employment, it would likely be appropriate to move gradually toward a more neutral policy stance over time.”
The US Federal Reserve cut its benchmark interest rate by a quarter of a percentage point at its meeting this month to a range of 4.5%-4.75%, following a larger-than-usual half-point cut in September. In the same month, Fed Chairman Jerome Powell stated that the US economy is not sending signals to policymakers that they need to rush to cut interest rates.
Meanwhile, US Federal Reserve officials will meet for their last policy meeting of the year 2024 on December 17 and 18.

Also, the minutes showed that some officials said the Fed could pause U.S. interest rate cuts and keep borrowing costs at a contained level if U.S. inflation remains high. Some officials have suggested that cuts could be accelerated if the economy or labour market deteriorates. Policymakers also cited the lack of clarity on the so-called neutral rate, a level of policy that neither restricts nor stimulates economic growth, as a reason for caution.
As for the U.S. labour market, U.S. monetary policymakers saw downside risks to employment and growth as “somewhat reduced.” Officials generally assessed that there was “no sign of rapid deterioration” in the U.S. labour market. On inflation, officials reported that price growth has slowed significantly from its peak but noted that the core measure, which excludes food and energy, remains “moderately elevated.”
You should expect inflation rates to increase during the Trump administration as his trade wars will inevitably result in higher inflation rates.
Investors remain cautious due to the ongoing economic gloom in Europe and growing concerns about the potential impact of the incoming Trump administration. Before taking office, Trump doubled down on his threats to impose tariffs, indicating a 10% increase in tariffs on China and a 25% increase on Mexico and Canada. At the same time, he also warned of imposing large tariffs on European goods, especially cars, claiming that the European Union “will pay a big price.”
As is well known, these threats increase the challenges facing Europe’s struggling manufacturing sector. Overall, this gloomy outlook has prompted investors to increase bets on aggressive monetary easing by the European Central Bank. While a 25-basis point interest rate cut next month is fully priced in, the probability of a larger 50 basis point cut has risen to 58%. These factors will continue to weigh on the performance of the euro.
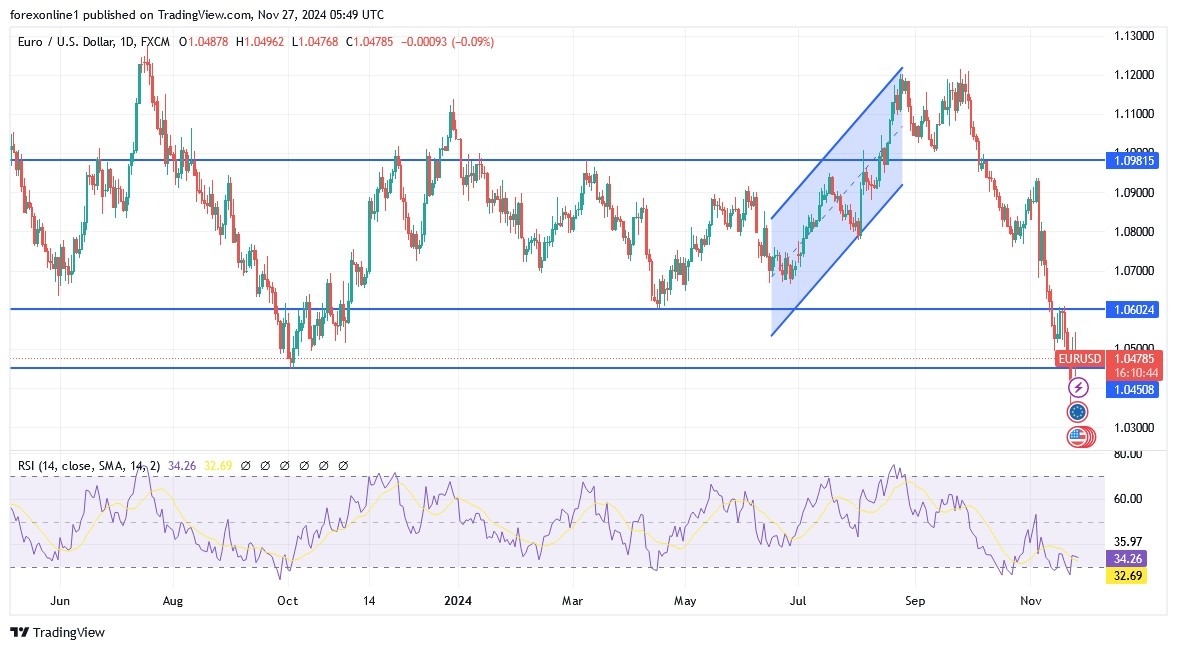
There is no change in our technical view of the performance of the euro against the US dollar EUR/USD. Technically, the general trend remains bearish and the expectations for the future parity rate of the most popular currency pair in the forex market are increasing and closer than before. The implementation of Trump’s threats and global geopolitical tensions, in addition to the worsening economic and political situation in Germany, will remain valid factors for further collapse of the Euro Dollar price in the coming months. Currently, the closest support levels for the Euro Dollar are 1.0400, 1.0335 and 1.0200, respectively, which are sufficient to push all technical indicators towards strong oversold levels.
Today, the Euro Dollar pair will be affected by the announcement of a package of important US economic data before tomorrow’s holiday, the most prominent of which are the US GDP growth reading, the number of weekly jobless claims, and US durable goods orders, in addition to the US Federal Reserve’s preferred inflation reading.
In the above-mentioned narrative, we recommend selling the Euro Dollar currency pair EUR/USD from every upward level.
Ready to trade our daily EUR/USD Forex analysis? We’ve made a list of the best forex demo accounts worth trading with.
The 1.23 handle is an area that I think a lot of people will be watching very closely. Market participants continue to see that area as previous resistance, now likely to offer support, as it even did once during the latter part of April this year.
On a rally, it’s really not until we break above the 1.27 level that I think things start to change. All things being equal, GBP/USD is a market that looks like it’s consolidating and trying to figure out where the bottom is, in an environment that continues to see the US Dollar destroy almost everything it touches.
There are a lot of reasons for the US Dollar to go higher, not the least of which is its safety play with geopolitics taking front and center stage. Yes, we’ve had these rallies, and the Lebanese agreed to a ceasefire, but we still have the issue in Ukraine. Furthermore, we have higher interest rates in America, and it looks like the pro-business administration that’s coming in will bring in more investment.
So, it’s a matter of people wanting to be involved in the US economy more than anything else at the moment. The interest rate differential between the two economies or currencies really isn’t much to speak of, so I think a lot of this just comes down to how dominant the US Dollar is against almost everything. Watch that 1.25 level. Watch the 1.27 level.
Ready to trade our daily GBP/USD Forex forecast? Here’s some of the best forex broker UK reviews to check out.
Silver price (XAG/USD) exhibits indecisiveness near $30.50 in Wednesday’s European session, with investors focusing on the United States (US) Personal Consumption Expenditure Price Index (PCE) data for October, which will be published at 15:00 GMT.
Investors await the US PCE inflation data to get more insights about the Federal Reserve’s (Fed) interest rate action in the December meeting. The possibility for the Fed to cut interest rates by 25 basis points (bps) to 4.25%-4.50% next month has increased to 66% from 56% a week ago, according to the CME FedWatch tool.
Investors will pay close attention to the core PCE inflation data – which excludes volatile food and energy prices – as it is the Fed’s preferred inflation gauge. Economists expect the annual core PCE inflation to have accelerated to 2.8% from 2.7% in September, with monthly figures growing steadily by 0.3%.
The Silver price remains well-supported above $30.00 from the past two trading sessions amid a correction in the US Dollar (USD). The US Dollar Index (DXY), which tracks the Greenback’s value against six major currencies, posts a fresh weekly low near 106.50.
However, the bias towards the Silver price remains downbeat as its safe-haven demand has diminished on initiation of a ceasefire between Israel and Iran.
It began at 02:00 GMT on Wednesday, putting an at least temporary end to nearly 14 months of conflict between Israel and the Iran-backed militant group, according to BBC News.
Silver price resumes its declining trend after a mean-reversion move to near the 20-day Exponential Moving Average (EMA) around $31.40. The white metal is expected to retreat to the November 14 low of around $29.70. The white metal weakened after the breakdown of the horizontal support plotted from the May 21 high of $32.50.
The upward-sloping trendline from the February 29 low of $22.30 will act as key support for the Silver price around $29.50.
The 14-day Relative Strength Index (RSI) oscillates in the 40.00-60.00 range, suggesting a sideways trend.
Silver is a precious metal highly traded among investors. It has been historically used as a store of value and a medium of exchange. Although less popular than Gold, traders may turn to Silver to diversify their investment portfolio, for its intrinsic value or as a potential hedge during high-inflation periods. Investors can buy physical Silver, in coins or in bars, or trade it through vehicles such as Exchange Traded Funds, which track its price on international markets.
Silver prices can move due to a wide range of factors. Geopolitical instability or fears of a deep recession can make Silver price escalate due to its safe-haven status, although to a lesser extent than Gold’s. As a yieldless asset, Silver tends to rise with lower interest rates. Its moves also depend on how the US Dollar (USD) behaves as the asset is priced in dollars (XAG/USD). A strong Dollar tends to keep the price of Silver at bay, whereas a weaker Dollar is likely to propel prices up. Other factors such as investment demand, mining supply – Silver is much more abundant than Gold – and recycling rates can also affect prices.
Silver is widely used in industry, particularly in sectors such as electronics or solar energy, as it has one of the highest electric conductivity of all metals – more than Copper and Gold. A surge in demand can increase prices, while a decline tends to lower them. Dynamics in the US, Chinese and Indian economies can also contribute to price swings: for the US and particularly China, their big industrial sectors use Silver in various processes; in India, consumers’ demand for the precious metal for jewellery also plays a key role in setting prices.
Silver prices tend to follow Gold’s moves. When Gold prices rise, Silver typically follows suit, as their status as safe-haven assets is similar. The Gold/Silver ratio, which shows the number of ounces of Silver needed to equal the value of one ounce of Gold, may help to determine the relative valuation between both metals. Some investors may consider a high ratio as an indicator that Silver is undervalued, or Gold is overvalued. On the contrary, a low ratio might suggest that Gold is undervalued relative to Silver.
The USD/JPY price analysis shows a strengthening yen amid safe-haven demand and increasing Bank of Japan rate cut expectations. Meanwhile, the dollar paused its rally as market participants awaited key reports including inflation, unemployment claims, and GDP.
–Are you interested to learn more about forex options trading? Check our detailed guide-
The yen rallied on Tuesday and Wednesday as traders sought safety after Trump’s tariff vows raised fears of trade wars. The US president-elect promised to impose a 25% tariff on goods from Mexico, Canada and China. This news reduced risk appetite and boosted safe-haven currencies like the yen. Tariffs will significantly hurt major economies like China and Canada, impacting the global economy.
On the other hand, the dollar rallied at the prospects of stronger economic performance. Tariffs imposed on imported goods will increase demand for local goods and boost the economy. However, by Wednesday, the rally paused as market focus shifted to looming US economic data.
Elsewhere, data revealed that Japan’s services producer price index increased by 2.9% in October after a 2.8% rise in the previous month. Higher inflation increases the likelihood that the Bank of Japan will hike rates in December, lifting the yen.
Meanwhile, the US will release reports on GDP, unemployment claims, and inflation. Economists expect the economy to expand by 2.8%, holding from the previous reading. Meanwhile, the core PCE price index might increase by 0.3% as it did in the previous month. Upbeat economic data will lower the likelihood of a December rate cut, boosting the dollar. On the other hand, downbeat data will solidify rate-cut expectations.
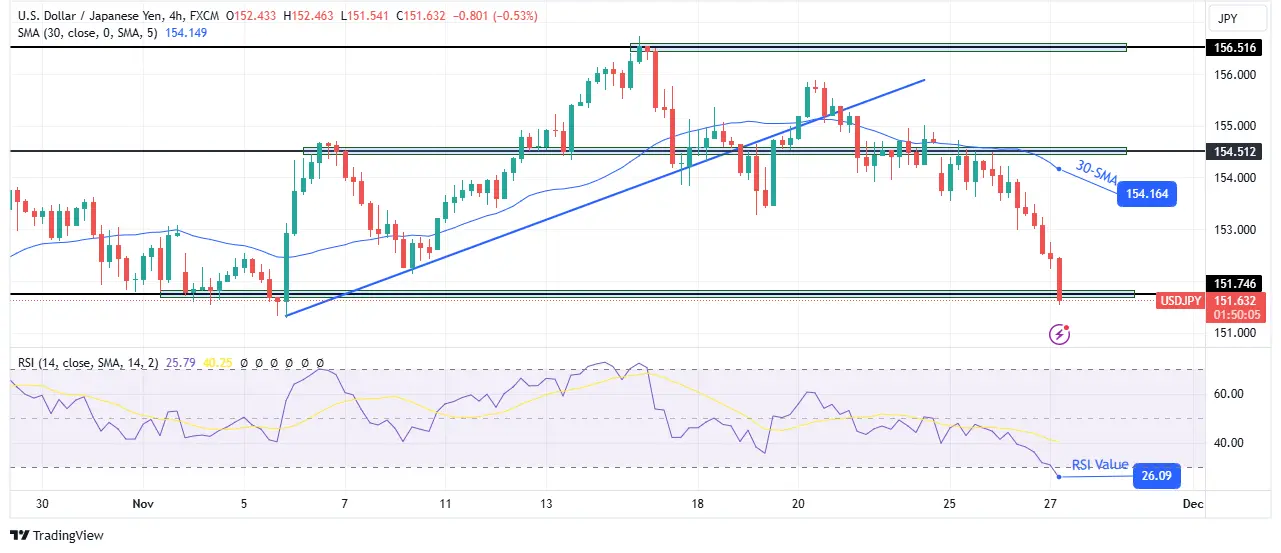
On the technical side, the USD/JPY price is on the verge of breaking below the 151.74 support level. The price has fallen sharply after detaching from the 154.51 key level. It trades well below the 30-SMA, indicating a steep decline. Meanwhile, the RSI has dipped into the oversold region, showing solid bearish momentum.
–Are you interested in learning more about scalping forex brokers? Check our detailed guide-
If the price closes well below the 151.74 level, the decline will continue to the next support level. On the other hand, if USD/JPY fails to breach the support, it might pull back to retest the 30-SMA before making another attempt.
Looking to trade forex now? Invest at eToro!
67% of retail investor accounts lose money when trading CFDs with this provider. You should consider whether you can afford to take the high risk of losing your money.
EUR/USD failed to make a decisive move in either direction on Tuesday and closed the day virtually unchanged slightly below 1.0500. The pair moves sideways in a narrow channel early Wednesday as investors await macroeconomic data releases from the US.
The table below shows the percentage change of Euro (EUR) against listed major currencies this week. Euro was the strongest against the Australian Dollar.
| USD | EUR | GBP | JPY | CAD | AUD | NZD | CHF | |
|---|---|---|---|---|---|---|---|---|
| USD | -0.77% | -0.47% | -1.40% | 0.72% | 0.25% | -0.42% | -0.81% | |
| EUR | 0.77% | 0.13% | -1.23% | 0.89% | 0.95% | -0.23% | -0.62% | |
| GBP | 0.47% | -0.13% | -1.34% | 0.76% | 0.81% | -0.36% | -0.76% | |
| JPY | 1.40% | 1.23% | 1.34% | 2.15% | 2.10% | 1.05% | 0.78% | |
| CAD | -0.72% | -0.89% | -0.76% | -2.15% | -0.32% | -1.11% | -1.54% | |
| AUD | -0.25% | -0.95% | -0.81% | -2.10% | 0.32% | -1.16% | -1.55% | |
| NZD | 0.42% | 0.23% | 0.36% | -1.05% | 1.11% | 1.16% | -0.40% | |
| CHF | 0.81% | 0.62% | 0.76% | -0.78% | 1.54% | 1.55% | 0.40% |
The heat map shows percentage changes of major currencies against each other. The base currency is picked from the left column, while the quote currency is picked from the top row. For example, if you pick the Euro from the left column and move along the horizontal line to the US Dollar, the percentage change displayed in the box will represent EUR (base)/USD (quote).
After dipping below 1.0450 on Tuesday, EUR/USD recovered its losses in the American session as the mixed data from the US and the modest improvement seen in risk mood made it difficult for the US Dollar (USD) to find demand.
Later in the day, the US Bureau of Economic Analysis will publish its second estimate of the annualized Gross Domestic Product (GDP) growth for the third quarter and release the Personal Consumption Expenditures (PCE) Price Index data, the Federal Reserve’s (Fed) preferred gauge of inflation, for October.
Investors expect the core PCE Price Index to rise 0.3% on a monthly basis to match September’s increase. A reading at or above the market expectation could support the USD with the immediate reaction. On the other hand, a print below analysts’ estimate could weigh on the USD and help EUR/USD push higher.
Ahead of the Thanksgiving holiday, the US economic calendar will feature other important data releases as well, making it difficult for market participants to assess the impact of these data on the USD’s valuation. The US Department of Labor will publish the weekly Initial Jobless Claims alongside the US Census Bureau’s Durable Goods Orders figures for October.
EUR/USD faces first resistance at 1.0520, where the upper limit of the descending regression channel meets the 50-period Simple Moving Average (SMA). In case the pair rises above this level and starts using it as support, 1.0570 (static level) could be seen as next hurdle before 1.0600 (100-period SMA).
On the downside, immediate support is located at 1.0480 (20-period SMA) ahead of 1.0430 (mid-point of the descending channel) and 1.0400 (static level).
The Euro is the currency for the 19 European Union countries that belong to the Eurozone. It is the second most heavily traded currency in the world behind the US Dollar. In 2022, it accounted for 31% of all foreign exchange transactions, with an average daily turnover of over $2.2 trillion a day. EUR/USD is the most heavily traded currency pair in the world, accounting for an estimated 30% off all transactions, followed by EUR/JPY (4%), EUR/GBP (3%) and EUR/AUD (2%).
The European Central Bank (ECB) in Frankfurt, Germany, is the reserve bank for the Eurozone. The ECB sets interest rates and manages monetary policy. The ECB’s primary mandate is to maintain price stability, which means either controlling inflation or stimulating growth. Its primary tool is the raising or lowering of interest rates. Relatively high interest rates – or the expectation of higher rates – will usually benefit the Euro and vice versa. The ECB Governing Council makes monetary policy decisions at meetings held eight times a year. Decisions are made by heads of the Eurozone national banks and six permanent members, including the President of the ECB, Christine Lagarde.
Eurozone inflation data, measured by the Harmonized Index of Consumer Prices (HICP), is an important econometric for the Euro. If inflation rises more than expected, especially if above the ECB’s 2% target, it obliges the ECB to raise interest rates to bring it back under control. Relatively high interest rates compared to its counterparts will usually benefit the Euro, as it makes the region more attractive as a place for global investors to park their money.
Data releases gauge the health of the economy and can impact on the Euro. Indicators such as GDP, Manufacturing and Services PMIs, employment, and consumer sentiment surveys can all influence the direction of the single currency. A strong economy is good for the Euro. Not only does it attract more foreign investment but it may encourage the ECB to put up interest rates, which will directly strengthen the Euro. Otherwise, if economic data is weak, the Euro is likely to fall. Economic data for the four largest economies in the euro area (Germany, France, Italy and Spain) are especially significant, as they account for 75% of the Eurozone’s economy.
Another significant data release for the Euro is the Trade Balance. This indicator measures the difference between what a country earns from its exports and what it spends on imports over a given period. If a country produces highly sought after exports then its currency will gain in value purely from the extra demand created from foreign buyers seeking to purchase these goods. Therefore, a positive net Trade Balance strengthens a currency and vice versa for a negative balance.
EUR/JPY extends its losses for the second consecutive day, trading around 159.60 during the Asian hours on Wednesday. Technical analysis of the daily chart shows the pair is moving downwards within the descending channel pattern, suggesting an ongoing bearish bias.
Additionally, the 14-day Relative Strength Index (RSI) is positioned slightly below the 30 level, confirming the bearish sentiment for the EUR/JPY cross. A dip below the 30 mark would indicate an oversold situation and direct a corrective rebound.
In terms of support, the EUR/JPY cross may find primary support at the lower boundary of the descending channel around the psychological level of 159.00, followed by a two-month low of 158.10, recorded on September 30. A break below this level could strengthen the bearish sentiment and put downward pressure on the currency cross to navigate the area around its 11-month low of 154.41, which was recorded in December 2023.
On the upside, the EUR/JPY cross may approach to test the upper boundary of the descending channel near the nine-day Exponential Moving Average (EMA) at the 161.80 level, followed by the 14-day EMA at 162.43. A decisive breach above these levels would cause the emergence of the momentum shift from bearish to bullish and support the pair to re-test a four-month high of 166.69, a level last seen on October 31.
The table below shows the percentage change of Euro (EUR) against listed major currencies today. Euro was the weakest against the New Zealand Dollar.
| USD | EUR | GBP | JPY | CAD | AUD | NZD | CHF | |
|---|---|---|---|---|---|---|---|---|
| USD | 0.02% | -0.10% | -0.46% | 0.05% | -0.21% | -0.61% | -0.14% | |
| EUR | -0.02% | -0.13% | -0.46% | 0.02% | -0.24% | -0.64% | -0.14% | |
| GBP | 0.10% | 0.13% | -0.36% | 0.15% | -0.11% | -0.50% | -0.04% | |
| JPY | 0.46% | 0.46% | 0.36% | 0.49% | 0.23% | -0.17% | 0.31% | |
| CAD | -0.05% | -0.02% | -0.15% | -0.49% | -0.26% | -0.68% | -0.18% | |
| AUD | 0.21% | 0.24% | 0.11% | -0.23% | 0.26% | -0.40% | 0.09% | |
| NZD | 0.61% | 0.64% | 0.50% | 0.17% | 0.68% | 0.40% | 0.47% | |
| CHF | 0.14% | 0.14% | 0.04% | -0.31% | 0.18% | -0.09% | -0.47% |
The heat map shows percentage changes of major currencies against each other. The base currency is picked from the left column, while the quote currency is picked from the top row. For example, if you pick the Euro from the left column and move along the horizontal line to the US Dollar, the percentage change displayed in the box will represent EUR (base)/USD (quote).
Gold price stays on the front foot in Asian trading on Wednesday, looking to extend the previous recovery from six-day lows of $2,605. Traders gear up for a slew of top-tier US economic data releases heading into the Thanksgiving holiday season.
Early Wednesday, the persistent weakness surrounding the US Dollar (USD) and the US Treasury bond yields offset easing geopolitical tensions between Israel and Lebanon, allowing Gold buyers to come up for air for the second day.
The sentiment around the US Dollar remains undermined following US President-elect Donald Trump’s selection of Scott Bessent as Treasury Secretary. Bessent, a fiscal conservative, assured the US bond markets, spelling doom for the US Treasury bond yields and eventually for the USD.
A ceasefire between Israel and Lebanon helped reduce the haven demand for the Greenback, exerting additional downward pressure even though the Minutes of the US Federal Reserve (Fed )November meeting showed that officials were divided on further rate cuts.
Reuters reported, “a ceasefire between Israel and Iran-backed group Hezbollah came into effect at 0200 GMT on Wednesday after U.S. President Joe Biden said both sides accepted an agreement brokered by the United States and France.”
Meanwhile, markets continue to price in over 60% probability of the Fed lowering interest rates by 25 bps next month, according to the CME Group’s FedWatch Tool, despite a less dovish Fed Minutes.
Therefore, the Gold price remains supported amid sustained dovish Fed expectations and uncertainty surrounding global trade prospects during Donald Trump’s presidency. This is especially true after he announced 25% tariffs on goods imported from the US into Canada and Mexico on Tuesday. At the same time, he slapped 10% additional tariffs on US imports into China.
Hong Kong Census and Statistics Department data showed on Tuesday that China’s net gold imports via Hong Kong in October fell from September and were down 43% from the previous year. Traders digest the data as attention turns toward the upcoming US macro news, with the Core Personal Consumption Expenditure (PCE) Price Index in focus.
The Fed’s preferred inflation gauge and the weekly Jobless Claims will help shape market expectations for future Fed rate cuts, impacting the USD and the non-interest-bearing Gold price. The core PCE Price Index is rising 2.8% YoY in October versus September’s rise of 2.7%. Meanwhile, the headline annual PCE inflation is expected to advance to 2.3% in the same period from 2.1% in September.
Hotter-than-expected US inflation data could raise further doubts about the Fed’s rate cut trajectory, reinforcing selling pressure around the Gold price.
The 21-day SMA crossed the 50-day SMA from above on a daily closing basis on Tuesday, confirming a Bear Cross.
Adding credence to the downside potential, the 14-day Relative Strength Index (RSI) remains below the 50 level, currently near 47.
Therefore, any upside attempts in Gold price could likely be sold into unless buyers find acceptance above the 21-day SMA and 50-day SMA crossover near $2,660.
The next topside barriers are at the $2,700 level and Monday’s high of $2,721.
Alternatively, the immediate support is at the previous day’s low of $2,605, below which a drop toward the 100-day SMA at $2,569 remains in the offing.
A sustained break below that level could challenge the November 14 low of $2,537.
The Core Personal Consumption Expenditures (PCE), released by the US Bureau of Economic Analysis on a monthly basis, measures the changes in the prices of goods and services purchased by consumers in the United States (US). The PCE Price Index is also the Federal Reserve’s (Fed) preferred gauge of inflation. The YoY reading compares the prices of goods in the reference month to the same month a year earlier. The core reading excludes the so-called more volatile food and energy components to give a more accurate measurement of price pressures.” Generally, a high reading is bullish for the US Dollar (USD), while a low reading is bearish.
Silver price (XAG/USD) remains steady near $30.50 per troy ounce during the Asian hours on Wednesday. The daily chart analysis suggests a possible shift in momentum from bearish to bullish as the pair has been tracking down along the upper boundary of the descending channel pattern.
However, the 14-day Relative Strength Index (RSI) is currently positioned below the 50 level, indicating a prevailing bearish sentiment. Additionally, the XAG/USD pair remains below the 14- and nine-day Exponential Moving Averages (EMA), signaling a bearish outlook and indicating weakening short-term price momentum. This suggests weak buying interest and the potential for further price losses.
In terms of the upside, if the Silver price successfully breaches the key resistance zone near the upper boundary of the descending channel, the asset price would further test the nine-day Exponential Moving Average (EMA) at $30.76, followed by the 14-day EMA at $30.96.
On the downside, the Silver price may find support around its “throwback support” at the psychological level of $30.00. A break below this level could deepen bearish sentiment, potentially driving the price lower toward its three-month low of $27.69, followed by the descending channel’s lower boundary at $28.50.
Silver is a precious metal highly traded among investors. It has been historically used as a store of value and a medium of exchange. Although less popular than Gold, traders may turn to Silver to diversify their investment portfolio, for its intrinsic value or as a potential hedge during high-inflation periods. Investors can buy physical Silver, in coins or in bars, or trade it through vehicles such as Exchange Traded Funds, which track its price on international markets.
Silver prices can move due to a wide range of factors. Geopolitical instability or fears of a deep recession can make Silver price escalate due to its safe-haven status, although to a lesser extent than Gold’s. As a yieldless asset, Silver tends to rise with lower interest rates. Its moves also depend on how the US Dollar (USD) behaves as the asset is priced in dollars (XAG/USD). A strong Dollar tends to keep the price of Silver at bay, whereas a weaker Dollar is likely to propel prices up. Other factors such as investment demand, mining supply – Silver is much more abundant than Gold – and recycling rates can also affect prices.
Silver is widely used in industry, particularly in sectors such as electronics or solar energy, as it has one of the highest electric conductivity of all metals – more than Copper and Gold. A surge in demand can increase prices, while a decline tends to lower them. Dynamics in the US, Chinese and Indian economies can also contribute to price swings: for the US and particularly China, their big industrial sectors use Silver in various processes; in India, consumers’ demand for the precious metal for jewellery also plays a key role in setting prices.
Silver prices tend to follow Gold’s moves. When Gold prices rise, Silver typically follows suit, as their status as safe-haven assets is similar. The Gold/Silver ratio, which shows the number of ounces of Silver needed to equal the value of one ounce of Gold, may help to determine the relative valuation between both metals. Some investors may consider a high ratio as an indicator that Silver is undervalued, or Gold is overvalued. On the contrary, a low ratio might suggest that Gold is undervalued relative to Silver.
EUR/GBP is clawing its way back up within its multi-week range. It is possible that this may be the start of an up leg within the range towards the ceiling at around 0.8450.
The pair is probably in a sideways trend on a short-term basis and given the principle of technical analysis that prices are more likely to extend in the direction in which they are trending it will probably continue oscillating in its sideways trend until it makes a decisive breakout either higher or lower. It is overall at two and a half year lows.
EUR/GBP made a false break lower on November 8 and then, a second time, on an intraday basis, on November 22. On both occasions it failed to follow-through lower, however, and instead just recovered back inside the range.
Because it is in a sideways trend the odds favor a continuation sideways, which suggests the possibility of a recovery from the current level up to ceiling.
A break above 0.8375 would probably lead to a continuation higher to a target at 0.8440, just below the ceiling.
The Moving Average Convergence Divergence (MACD) momentum indicator, which is a reliablñe indicator in sideways markets has crossed above its red signal line and is also now above the zero line suggesting a bullish short-term bias.