The main category of Forex News.
You can use the search box below to find what you need.
[wd_asp id=1]
The main category of Forex News.
You can use the search box below to find what you need.
[wd_asp id=1]
A decisive decline below the bottom of the pattern at 66.86 may lead to a quick bullish reversal, as has been seen in the last two new swing lows, one in November and one in October. Or a decline to the September swing low of 65.65 tests support and the bottom of a downtrend price structure. That swing low was the lowest traded price for crude oil since early-May 2023. The May 2023 swing low of 63.67 anchors the next lower potential support zone along with the long-term downtrend line. The trendline begins from the 2008 peak of 147.08.
Last week’s lower swing high provides a new resistance level to consider for signs of strength. The top of the box is 73.27. However, last week’s high of 72.79 establishes a key lower pivot level as a rise above it would break a short-term pattern of lower swing highs and lower swing lows. In addition, crude would already have shown strength by reclaiming both the 20-Day and 50-Day MAs by then.
If the 71.79 price level can be reclaimed, and it is followed by further strength, the chance to break out through the top of the box improves. Given that trading continues below resistance at the bottom boundary line of the symmetrical triangle pattern, the 61.8% retracement level at 74.60 may be reached before encountering signs of resistance around the line.
If crude can reclaim the recent swing high, it will provide one signal for a bullish reversal. The bullish reversal would then be further confirmed on a rise above the 73.15 swing high, which is also the top of recent consolidation. If that happens then there is a possibility that demand will rise enough to improve the chance of rising above the bottom boundary line resistance. That could lead to a completion of a 78.6% retracement at 76.58, and possibly the 200-Day MA at 77.18.
For a look at all of today’s economic events, check out our economic calendar.
Spot Gold trades uneventfully on Tuesday, confined to a tight range just below $2,630 a troy ounce. The market sentiment soured at the beginning of the day following comments from United States (US) President-elect Donald Trump. Trump threatened to impose tariffs of up to 25% on all products entering from Canada and Mexico and an additional 10% tariff on goods from China in posts on his Truth Social site.
Demand for safe-haven assets remained subdued throughout the first half of the day despite the dismal mood, keeping XAU/USD ranging. Wall Street’s opening, however, brought a fresh bout of US Dollar buying.
US data was mixed. On the one hand, the CB Consumer Confidence Index rose in November to 111.7, slightly below the 111.8 expected, while improving from 109.6 in October. The Present Situation Index increased to 140.9, while the Expectations Index ticked up to 92.3, well above the threshold of 80 that usually signals a recession ahead. New Home Sales, however, fell 17.3% in October, while the November Richmond Fed Manufacturing Index printed at -14, matching the previous reading and worse than the -10 anticipated by market players.
Wednesday will be a pretty busy day, as US markets will be closed on Thursday amid the Thanksgiving Holiday. The country will publish the Personal Consumption Expenditures (PCE) Price Index, the Federal Reserve (Fed) favorite inflation gauge, a revision of the Q3 Gross Domestic Product (GDP) and weekly employment figures, among other minor reports.
The daily chart for the XAU/USD pair shows it hovers around its daily opening, with the risk still skewed to the downside. The pair posted a lower high and a lower low, while a bearish 20 Simple Moving Average (SMA) keeps heading south, providing dynamic resistance at around $2,662.00. Technical indicators, in the meantime, post uneven advances within negative levels, suggesting limited buying interest. Finally, a bullish 100 SMA keeps providing support at around $2,565.70.
In the near term, and according to the 4-hour chart, XAU/USD is bearish. The pair develops below all its moving averages, with the 20 and 100 SMAs gaining downward traction. Finally, technical indicators resumed their slides within negative levels, in line with another leg south.
Support levels: 2,611.35 2,598.70 2,587.20
Resistance levels: 2,640.40 2,655.00 2,671.55
Today’s advance won’t mean much unless it leads to a breakout above last week’s high of 3.56. If that can trigger, then natural gas heads next towards the 2023 swing high of 3.64. Subsequently, if it can keep rising, it heads towards the completion of an 127.2% extended target for a large rising ABCD pattern (orange) at 2.67. Higher targets can be considered if the 2023 peak is exceeded.
A parallel line has been added to the top of the near-term rising trend channel by anchoring with the October 30 swing high. It is interesting to note that last week’s high found resistance just below that top parallel trendline. Nonetheless, the next higher target zone is anchored by the 3.64 peak and includes two pattern extension targets with a high of 3.67. Interestingly, natural gas could rally to that target zone yet stay contained below the top channel line.
Regardless of the above bullish scenario, Friday’s bearish engulfing day indicates caution is warranted. In other words, patterns within the parameters of Friday’s range may have difficulty following through as they might in a different trading environment. Conditions may be like what is seen within a consolidation price range. Friday’s price range included support at 3.07 up to resistance at 3.56.
A decline below today’s low of 3.39 would be a sign of weakness that could lead to lower prices. It is followed by Monday’s low of 3.26. Falling below Monday’s low would trigger a failure of today’s upside breakout from an inside day. It is not uncommon to see a pickup in momentum in response to false moves, which could easily lead to a test of yesterday’s low or a drop through it to either 3.02 or 2.93.
For a look at all of today’s economic events, check out our economic calendar.
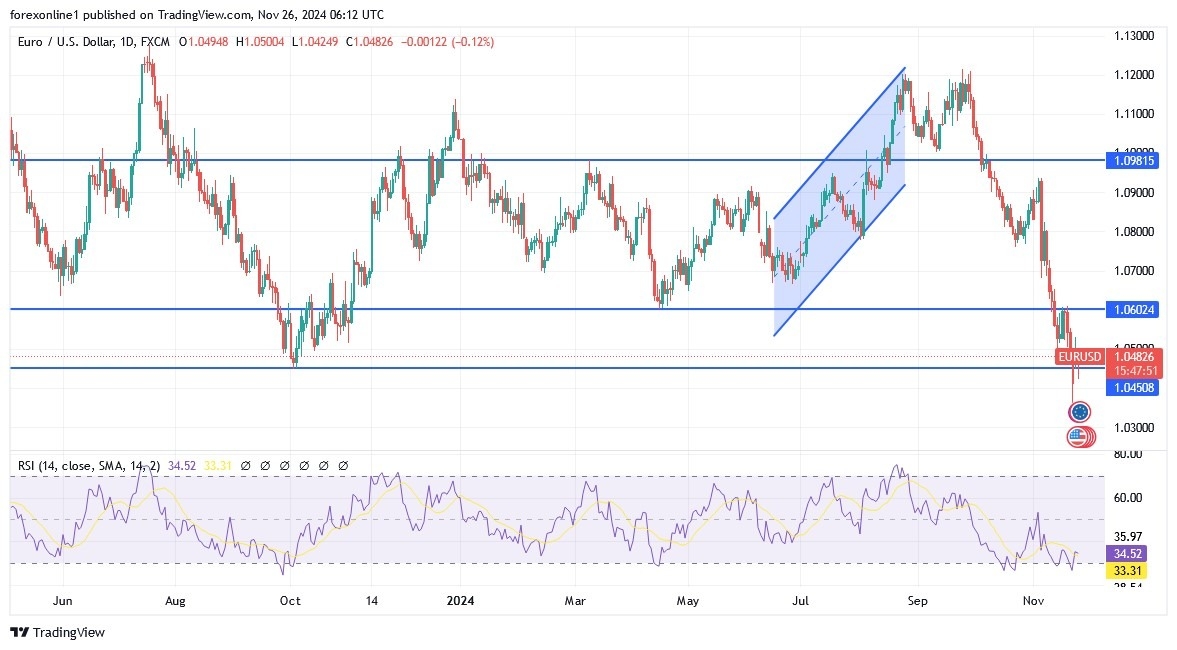
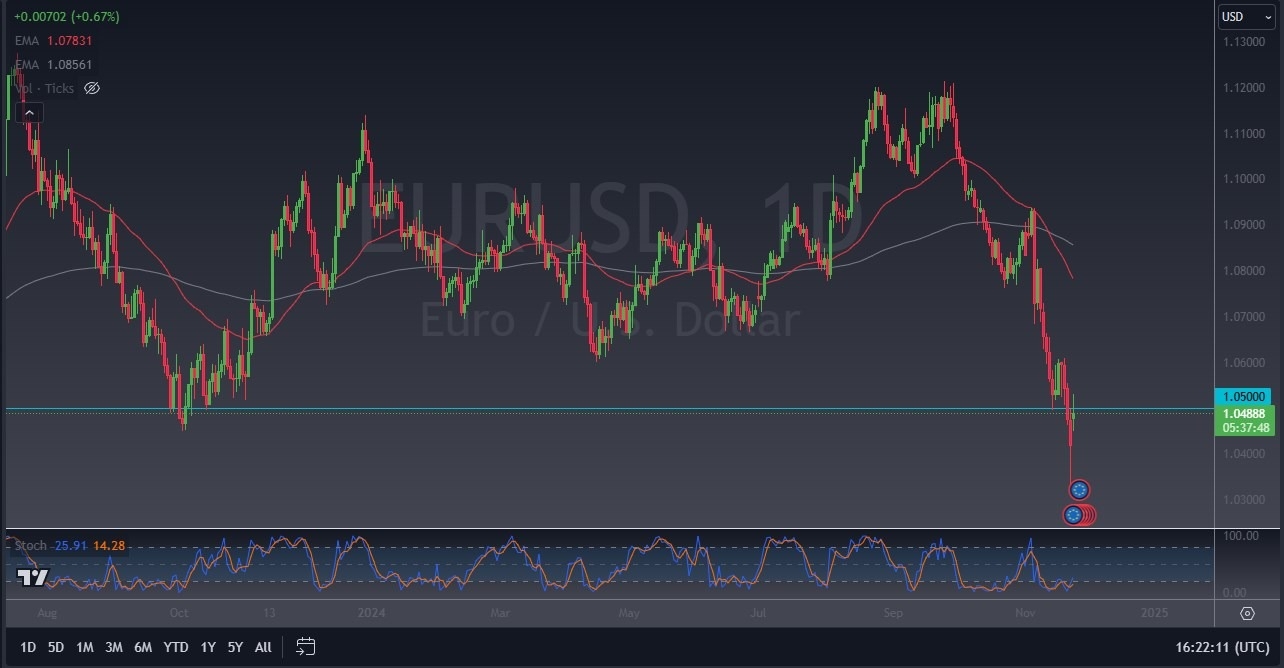
So far, most technical and momentum indicators are still clear in expecting further decline in the performance of the EUR/USD pair. Accordingly you should expect more weakness. Subsequently, if the selling wave returns, the lowest support levels recorded by the currency pair in recent trading sessions at 1.0331, the lowest for the currency pair in two years, will be retested, followed by a test of the support level at 1.02. However, tactically, there is room for some strength in the coming days with a correction of the recent excessive selling levels. The relative improvement in the performance of the currency pair came after the announcement of the candidate for the position of US Treasury Secretary, which gave some optimism to investors and markets.

According to forex market trading, the euro price was affected by economic data that showed that the German Ifo business climate index fell from 86.5 in October to 85.7 in November, weaker than the expected reading of 86.0. In the same announcement, the current conditions index fell from 85.7 to 84.3 and the expectations index fell from 87.3 to 87.2. Overall, the reading confirms that the German economy is still in recession. Therefore, the outlook for next year 2025 is also weak as the loss of competitiveness in industry. Moreover, the adverse demographic structure is likely to offset any boost from recovery in real household incomes and monetary easing.
Concurrently, the BCI index is consistent with a sharp contraction in German GDP, as is last week’s November Purchasing Managers’ Index survey. Also, the composite Purchasing Managers’ Index fell further into recession territory in November. The next major release will be eurozone inflation figures, which could determine whether the European Central Bank (ECB) will cut interest rates by a large 50 basis points in its interest rate decision next month.
According to this week’s economic calendar, forex traders will be focusing on the official German inflation figures next Thursday. Similarly, Spain releases inflation figures on the same day. As is well known, the German and Spanish releases often serve as a good guide to where the Eurozone inflation release – due on Friday – will fall and because of this, the impact on the Euro could be significant if there are any surprise deviations from expectations.
Meanwhile, Eurozone inflation is forecast to rise to 2.4% from 2.0% in October, which would ensure the ECB sticks to a 25-basis point cut next month. However, if inflation data comes in lower than expected, the ECB may consider cutting interest rates by a larger amount, especially in light of last week’s disappointing PMI data. If so, the euro could come under pressure against other major currencies, especially the US dollar.
The US dollar continued to make further gains against other major currencies. Optimism was dampened by the name of the new US Treasury Secretary. Furthermore, Trump promised that he would impose an additional 10% tariff on goods from China. Comparably, he pledged to impose 25% tariffs on all products from Mexico and Canada, which led to a decline in their currencies by about 1% each. Simultaneously, the US dollar index DXY returned to stability above the 107.00 resistance, near its highest level in two years.
In general, risk sentiment is now collapsing due to the risks of Trump’s tariffs – the dollar is seen as a safe haven. According to reliable trading platforms, the US dollar recorded gains today against all currencies except the Japanese yen in Asian trading. In the same performance, the 10-year Treasury yield rose by 2 basis points to 4.29% after declining by 13 basis points in the last session.
Technically, the overall trend of the EUR/USD currency pair remains downward. As we previously advised, dear reader, you should expect any gains for the EUR/USD currency pair to evaporate quickly and the expectations of the EUR/USD parity become stronger. Currently, the closest support levels are 1.0420, 1.0330, and 1.0200, which are sufficient to push all technical indicators towards oversold levels.
No matter how strong and accurate the analysis is, you should always work with a trading strategy of not risking and activating profit and stop loss orders to ensure the safety of your trading account from any price surprises, especially in the Trump era.
Ready to trade our daily EUR/USD Forex analysis? We’ve made this forex brokers list for you to check out.
All things being equal, GBP/JPY is a pair that is highly sensitive to risk appetite, so you do have to keep that in mind. So, it’ll be interesting to see how we behave over the next couple of days as this pullback has been a little bit of relief for those who got a little stretched. And now we have to see whether or not sideways action will build enough of a base here in order to continue to go higher. If we do break higher and clear the 50 day EMA, then I think we’ve got a situation where the market goes looking to the 200 yen level. If we can break above there, then the 207.50 yen level could be the target.
On a breakdown below the 200-day EMA, I believe that the 190 yen level will offer a significant amount of support. Keep in mind that the Bank of Japan continues to be fairly loose with its monetary policy, despite the fact that occasionally they will jawbone the market. The interest rate differential does pay you at the end of every day, and I think a lot of traders will continue to pay close attention to this on a move above the 195 yen level, I do think that more traders will jump in and try to catch a little bit of a FOMO trade at that point.
Ready to trade our daily Forex analysis? Here are the best regulated trading platforms UK to choose from.
Silver price (XAG/USD) rebounds after discovering a temporary support near the psychological support of $30.00. The white metal gains an interim ground as the US Dollar (USD) retreats. However, its outlook has weakened as its safe-haven demand weakens on potential de-escalation in the war between Israel and Iran.
Israeli Ambassador Mike Herzog told on Israeli Army Radio that a ceasefire deal to end fighting between Israel and Lebanon-based Hezbollah fighters could be reached “within days”, AlJazeera reported.
Potential truce talks have diminished safe-haven demand for precious metals, such as Silver. However, the overall safe-haven appeal has not been extinguished as the war between Russia and Ukraine remains intact.
Meanwhile, an upside-down move in the US Dollar (USD) has resulted in a slight recovery in the Silver price. The US Dollar Index (DXY), which tracks the Greenback’s value against six major currencies, surrenders gains after a strong opening and drops to near 107.00.
The US Dollar opened on a strong note after President-elect Donald Trump threatened to raise import tariffs by 25% on Canada and Mexico and an additional 10% above the already mentioned 60% on China.
In Tuesday’s session, investors will focus on the Federal Open Market Committee (FOMC) minutes of the policy meeting held on November 7, which will be published at 19:00 GMT. In the policy meeting, the Fed reduced interest rates by 25 basis points (bps) to 4.50%-4.75% and officials were confident that inflation remains on a sustainable track towards the bank’s target of 2%.
Silver price resumes its declining trend after a mean-reversion move to near the 20-day Exponential Moving Average (EMA) around $31.40. The white metal is expected to retreat to the November 14 low of around $29.70. The white metal weakened after the breakdown of the horizontal support plotted from the May 21 high of $32.50.
The upward-sloping trendline from the February 29 low of $22.30 will act as key support for the Silver price around $29.50.
The 14-day Relative Strength Index (RSI) oscillates in the 40.00-60.00 range, suggesting a sideways trend.
Silver is a precious metal highly traded among investors. It has been historically used as a store of value and a medium of exchange. Although less popular than Gold, traders may turn to Silver to diversify their investment portfolio, for its intrinsic value or as a potential hedge during high-inflation periods. Investors can buy physical Silver, in coins or in bars, or trade it through vehicles such as Exchange Traded Funds, which track its price on international markets.
Silver prices can move due to a wide range of factors. Geopolitical instability or fears of a deep recession can make Silver price escalate due to its safe-haven status, although to a lesser extent than Gold’s. As a yieldless asset, Silver tends to rise with lower interest rates. Its moves also depend on how the US Dollar (USD) behaves as the asset is priced in dollars (XAG/USD). A strong Dollar tends to keep the price of Silver at bay, whereas a weaker Dollar is likely to propel prices up. Other factors such as investment demand, mining supply – Silver is much more abundant than Gold – and recycling rates can also affect prices.
Silver is widely used in industry, particularly in sectors such as electronics or solar energy, as it has one of the highest electric conductivity of all metals – more than Copper and Gold. A surge in demand can increase prices, while a decline tends to lower them. Dynamics in the US, Chinese and Indian economies can also contribute to price swings: for the US and particularly China, their big industrial sectors use Silver in various processes; in India, consumers’ demand for the precious metal for jewellery also plays a key role in setting prices.
Silver prices tend to follow Gold’s moves. When Gold prices rise, Silver typically follows suit, as their status as safe-haven assets is similar. The Gold/Silver ratio, which shows the number of ounces of Silver needed to equal the value of one ounce of Gold, may help to determine the relative valuation between both metals. Some investors may consider a high ratio as an indicator that Silver is undervalued, or Gold is overvalued. On the contrary, a low ratio might suggest that Gold is undervalued relative to Silver.
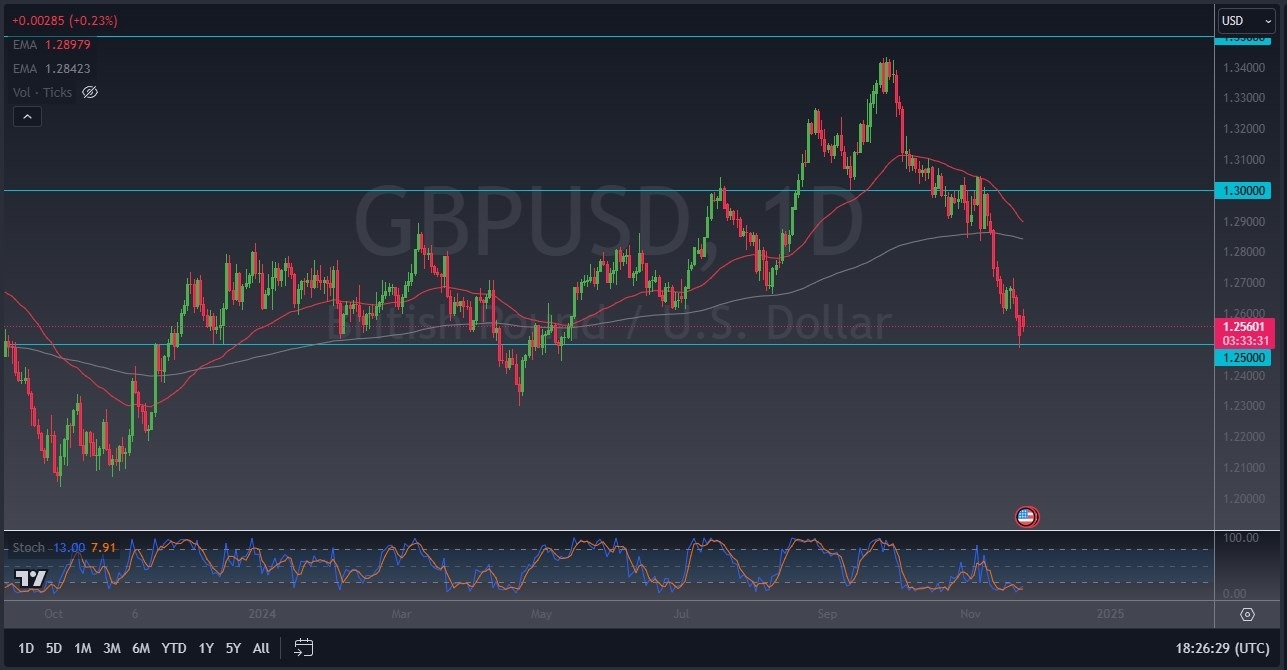
If the GBP/USD market were to bounce from here again, then we could see a move to the 1.27 level, which is an area where we had bounced from and then came back below it, only to bounce back to the downside once we reached it again. In other words, there should be a lot of market memory in this area. If we can break the above there, then we have the possibility of going to look at the 200-day EMA.
On the other hand, if we were to break down below the 1.25 level, then it opens up the possibility of a move down to the 1.23 level, an area that I think will continue to be important as it also has a lot of market memory. All things being equal, the US dollar is by far one of the strongest currencies in the world right now. And while the British pound itself isn’t too bad, it’s not the US dollar.
So, I still think this is a market that rallies will get faded at the first signs of exhaustion, and therefore I’m looking for selling opportunities. If we do break above here, then I think we’ve got a lot of work to do to turn things around. This isn’t to say that we won’t get the bounce that looks like it’s trying to set up, because quite frankly, a little bit of profit taking might make a certain amount of sense. But nonetheless, at this point in time, I think you’ve got a lot of work to go before we can truly turn things around for a longer term move.
Ready to trade our daily GBP/USD Forex analysis? Here are the best regulated trading platforms UK to choose from.
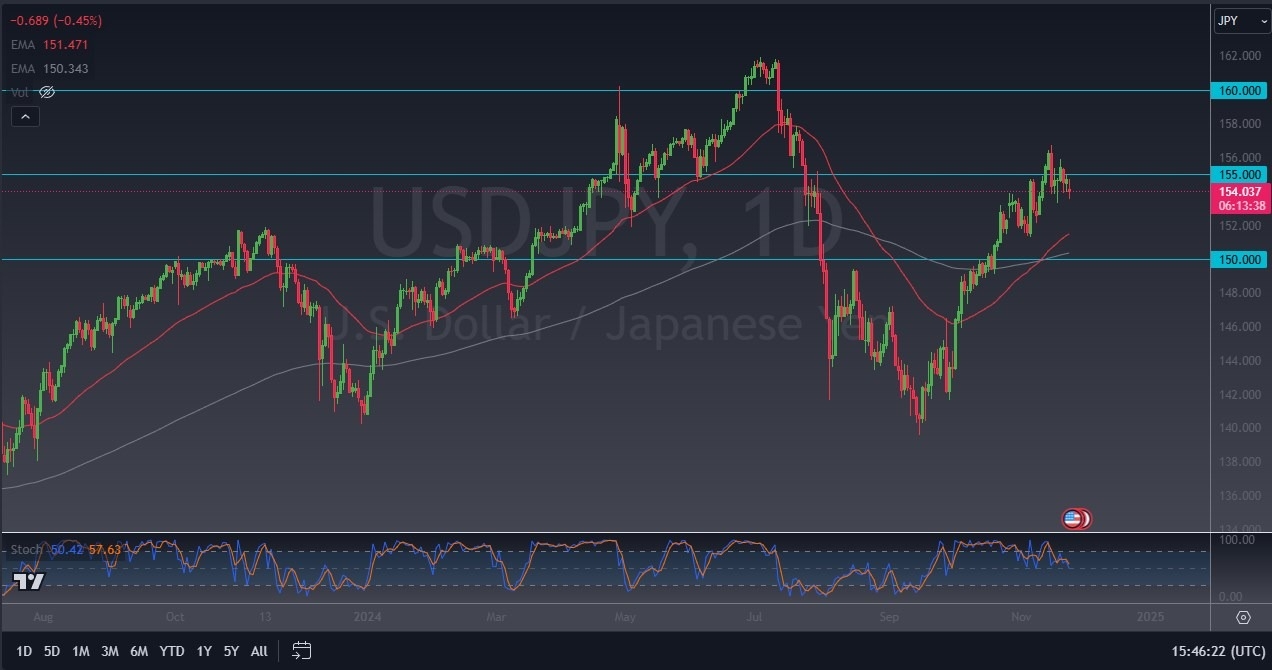
Keep in mind that this is a market that still has a positive swap, and that will continue to be a major factor in how people approach it. After all, the Bank of Japan can do nothing to tighten monetary policy at this point, because quite frankly there is so much in the way of debt that is attached to the Japanese economy that it would completely implode domestic conditions if they approached to aggressively.
I believe that the ¥155 level is crucial, and if we can break above there could open up a move to the ¥160 level. The 50 Day EMA has recently broken above the 200 Day EMA, roughly at the ¥150 level, kicking off the so-called “golden cross” that a lot of longer-term traders pay close attention to. The market has been bouncing rather significantly over the last month or so, and we have seen the Japanese yen lose quite a bit of strength. Perhaps we are entering an area of digestion, which would make quite a bit of sense considering that we had reached the ¥150 level in rather short order.
Going forward, it does look like this is a “buy on the dips” type of market, with the 50 Day EMA offering potential support near the ¥151.50 level. After that, we have the 200 Day EMA sitting just above the ¥150 level, which of course is an area that would attract a lot of attention from a large, round, psychologically significant figure standpoint, and of course the same indicator that most trend followers pay close attention to over the longer term anyway. I remain bullish, but I recognize we may be a bit noisy in the short term.
Ready to trade our daily forex forecast? Here are Japan’s Best Forex Brokers to choose from.
Silver price (XAG/USD) hovers around $30.40 per troy ounce during the Asian trading hours on Tuesday, following a nearly 3% drop in the previous session. This downside risk for safe-haven assets like Silver metal is linked to reports suggesting that Israel and Hezbollah are close to reaching a ceasefire agreement.
Additionally, the price of dollar-denominated Silver has been pressured by a stronger US dollar (USD) after President-elect Donald Trump announced plans to impose a 25% tariff on all imports from Mexico and Canada starting on his first day in office, alongside an additional 10% tariff on goods from China. A stronger US dollar makes precious metals more expensive for foreign buyers, negatively affecting Silver demand.
The non-yielding Silver faced downward pressure due to optimism in the bond market following the selection of Scott Bessent as US Treasury Secretary in the incoming administration. Bessent has advocated for a phased approach to trade restrictions and expressed a willingness to negotiate tariff levels in coordination with President-elect Donald Trump.
However, Tuesday’s less hawkish comments from Federal Reserve (Fed) officials may have offered some support for Silver prices. Chicago Fed President Austan Goolsbee suggested that the Fed is likely to continue lowering interest rates toward a neutral stance that neither stimulates nor restricts economic activity. Meanwhile, Minneapolis Fed President Neel Kashkari pointed out that another rate cut could be considered at the Fed’s December meeting, according to Bloomberg.
Investors are now focusing on the Federal Reserve’s November meeting minutes, set to be released later in the North American session. These minutes could offer crucial insights into the central bank’s direction on monetary policy.
Silver is a precious metal highly traded among investors. It has been historically used as a store of value and a medium of exchange. Although less popular than Gold, traders may turn to Silver to diversify their investment portfolio, for its intrinsic value or as a potential hedge during high-inflation periods. Investors can buy physical Silver, in coins or in bars, or trade it through vehicles such as Exchange Traded Funds, which track its price on international markets.
Silver prices can move due to a wide range of factors. Geopolitical instability or fears of a deep recession can make Silver price escalate due to its safe-haven status, although to a lesser extent than Gold’s. As a yieldless asset, Silver tends to rise with lower interest rates. Its moves also depend on how the US Dollar (USD) behaves as the asset is priced in dollars (XAG/USD). A strong Dollar tends to keep the price of Silver at bay, whereas a weaker Dollar is likely to propel prices up. Other factors such as investment demand, mining supply – Silver is much more abundant than Gold – and recycling rates can also affect prices.
Silver is widely used in industry, particularly in sectors such as electronics or solar energy, as it has one of the highest electric conductivity of all metals – more than Copper and Gold. A surge in demand can increase prices, while a decline tends to lower them. Dynamics in the US, Chinese and Indian economies can also contribute to price swings: for the US and particularly China, their big industrial sectors use Silver in various processes; in India, consumers’ demand for the precious metal for jewellery also plays a key role in setting prices.
Silver prices tend to follow Gold’s moves. When Gold prices rise, Silver typically follows suit, as their status as safe-haven assets is similar. The Gold/Silver ratio, which shows the number of ounces of Silver needed to equal the value of one ounce of Gold, may help to determine the relative valuation between both metals. Some investors may consider a high ratio as an indicator that Silver is undervalued, or Gold is overvalued. On the contrary, a low ratio might suggest that Gold is undervalued relative to Silver.
In fact, it’s probably worth noting that we initially tried to rally during the trading session on Monday but gave back those gains rather rapidly.
Because of this, I think you have got a situation where traders are going to continue to see a lot of volatility in this pair, and that does make a certain amount of sense considering that the European Union has a whole host of issues to worry about. After all, we’ve got a situation where there is a hot war on the continent that is only getting worse, so that in and of itself probably makes some traders a little bit cautious about being involved in the European Union.
The US elections have been like a shot in the arm for the US dollar and US equities overall. I think that continues to be the case, but it’s also worth noting that the market is paying close attention to the interest rate situation in the United States, as they have been rising, despite the fact that the Federal Reserve has been cutting. With this being the case, think you get a situation where traders will continue to look at this through the interest rate differential argument, but then again you also have to keep in mind that the US is more likely to be business friendly than the European Union now that Donald Trump is taking over.
We also have the idea of safety as far as the US dollar is concerned, and I think that continues to be the case here. After all, the world is a somewhat scary place at the moment, and that means that the US dollar might be where people run to.
Ready to start trading the EUR/USD daily analysis? Get our top rated Forex brokers list here.