The main category of Forex News.
You can use the search box below to find what you need.
[wd_asp id=1]
The main category of Forex News.
You can use the search box below to find what you need.
[wd_asp id=1]
Experts predict that coffee prices on October 26, 10 in the domestic market may continue to decline due to market impacts. world and the new harvest situation in Vietnam.
Currently, many coffee gardens in Vietnam are starting to ripen and people are harvesting. This is one of the factors that causes the market to continue to decrease in price because Vietnam is the largest supplier of robusta coffee in the world. Although at present, coffee prices are still high at over 100.000 VND/kg, the prolonged decline has also made many people worried about the refrain “every harvest season, prices decrease”.
Poor weather in Brazil has also contributed to the price drop. According to Somar Meteorologia, rainfall in Minas Gerais, Brazil’s largest coffee-producing state, reached 36,8 mm last week, 15% higher than the historical average.
| Coffee price forecast for October 26, 10: Continue to decline sharply due to concerns about the new harvest situation in Vietnam |
In addition, although the Dollar Index decreased, the Brazilian Real decreased more sharply, causing the USD/BRL exchange rate to increase. In this context, the market is concerned that Brazilian farmers will increase sales due to earning more foreign currency, thereby creating downward pressure on prices.
Recorded in the trading session on October 25, 10, domestic coffee prices today increased slightly by 2024 – 200 VND/kg, ranging from 300 – 109.600 VND/kg. Currently, the average purchase price in the Central Highlands provinces is 110.000 VND/kg, the highest purchase price in the province Dak Nong 110.000 VND/kg.
Specifically, the coffee purchase price in the province Gia Lai (Chu Prong) is 109.800 VND, an increase of 200 VND/kg compared to yesterday, in Pleiku and La Grai the same price is 109.700 VND/kg; In the province Kon Tum at the price of 109.800 VND/kg, an increase of 200 VND/kg compared to yesterday; In Dak Nong province, coffee was purchased at the highest price of 110.000 VND/kg, an increase of 300 VND/kg compared to yesterday.
Price of green coffee beans (coffee beans, fresh coffee beans) in the province Lam Dong In districts such as Bao Loc, Di Linh, Lam Ha, coffee was purchased at 109.600 VND/kg, an increase of 200 VND/kg compared to yesterday.
Coffee prices today (April 25) in the province Dak LakIn Cu M’gar district, coffee was purchased at about 109.800 VND/kg, an increase of 200 VND/kg, while in Ea H’leo district and Buon Ho town, it was purchased at the same price of 109.700 VND/kg.
Updated world coffee prices at 20:00 p.m. on August 25, 10, Vietnam time on the London exchange, the price of Robusta coffee futures contract for delivery in September 2024 on the London floor is at 11 USD/ton, an increase 2024 USD compared to the beginning of the trading session.
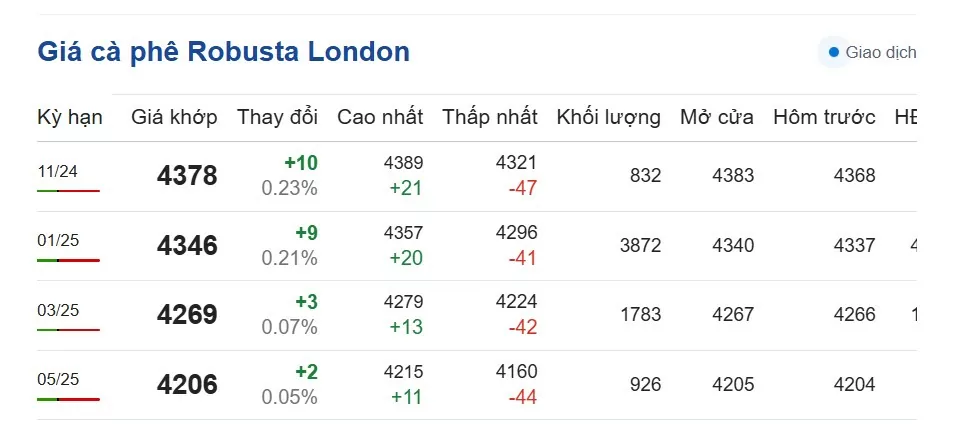 |
| Coffee prices today, July 25, 10: Robusta coffee prices on the London floor. (Photo: Screenshot from giacaphe.com |
Delivery term in November 1 is 2025 USD/ton, an increase of 4.346 USD; Delivery term in January 9 is 3 USD/ton, up 2025 USD and delivery term in March 4.269 is 3 USD/ton, up 5 USD.
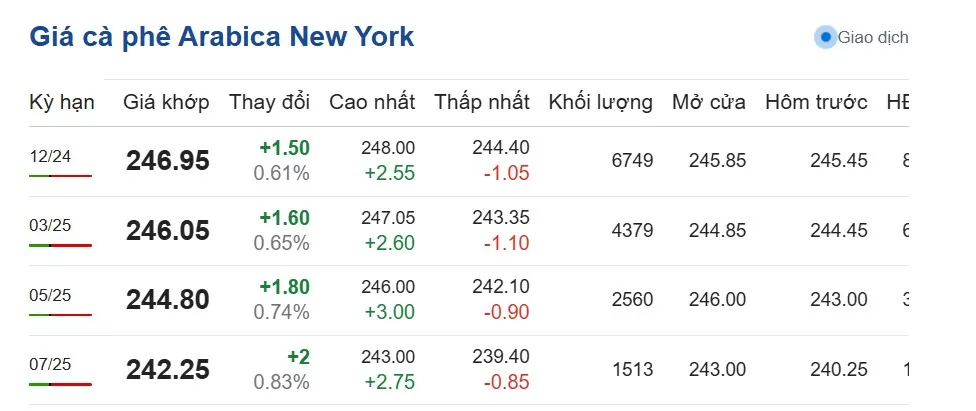 |
| Arabica coffee prices on the New York floor on October 25, 10. (Photo: Screenshot of giacaphe.com) |
In particular, the price of Arabica coffee on the New York floor today at 20:00 p.m. on September 25, 10 increased in all terms, fluctuating at 2024 – 242.25 cents/lb.
Specifically, the delivery term in September 12 is 2024 cents/lb; increased 246.95 cents/lb compared to the beginning of the session. December 1.50 delivery is 3 cents/lb, an increase of 2025 cents/lb; March 246.05 delivery is 1.60 cents/lb, up 5 cents/lb and May 2025 delivery is 244.80 cents/lb, up 1.80 cents/lb.
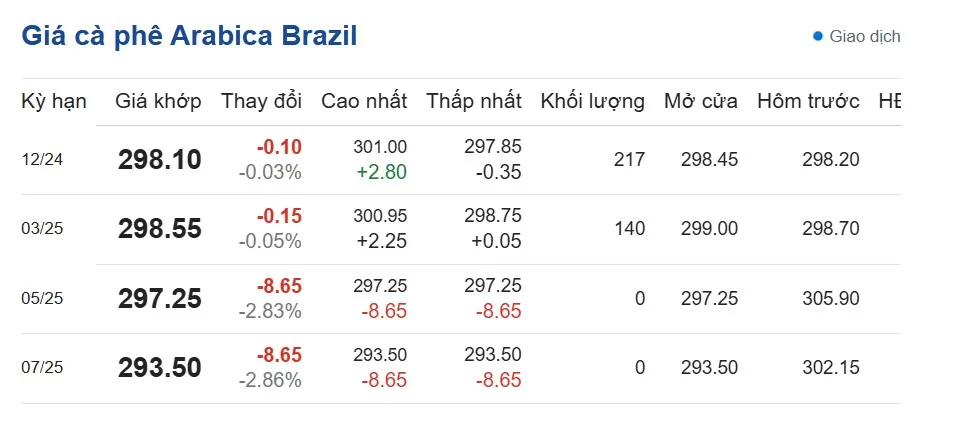 |
| Brazilian Arabica coffee price on October 25, 10. (Photo: Screenshot of giacaphe.com) |
The price of Brazilian Arabica coffee today at 21:00 p.m. on October 25, 10 decreased. Specifically, the delivery period for December 2024 is 12 USD/ton, down 2024%; the delivery period for March 298.10 is 0.03 USD/ton, down 3%; the delivery period for May 2025 is 298.55 USD/ton, down 0.15% and the delivery period for July 5 is 2025 USD/ton, down 297.25%.
Robusta coffee traded on ICE Futures Europe (London floor) opens at 16:00 and closes at 00:30 (the next day), Vietnam time.
Arabica coffee on the ICE Futures US floor (New York floor) opens at 16:15 p.m. and closes at 01:30 a.m. (the next day), Vietnam time.
According to the US Department of Agriculture (USDA), more than 95% of Vietnam’s coffee output in the coming season will be robusta. The growing popularity of instant and take-away coffee, combined with limited supplies due to weather, has caused robusta prices to double over the past year. The current price of robusta is almost equal to that of premium arabica, which has also increased sharply in recent times.
Volcafe Ltd., a major coffee trader, forecasts a severe global robusta deficit in the 2024-2025 crop year, which would be the fourth consecutive year of such a deficit.
*Information is for reference only, prices may vary depending on region and locality
Sources: https://congthuong.vn/du-bao-gia-ca-phe-ngay-26102024-gia-ca-phe-trong-nuoc-bat-ngo-quay-dau-giam-manh-354810.html
GBP/JPY has broken out of a Right-Angle Triangle pattern and rallied higher.
The pair completed a decisive move above the upper boundary of a Triangle pattern (see chart) and peaked on Wednesday at 198.44.
The first upside target for the pattern lies at 199.59 (blue shaded rectangle), the 61.8% Fibonacci extrapolation of the height of the triangle (at its widest point) higher.
The pair has pulled back since peaking but the odds favor it eventually rallying back up to the aforementioned target. A break above Wednesday’s 198.44 high would provide bullish confirmation.
The Relative Strength Index (RSI) momentum indicator is not yet in the overbought zone (above 70) suggesting the pair has room to go higher.
Crude oil prices are expected to fluctuate in the coming years, with a potential rise to $80 per barrel in the last quarter of 2024, before dipping to the low $60s by the end of 2025, according to a report by JP Morgan.
The report attributes the current volatility to geopolitical tensions in West Asia, but notes that key players in the region, such as Saudi Arabia and the UAE, have strong economic incentives to keep the conflict contained.
“The current situation suggests a sustained geopolitical premium in crude prices until the conflict is resolved in the short term,” said Natasha Kaneva, JP Morgan’s head of global commodities strategy.
Crude oil prices have seen a steady rise, with Brent crude moving from $71 per barrel in late September to nearly $81 in early October, only to drop back to around $73 as demand concerns surfaced. Analysts also highlight weak demand from major economies like China and the U.S., contributing to the downward pressure on prices. Rabobank International expects the market to be oversupplied by about 700,000 barrels per day (bpd) in 2025, which could drive prices lower.
Petroleum Minister, Hardeep Singh Puri, remains confident about the country’s ability to manage crude supplies despite geopolitical concerns. “There is no shortage of oil,” Puri said at a recent event, adding that additional supplies from Brazil and Guyana are helping to stabilize the market. He also acknowledged that while geopolitical tensions can inflate costs due to higher freight and insurance, India’s crude needs will be met. India imports over 85% of its crude oil, making price stability crucial for managing inflation and fuel costs domestically.
Key points from the JP Morgan and Rabobank reports:
Puri emphasized that despite these fluctuations, India’s energy security remains intact, pointing to India’s preparedness in managing any disruptions to global oil supplies.
The Pound Sterling (GBP) remained at its lowest level in over two months versus the US Dollar (USD), leaving the GBP/USD vulnerable below the 1.3000 threshold.
The demand for the safe-haven USD dominated throughout the week for varied reasons, including the heightened uncertainty leading into the November 5 US presidential election, rising Middle East geopolitical tensions and earnings season globally.
There were no signs of a ceasefire between Israel and Iran, as the former continued to attack the Iran-backed Lebanese militant group Hezbollah in Beirut.
Meanwhile, markets priced in higher chances of a victory for the Republican nominee and the former US President Donald Trump in the presidential race. Trump’s trade and expansionary fiscal policies are seen as inflationary, calling for higher interest rates and the Greenback.
Furthermore, investors remained wary ahead of earnings reports from US titans such as Tesla Inc., Amazon, Google, Nvidia, etc., scurrying for safety in the Greenback. Persistent bets for a less aggressive easing policy likely to be adopted by the Fed also boded well for the buck.
This risk-averse market environment exacerbated the pain in the Pound Sterling, which was already hit a week ago by the increased bets of a Bank of England (BoE) interest rate cut next month after a bigger-than-expected cooldown in the UK inflation for September.
Data released by the Office for National Statistics (ONS) showed on October 16 that the annual UK Consumer Price Index (CPI) inflation fell sharply to 1.7% in September from 2.2% in August, the lowest reading since April 2021.
However, heading into the weekend, the Pound Sterling recovered some ground as the USD rally took a breather ahead of mid-tier US economic data releases. A cautiously optimistic market mood also allowed the risk-sensitive GBP to find some demand.
Clocks turn back in the UK at the onset of an action-packed week.
After taking a breather, the market volatility is likely to ramp up in the upcoming week, with a bunch of high-impact economic releases due from the US. Meanwhile, the UK is set to release its Autumn Budget, which could have a significant impact on the local bond market and the Pound Sterling.
Monday is a quiet calendar on both sides of the Atlantic but Tuesday sees the release of the US Conference Board (CB) Consumer Confidence and JOLTS Job Openings data.
On Wednesday, the UK Autumn Budget and the US Automatic Data Processing (ADP) Employment Change data will hog the limelight.
BoE policymaker Sarah Breeden will speak early Thursday while the Fed’s preferred inflation gauge, the core Personal Consumption Expenditures (PCE) Price Index for September, and the Jobless Claims data will be reported later that day in the American trading hours.
The all-important US Nonfarm Payrolls and the wage inflation data will be eagerly awaited on Friday, which will provide fresh hints on the size and the pace of the next Fed rate cuts. The ISM Manufacturing PMI will also hold some relevance heading into the Fed’s ‘blackout period’, starting from Saturday until the November 7 monetary policy meeting.
Amidst a busy calendar, traders will also pay close attention to the Middle East geopolitical risks and the uncertainty around the November 5 US presidential election.
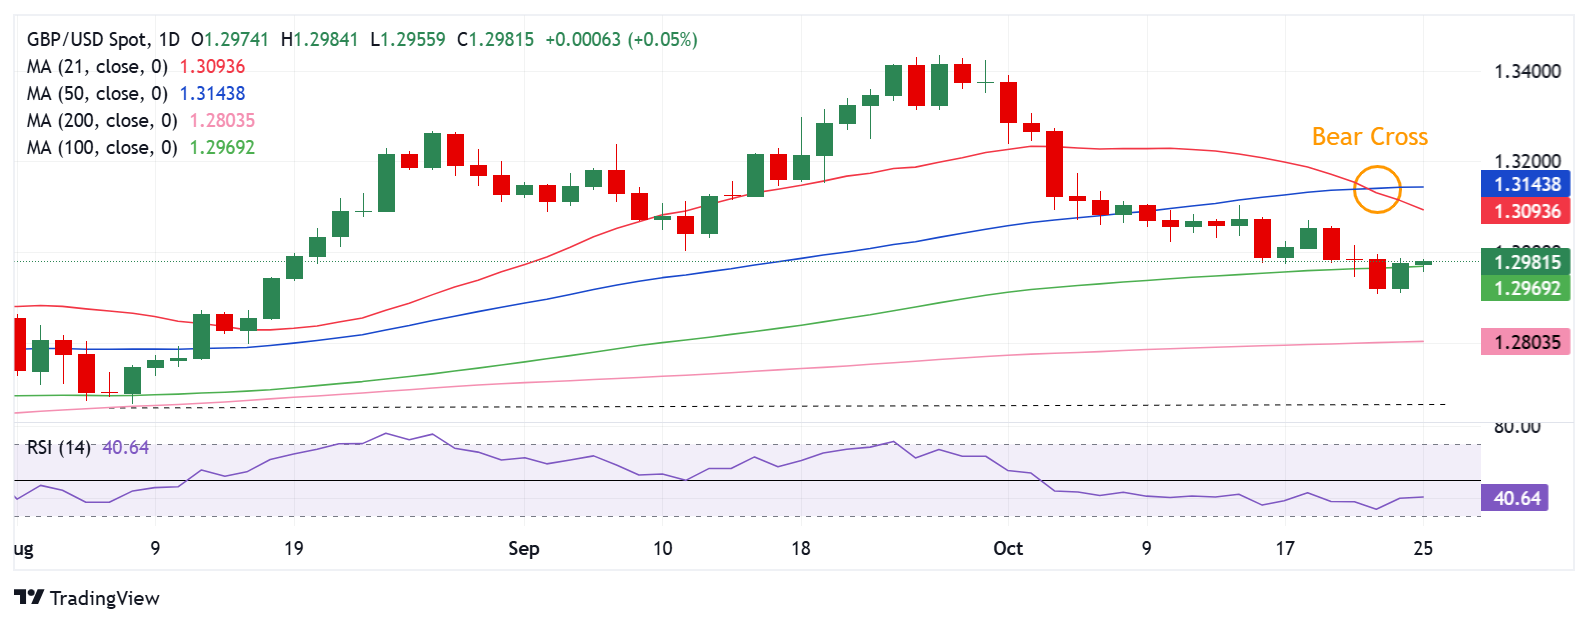
The GBP/USD pair battled the 100-day Simple Moving Average (SMA) at 1.2969 as the downtrend extended into the fourth consecutive week.
A weekly closing below that level could provide fresh zest to Pound Sterling sellers.
The next bearish target is seen at the June 12 high of 1.2861, below which the critical 200-day SMA cap at 1.2803 will be challenged.
If buyers fail to defend that key support, a fresh downside could initiate toward the August 8 low of 1.2665.
The 14-day Relative Strength Index (RSI) holds well below the 50 level, currently near 40, backing the downside bias.
Adding credence to the bearish outlook, the 21-day SMA crossed the 50-day SMA from above on a daily closing basis on Wednesday, charting out a Bear Cross.
On the flip side, a corrective move higher will need a sustained break above the 1.3000 psychological level, followed by the acceptance above the 21-day SMA at 1.3092.
Further up, the 50-day SMA at 1.3143 could be next on the buyers’ radars.
Nonfarm Payrolls (NFP) are part of the US Bureau of Labor Statistics monthly jobs report. The Nonfarm Payrolls component specifically measures the change in the number of people employed in the US during the previous month, excluding the farming industry.
The Nonfarm Payrolls figure can influence the decisions of the Federal Reserve by providing a measure of how successfully the Fed is meeting its mandate of fostering full employment and 2% inflation. A relatively high NFP figure means more people are in employment, earning more money and therefore probably spending more. A relatively low Nonfarm Payrolls’ result, on the either hand, could mean people are struggling to find work. The Fed will typically raise interest rates to combat high inflation triggered by low unemployment, and lower them to stimulate a stagnant labor market.
Nonfarm Payrolls generally have a positive correlation with the US Dollar. This means when payrolls’ figures come out higher-than-expected the USD tends to rally and vice versa when they are lower. NFPs influence the US Dollar by virtue of their impact on inflation, monetary policy expectations and interest rates. A higher NFP usually means the Federal Reserve will be more tight in its monetary policy, supporting the USD.
Nonfarm Payrolls are generally negatively-correlated with the price of Gold. This means a higher-than-expected payrolls’ figure will have a depressing effect on the Gold price and vice versa. Higher NFP generally has a positive effect on the value of the USD, and like most major commodities Gold is priced in US Dollars. If the USD gains in value, therefore, it requires less Dollars to buy an ounce of Gold. Also, higher interest rates (typically helped higher NFPs) also lessen the attractiveness of Gold as an investment compared to staying in cash, where the money will at least earn interest.
Nonfarm Payrolls is only one component within a bigger jobs report and it can be overshadowed by the other components. At times, when NFP come out higher-than-forecast, but the Average Weekly Earnings is lower than expected, the market has ignored the potentially inflationary effect of the headline result and interpreted the fall in earnings as deflationary. The Participation Rate and the Average Weekly Hours components can also influence the market reaction, but only in seldom events like the “Great Resignation” or the Global Financial Crisis.
Gold (XAU/USD) extended its uptrend and reached a new all-time high above $2,750. Rising US Treasury bond yields and the improving risk mood, however, made it difficult for the precious metal to preserve its bullish momentum in the second half of the week. The US economic calendar will feature Gross Domestic Product (GDP) data for the third quarter and labor market figures for October, which could significantly affect Gold’s valuation next week.
Gold edged higher to start the week as the People’s Bank of China’s (PBoC) decision to cut the one-year Loan Prime Rate (LPR) by 25 basis points (bps) from 3.35% to 3.10% eased concerns over an economic downturn. Additionally, escalating geopolitical tensions allowed the precious metal to capture safe-haven demand on Monday as markets reacted to reports of Hezbollah claiming responsibility for a drone attack that targeted Israeli Prime Minister Benjamin Netanyahu’s house over the weekend.
XAU/USD preserved its bullish momentum on Tuesday and gained more than 1% on the day. In the absence of high-tier data releases, Gold continued to benefit from the souring market mood. After reaching a new all-time high of $2,758 during the European trading hours on Wednesday, the precious metal reversed its direction and closed the day with a 1.2% loss. Rising US Treasury bond yields and the broad-based US Dollar (USD) strength caused XAU/USD to lose its footing midweek. Additionally, profit-taking after the record-setting rally may have ramped up the bearish pressure.
On Thursday, data from the US showed that the business activity in the private sector continued to grow at a healthy pace in early October, with the preliminary S&P Global Composite Purchasing Managers Index (PMI) edging higher to 54.3 in October from 54.0 in September. Assessing the survey’s findings, “October saw business activity continue to grow at an encouragingly solid pace, sustaining the economic upturn that has been recorded in the year to date into the fourth quarter,” said Chris Williamson, Chief Business Economist at S&P Global Market Intelligence and added: “The October flash PMI is consistent with GDP growing at an annualized rate of around 2.5%.” Gold struggled to gather recovery momentum after this report and ended the day modestly higher.
The market action turned choppy heading into the weekend and Gold spent Friday fluctuating in a relatively narrow range.
The US Bureau of Economic Analysis (BEA) will publish the first estimate of the annualized Gross Domestic Product (GDP) growth for the third quarter on Wednesday. Investors forecast the US GDP to expand by 3% in this period, matching the growth recorded in the second quarter. A reading above the market expectation could boost the USD as the immediate reaction and cause XAU/USD to stretch lower. On the other hand, a disappointing GDP print, between 1% and 2%, could hurt the USD.
On Thursday, the BEA will publish the Personal Consumption Expenditures (PCE) Price Index, the Federal Reserve’s (Fed) preferred gauge of inflation, for September. Because the GDP report will also offer quarterly PCE Price Index numbers, the monthly data is unlikely to trigger a market reaction.
The US Bureau of Labor Statistics (BLS) will release the labor market data for October on Friday. In September, Nonfarm Payrolls (NFP) rose by 254,000. This reading surpassed the market expectation of 140,000 by a wide margin and caused markets to refrain from pricing in a 50 basis points (bps) Fed rate cut in November.
According to the CME FedWatch Tool, markets nearly fully price in a 25 bps rate cut at the upcoming meeting and see about a 70% chance of the Fed lowering the policy rate by a total of 50 bps by the end of the year. At this point, it would take a significant downside surprise in NFP for markets to reconsider the possibility of a large rate cut either in November or December. In case the NFP comes in at or below 100,000, the USD could come under heavy selling pressure and open the door for a Gold rally heading into the weekend.
Conversely, an NFP print between 180,000 and 220,000 could be seen as a ‘good enough’ figure for the Fed to opt for two 25 bps rate cuts by the end of the year. Finally, investors could doubt a rate cut in December if the NFP arrives near 300,000 or higher. In this scenario, XAU/USD could come under strong bearish pressure.
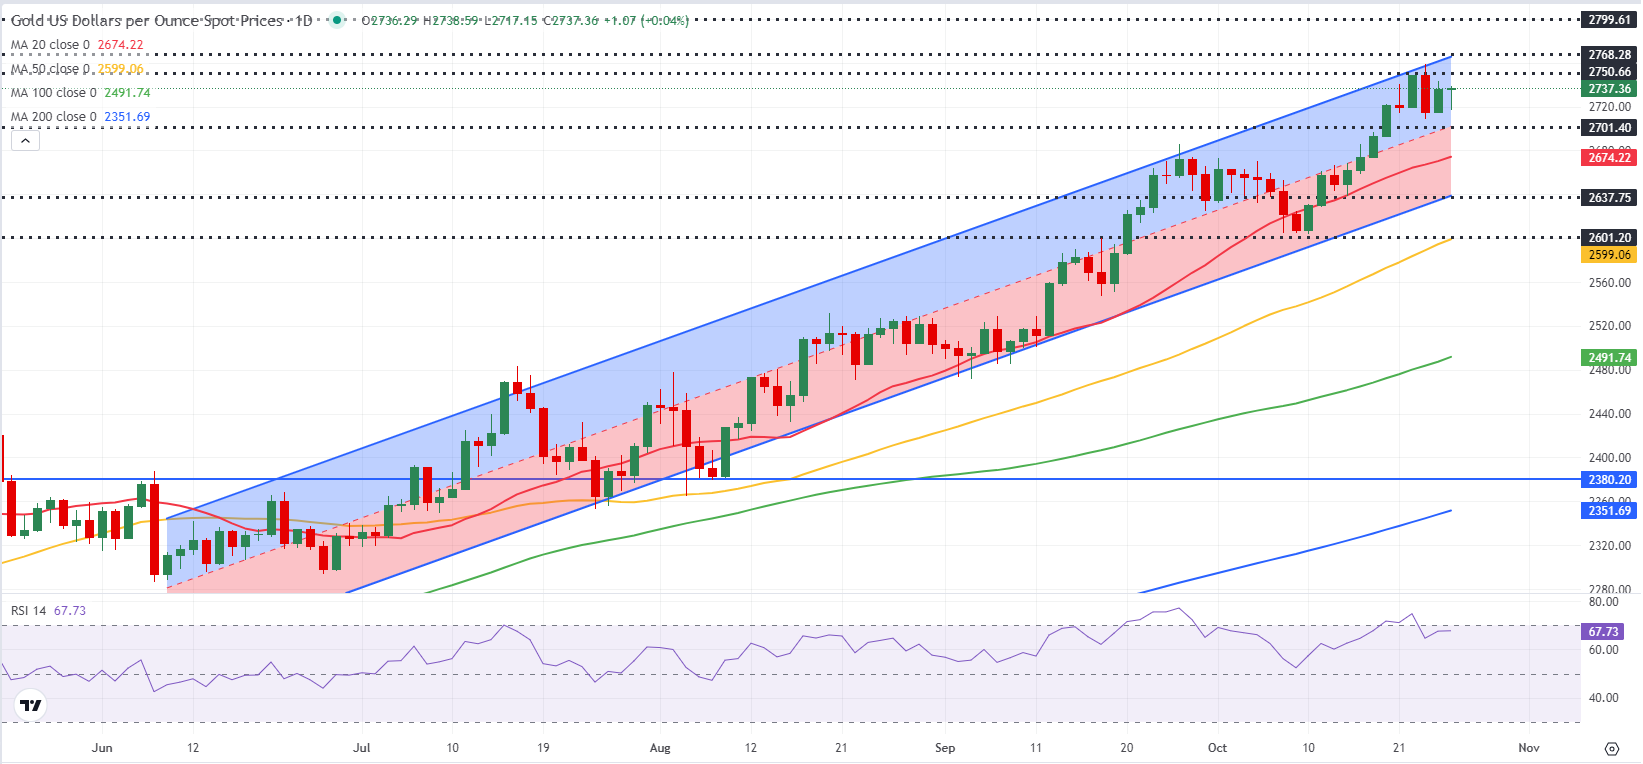
The Relative Strength Index (RSI) indicator on the daily chart retreated toward 60 after rising above 70 earlier in the week, suggesting that the bullish bias remains intact after Gold corrected its overbought conditions. Additionally, XAU/USD remains within the ascending regression channel coming from June.
Looking south, first support could be spotted at $2,700, where the mid-point of the ascending channel is located, before $2,675 (20-day Simple Moving Average) and $2,635 (lower limit of the ascending channel).
On the upside, interim resistance seems to have formed at $2,750 before $2,770 (upper limit of the ascending channel) and $2,800 (round level).
Nonfarm Payrolls (NFP) are part of the US Bureau of Labor Statistics monthly jobs report. The Nonfarm Payrolls component specifically measures the change in the number of people employed in the US during the previous month, excluding the farming industry.
The Nonfarm Payrolls figure can influence the decisions of the Federal Reserve by providing a measure of how successfully the Fed is meeting its mandate of fostering full employment and 2% inflation. A relatively high NFP figure means more people are in employment, earning more money and therefore probably spending more. A relatively low Nonfarm Payrolls’ result, on the either hand, could mean people are struggling to find work. The Fed will typically raise interest rates to combat high inflation triggered by low unemployment, and lower them to stimulate a stagnant labor market.
Nonfarm Payrolls generally have a positive correlation with the US Dollar. This means when payrolls’ figures come out higher-than-expected the USD tends to rally and vice versa when they are lower. NFPs influence the US Dollar by virtue of their impact on inflation, monetary policy expectations and interest rates. A higher NFP usually means the Federal Reserve will be more tight in its monetary policy, supporting the USD.
Nonfarm Payrolls are generally negatively-correlated with the price of Gold. This means a higher-than-expected payrolls’ figure will have a depressing effect on the Gold price and vice versa. Higher NFP generally has a positive effect on the value of the USD, and like most major commodities Gold is priced in US Dollars. If the USD gains in value, therefore, it requires less Dollars to buy an ounce of Gold. Also, higher interest rates (typically helped higher NFPs) also lessen the attractiveness of Gold as an investment compared to staying in cash, where the money will at least earn interest.
Nonfarm Payrolls is only one component within a bigger jobs report and it can be overshadowed by the other components. At times, when NFP come out higher-than-forecast, but the Average Weekly Earnings is lower than expected, the market has ignored the potentially inflationary effect of the headline result and interpreted the fall in earnings as deflationary. The Participation Rate and the Average Weekly Hours components can also influence the market reaction, but only in seldom events like the “Great Resignation” or the Global Financial Crisis.
October 25, 2024 – Written by Tim Boyer
STORY LINK GBP/EUR Exchange Rate Strengthens as Eurozone PMIs Disappoint
The Pound to Euro (GBP/EUR) exchange rate traded with modest gains on Thursday morning, as markets digested the latest PMI releases from both the UK and Eurozone.
At the time of writing, GBP/EUR was trading around €1.1999, up approximately 0.2% from Thursday’s opening levels.
The Euro (EUR) came under pressure on Thursday, in response to the Eurozone’s latest PMIs.
October’s preliminary figures highlighted another contraction in the bloc’s private sector. Last month’s composite PMI printed at 49.7, slightly better than August’s 49.6 but still below the crucial 50-mark, signalling ongoing contraction.
The decline was driven by continued weakness in the manufacturing sector, which recorded its 19th consecutive month of contraction.
Although the service sector showed some growth, the data also reported a falling in new orders and declining backlogs of work, raising concerns that the service sector may not sustain this growth for long.
The Pound (GBP) firmed on Thursday morning, although its gains were somewhat restrained following the release of weaker-than-expected UK PMI data.

The PMIs for October reported a moderation of growth in both the manufacturing and services sectors, in advance of the UK’s upcoming budget.
The report suggested that concerns about the budget, alongside global uncertainties and political risks, were surpressing business sentiment and spending in the UK.
Looking ahead, the Pound to Euro exchange rate could extend its gains on Friday with the release of Germany’s Ifo business climate index.
Although economists expect a slight uptick in the index for October, it remains at a low level, which could put additional pressure on the Euro as we close out the week.
Meanwhile, with little UK economic data in short supply, GBP investors are likely to focus on any developments surrounding Chancellor Rachel Reeves’s upcoming budget as more details begin to emerge ahead of Wednesday’s full announcement.
International Money Transfer? Ask our resident FX expert a money transfer question or try John’s new, free, no-obligation personal service! ,where he helps every step of the way,
ensuring you get the best exchange rates on your currency requirements.
TAGS: Pound Euro Forecasts
Most recently, our Fed expectations were largely in line with those of the market. Just like the market, we expect the Fed to lower its key rate to around 3½%. Therefore, there is little to be said for idiosyncratic USD strength. However, we had previously expected the ECB to cut its key rate by far less than the market expects. This is no longer the case, Commerzbank’s Head of FX and Commodity Research Ulrich Leuchtmann notes.
“Part of the current USD strength is certainly due to the fact that Donald Trump’s chances of returning to the White House have increased in view of recent polls. Since Trump’s tariff and tax policies are widely expected to have an inflationary effect, the new polls are likely to have contributed to the recent dollar strength. In the event of Kamala Harris’s election victory, there is thus potential for a setback for the dollar. From today’s perspective, weighing up the risks, a slight weakening of the dollar appears to be the more likely scenario for the coming months.”
“In the US, GDP in Q4 2025 will be 1.9% higher than in the same quarter of the previous year – after 2.3% in Q4 2024. This means that the US would continue to grow significantly faster, but not quite as much faster as at present. However, because the US growth advantage is likely to have been responsible for a good part of the USD strength so far, even a small reduction in this US advantage is a rather good signal for the Euro.”
“We are lowering our EUR/USD target from 1.15 to 1.11. The greatest risk for our forecast would be a markedly inflationary US economic policy combined with a Fed that can continue to fight inflationary pressure decisively.”
In a significant upward revision, the leading global investment banking, securities, and asset and wealth management firm, Goldman Sachs, has enhanced its 2025 price forecasts for aluminium and copper, driven by increased demand potential in China, the world’s largest consumer of these metals.
{alcircleadd}
The investment banking giant has adjusted its 2025 average aluminium price outlook to $2,700 per tonne, up from the previous forecast of $2,540 per tonne. Meanwhile, the average copper price forecast has also seen a rise, now set at $10,160 per tonne, an increase from $10,100.
These changes come as the London Metal Exchange (LME) reports aluminium trading near $2,634.50 a tonne, following a peak of $2,715—the highest level since May 31. LME copper is currently trading at $9,510.50 a tonne.
Following Wednesday’s sharp decline, GBP/USD reversed its direction and gained more than 0.4% on Thursday. The pair fluctuates in a tight channel below 1.3000 in the European morning on Friday.
The table below shows the percentage change of British Pound (GBP) against listed major currencies this week. British Pound was the weakest against the US Dollar.
| USD | EUR | GBP | JPY | CAD | AUD | NZD | CHF | |
|---|---|---|---|---|---|---|---|---|
| USD | 0.39% | 0.55% | 1.63% | 0.26% | 1.16% | 1.13% | 0.30% | |
| EUR | -0.39% | 0.08% | 1.13% | -0.07% | 0.74% | 0.62% | -0.17% | |
| GBP | -0.55% | -0.08% | 1.05% | -0.28% | 0.63% | 0.58% | -0.29% | |
| JPY | -1.63% | -1.13% | -1.05% | -1.35% | -0.45% | -0.43% | -1.36% | |
| CAD | -0.26% | 0.07% | 0.28% | 1.35% | 0.81% | 0.92% | -0.09% | |
| AUD | -1.16% | -0.74% | -0.63% | 0.45% | -0.81% | 0.04% | -0.92% | |
| NZD | -1.13% | -0.62% | -0.58% | 0.43% | -0.92% | -0.04% | -0.86% | |
| CHF | -0.30% | 0.17% | 0.29% | 1.36% | 0.09% | 0.92% | 0.86% |
The heat map shows percentage changes of major currencies against each other. The base currency is picked from the left column, while the quote currency is picked from the top row. For example, if you pick the British Pound from the left column and move along the horizontal line to the US Dollar, the percentage change displayed in the box will represent GBP (base)/USD (quote).
After outperforming its rivals in the first half of the week, the US Dollar (USD) lost its strength on Thursday, with the US Dollar Index losing 0.4%. The positive shift seen in risk sentiment made it difficult for the USD to find demand, while retreating US Treasury bond yield further weighed on the currency.
Durable Goods Orders for September and the University of Michigan’s (UoM) Consumer Sentiment Index for October will be featured in the US economic calendar on Friday. The UoM data is unlikely to trigger a reaction because it will be a revision. If the Durable Goods Orders unexpectedly rise, the initial reaction could support the USD. On the other hand, a reading worse than the market expectation of -1% could hurt the currency and allow GBP/USD to stretch higher heading into the weekend.
In the meantime, US stock index futures were last seen rising between 0.1% and 0.2%. A bullish opening in Wall Street could attract risk-on flows and cause the USD to weaken further in the second half of the day.
GBP/USD trades within the upper half of the descending regression channel but holds above the 100-day Simple Moving Average (SMA), currently located at 1.2970. Additionally, the Relative Strength Index (RSI) indicator on the 4-hour chart stays slightly above 50, reflecting sellers’ hesitancy.
In case GBP/USD continues to use 1.2970 as support, buyers could remain interested. In this scenario, immediate resistance is located at 1.3000-1.3010 (static level, upper limit of the descending channel) before 1.3050 (100-period SMA) and 1.3100 (static level).
On the downside, supports could be seen at 1.2900 (mid-point of the descending channel) and 1.2800 (lower limit of the descending channel).
The Pound Sterling (GBP) is the oldest currency in the world (886 AD) and the official currency of the United Kingdom. It is the fourth most traded unit for foreign exchange (FX) in the world, accounting for 12% of all transactions, averaging $630 billion a day, according to 2022 data. Its key trading pairs are GBP/USD, also known as ‘Cable’, which accounts for 11% of FX, GBP/JPY, or the ‘Dragon’ as it is known by traders (3%), and EUR/GBP (2%). The Pound Sterling is issued by the Bank of England (BoE).
The single most important factor influencing the value of the Pound Sterling is monetary policy decided by the Bank of England. The BoE bases its decisions on whether it has achieved its primary goal of “price stability” – a steady inflation rate of around 2%. Its primary tool for achieving this is the adjustment of interest rates. When inflation is too high, the BoE will try to rein it in by raising interest rates, making it more expensive for people and businesses to access credit. This is generally positive for GBP, as higher interest rates make the UK a more attractive place for global investors to park their money. When inflation falls too low it is a sign economic growth is slowing. In this scenario, the BoE will consider lowering interest rates to cheapen credit so businesses will borrow more to invest in growth-generating projects.
Data releases gauge the health of the economy and can impact the value of the Pound Sterling. Indicators such as GDP, Manufacturing and Services PMIs, and employment can all influence the direction of the GBP. A strong economy is good for Sterling. Not only does it attract more foreign investment but it may encourage the BoE to put up interest rates, which will directly strengthen GBP. Otherwise, if economic data is weak, the Pound Sterling is likely to fall.
Another significant data release for the Pound Sterling is the Trade Balance. This indicator measures the difference between what a country earns from its exports and what it spends on imports over a given period. If a country produces highly sought-after exports, its currency will benefit purely from the extra demand created from foreign buyers seeking to purchase these goods. Therefore, a positive net Trade Balance strengthens a currency and vice versa for a negative balance.
Silver price (XAG/USD) extends its losses for the third successive session, trading around $33.50 during Friday’s Asian hours. The downside of the precious metal Silver price could be attributed to the robust performance of the US Dollar (USD) and higher Treasury yields.
On Thursday, data indicated that US unemployment claims dropped significantly in late October, underscoring the strength of the labor market. Additionally, a rise in the S&P PMI further highlights robust momentum in the private sector.
The strong US economic data bolster the likelihood that the Federal Reserve (Fed) will take a less aggressive approach to interest rate cuts than previously thought. According to the CME FedWatch Tool, there is a 97% probability of a 25-basis-point rate cut by the Fed in November, with no expectation of a larger 50-basis-point cut.
Despite the challenges, safe-haven Silver may find upward support due to uncertainties surrounding the upcoming US presidential election. A recent Reuters/Ipsos poll showed that Vice President Kamala Harris holds a slight lead of 46% to 43% over former President Donald Trump in a six-day poll that closed on Monday.
Silver price may gain support from safe-haven flows amid uncertainties regarding the Middle East situation. Traders watch for Israel’s response to Iran’s missile attack on October 1. In parallel, US and Israeli officials are preparing to resume talks on a potential ceasefire and the release of hostages in Gaza in the coming days.
US Secretary of State Antony Blinken stated Thursday that the United States does not support a prolonged Israeli campaign in Lebanon, while France has advocated for an immediate ceasefire and diplomatic efforts.
Silver is a precious metal highly traded among investors. It has been historically used as a store of value and a medium of exchange. Although less popular than Gold, traders may turn to Silver to diversify their investment portfolio, for its intrinsic value or as a potential hedge during high-inflation periods. Investors can buy physical Silver, in coins or in bars, or trade it through vehicles such as Exchange Traded Funds, which track its price on international markets.
Silver prices can move due to a wide range of factors. Geopolitical instability or fears of a deep recession can make Silver price escalate due to its safe-haven status, although to a lesser extent than Gold’s. As a yieldless asset, Silver tends to rise with lower interest rates. Its moves also depend on how the US Dollar (USD) behaves as the asset is priced in dollars (XAG/USD). A strong Dollar tends to keep the price of Silver at bay, whereas a weaker Dollar is likely to propel prices up. Other factors such as investment demand, mining supply – Silver is much more abundant than Gold – and recycling rates can also affect prices.
Silver is widely used in industry, particularly in sectors such as electronics or solar energy, as it has one of the highest electric conductivity of all metals – more than Copper and Gold. A surge in demand can increase prices, while a decline tends to lower them. Dynamics in the US, Chinese and Indian economies can also contribute to price swings: for the US and particularly China, their big industrial sectors use Silver in various processes; in India, consumers’ demand for the precious metal for jewellery also plays a key role in setting prices.
Silver prices tend to follow Gold’s moves. When Gold prices rise, Silver typically follows suit, as their status as safe-haven assets is similar. The Gold/Silver ratio, which shows the number of ounces of Silver needed to equal the value of one ounce of Gold, may help to determine the relative valuation between both metals. Some investors may consider a high ratio as an indicator that Silver is undervalued, or Gold is overvalued. On the contrary, a low ratio might suggest that Gold is undervalued relative to Silver.