The main category of Forex News.
You can use the search box below to find what you need.
[wd_asp id=1]
The main category of Forex News.
You can use the search box below to find what you need.
[wd_asp id=1]
Silver price (XAG/USD) extends its losses for the third successive session, trading around $33.50 during Friday’s Asian hours. The downside of the precious metal Silver price could be attributed to the robust performance of the US Dollar (USD) and higher Treasury yields.
On Thursday, data indicated that US unemployment claims dropped significantly in late October, underscoring the strength of the labor market. Additionally, a rise in the S&P PMI further highlights robust momentum in the private sector.
The strong US economic data bolster the likelihood that the Federal Reserve (Fed) will take a less aggressive approach to interest rate cuts than previously thought. According to the CME FedWatch Tool, there is a 97% probability of a 25-basis-point rate cut by the Fed in November, with no expectation of a larger 50-basis-point cut.
Despite the challenges, safe-haven Silver may find upward support due to uncertainties surrounding the upcoming US presidential election. A recent Reuters/Ipsos poll showed that Vice President Kamala Harris holds a slight lead of 46% to 43% over former President Donald Trump in a six-day poll that closed on Monday.
Silver price may gain support from safe-haven flows amid uncertainties regarding the Middle East situation. Traders watch for Israel’s response to Iran’s missile attack on October 1. In parallel, US and Israeli officials are preparing to resume talks on a potential ceasefire and the release of hostages in Gaza in the coming days.
US Secretary of State Antony Blinken stated Thursday that the United States does not support a prolonged Israeli campaign in Lebanon, while France has advocated for an immediate ceasefire and diplomatic efforts.
Silver is a precious metal highly traded among investors. It has been historically used as a store of value and a medium of exchange. Although less popular than Gold, traders may turn to Silver to diversify their investment portfolio, for its intrinsic value or as a potential hedge during high-inflation periods. Investors can buy physical Silver, in coins or in bars, or trade it through vehicles such as Exchange Traded Funds, which track its price on international markets.
Silver prices can move due to a wide range of factors. Geopolitical instability or fears of a deep recession can make Silver price escalate due to its safe-haven status, although to a lesser extent than Gold’s. As a yieldless asset, Silver tends to rise with lower interest rates. Its moves also depend on how the US Dollar (USD) behaves as the asset is priced in dollars (XAG/USD). A strong Dollar tends to keep the price of Silver at bay, whereas a weaker Dollar is likely to propel prices up. Other factors such as investment demand, mining supply – Silver is much more abundant than Gold – and recycling rates can also affect prices.
Silver is widely used in industry, particularly in sectors such as electronics or solar energy, as it has one of the highest electric conductivity of all metals – more than Copper and Gold. A surge in demand can increase prices, while a decline tends to lower them. Dynamics in the US, Chinese and Indian economies can also contribute to price swings: for the US and particularly China, their big industrial sectors use Silver in various processes; in India, consumers’ demand for the precious metal for jewellery also plays a key role in setting prices.
Silver prices tend to follow Gold’s moves. When Gold prices rise, Silver typically follows suit, as their status as safe-haven assets is similar. The Gold/Silver ratio, which shows the number of ounces of Silver needed to equal the value of one ounce of Gold, may help to determine the relative valuation between both metals. Some investors may consider a high ratio as an indicator that Silver is undervalued, or Gold is overvalued. On the contrary, a low ratio might suggest that Gold is undervalued relative to Silver.
Gold price is on the back foot early Friday, as sellers return on a failure to find a strong foothold above the $2,740 static resistance yet again. Attention now turns toward a fresh batch of US economic data and speeches from US Federal Reserve (Fed) policymakers for a fresh direction impetus in Gold price.
Gold price extends its upside consolidative mode into the second consecutive day in Asian trading on Friday. However, it remains confined in a familiar range since the start of this week even after recxording a fresh lifetime high at $2,759 on Wednesday.
The Gold price action is divided between the increased expectations that the Fed will opt for a less aggressive easing policy in the coming months and uncertainty around the US presidential elections combined with rife Middle East geopolitical concerns.
Additionally, the US corporate earnings reports also play a pivot role in driving risk sentiment, and hence the safe-haven US Dollar (USD) and Gold price.
That said, the upcoming US Durable Goods Orders and preliminary Michigan Consumer Sentiment data could provide fresh hints on the state of the US economy, which could impact the Fed rate cut expectations and the US Dollar’s value in the near term.
Thus, Gold price could see a fresh direction move on the US data releases and a speech by Boston Fed president Susan Collins.
On Thursday, Gold price snapped its correction and rebounded 1% as the USD pulled back sharply with the US Treasury bond yields, as risk flows remained on Tesla’s earnings optimism while uncertainty in the run-up to the US election provided a fresh lift to Gold price.
Markets are pricing in a victory for the Republican nominee and the former US President Donald Trump in the presidential race, and his trade and fiscal policies are seen as inflationary, for which the Gold price could emerge as the go-to asset as a hedge against inflation.
Gold price has turned south once again to test the previous resistance now support at $2,723, the 23.6% Fibonacci Retracement (Fibo) level of the latest record rally from the October 10 low of $2,604 to an all-time high of $2,759.
A failure to defend that level on a daily candlestick closing basis could accelerate the declines toward the 38.2% Fibo level of the same ascent at $2,700.
Further south, the 50% Fibo support at $2,681 will be put to the test, near where the 21-day Simple Moving Average (SMA) closes in.
On the flip side, acceptance above the $2,740 static resistance is critical to resuming a sustained uptrend.
Gold buyers would then take on the $2,750 psychological barrier. The record high of $2,759 will be next on buyers’ radars.
The 14-day Relative Strength Index (RSI) is pointing lower but holds comfortable above the 50 level, currently trading near 65, suggesting that any decline in Gold price could be seen as a good dip-buying opportunity.
Gold has played a key role in human’s history as it has been widely used as a store of value and medium of exchange. Currently, apart from its shine and usage for jewelry, the precious metal is widely seen as a safe-haven asset, meaning that it is considered a good investment during turbulent times. Gold is also widely seen as a hedge against inflation and against depreciating currencies as it doesn’t rely on any specific issuer or government.
Central banks are the biggest Gold holders. In their aim to support their currencies in turbulent times, central banks tend to diversify their reserves and buy Gold to improve the perceived strength of the economy and the currency. High Gold reserves can be a source of trust for a country’s solvency. Central banks added 1,136 tonnes of Gold worth around $70 billion to their reserves in 2022, according to data from the World Gold Council. This is the highest yearly purchase since records began. Central banks from emerging economies such as China, India and Turkey are quickly increasing their Gold reserves.
Gold has an inverse correlation with the US Dollar and US Treasuries, which are both major reserve and safe-haven assets. When the Dollar depreciates, Gold tends to rise, enabling investors and central banks to diversify their assets in turbulent times. Gold is also inversely correlated with risk assets. A rally in the stock market tends to weaken Gold price, while sell-offs in riskier markets tend to favor the precious metal.
The price can move due to a wide range of factors. Geopolitical instability or fears of a deep recession can quickly make Gold price escalate due to its safe-haven status. As a yield-less asset, Gold tends to rise with lower interest rates, while higher cost of money usually weighs down on the yellow metal. Still, most moves depend on how the US Dollar (USD) behaves as the asset is priced in dollars (XAU/USD). A strong Dollar tends to keep the price of Gold controlled, whereas a weaker Dollar is likely to push Gold prices up.
Silver consolidated at around $33.60 as grey metal bulls failed to capitalize on falling US yields and a weak US Dollar. At the time of writing, XAG/USD is seesawing within a $1 range and virtually unchanged.
Silver price recovered some ground after falling to a four-day low of $33.25. The uptrend remains intact, and if buyers lift the XAG/USD spot price above $34.00 a troy ounce, they could challenge the year-to-date (YTD) high at $34.86.
Momentum backs buyers, with the Relative Strength Index (RSI) persisting in bullish territory.
If XAG/USD clears the YTD high, the next key resistance levels would be the October 2012 peak at $35.40, ahead of challenging the psychological $40.00, and the August 2011 high at $44.22.
Conversely, if the grey metal drops below $33.25, the next support would be $33.00. The break below could shift the bias to neutral, and if sellers drive Silver’s below October 17 low of $31.32, XAG/USD might reach the 50-day Simple Moving Average (SMA) at $30.64.
Silver is a precious metal highly traded among investors. It has been historically used as a store of value and a medium of exchange. Although less popular than Gold, traders may turn to Silver to diversify their investment portfolio, for its intrinsic value or as a potential hedge during high-inflation periods. Investors can buy physical Silver, in coins or in bars, or trade it through vehicles such as Exchange Traded Funds, which track its price on international markets.
Silver prices can move due to a wide range of factors. Geopolitical instability or fears of a deep recession can make Silver price escalate due to its safe-haven status, although to a lesser extent than Gold’s. As a yieldless asset, Silver tends to rise with lower interest rates. Its moves also depend on how the US Dollar (USD) behaves as the asset is priced in dollars (XAG/USD). A strong Dollar tends to keep the price of Silver at bay, whereas a weaker Dollar is likely to propel prices up. Other factors such as investment demand, mining supply – Silver is much more abundant than Gold – and recycling rates can also affect prices.
Silver is widely used in industry, particularly in sectors such as electronics or solar energy, as it has one of the highest electric conductivity of all metals – more than Copper and Gold. A surge in demand can increase prices, while a decline tends to lower them. Dynamics in the US, Chinese and Indian economies can also contribute to price swings: for the US and particularly China, their big industrial sectors use Silver in various processes; in India, consumers’ demand for the precious metal for jewellery also plays a key role in setting prices.
Silver prices tend to follow Gold’s moves. When Gold prices rise, Silver typically follows suit, as their status as safe-haven assets is similar. The Gold/Silver ratio, which shows the number of ounces of Silver needed to equal the value of one ounce of Gold, may help to determine the relative valuation between both metals. Some investors may consider a high ratio as an indicator that Silver is undervalued, or Gold is overvalued. On the contrary, a low ratio might suggest that Gold is undervalued relative to Silver.
Gold price recovered some ground on Thursday, trading as high as $2,743.15 a troy ounce by the end of the European session. The bright metal shed some ground after the United States (US) unveiled upbeat macroeconomic data, albeit demand for the US Dollar remains subdued.
XAU/USD eased after the US reported that Initial Jobless Claims rose by 227K in the week ended October 18, much better than the 242K expected. Even further, The flash US S&P Global October Composite PMI rose to 54.3 after printing at 54.0 final in September. Manufacturing activity improved to 47.8 from 47.3 in September, beating the anticipated 47.5. The services index printed at 55.3, up from 55.2 in the previous month and above the 55 forecast.
Still, the US Dollar has been unable to fully recover its upward poise, under pressure since early Asia amid mounting concerns about the outcome of the US presidential election. Meanwhile, Wall Street trades mixed. The Dow Jones Industrial Average (DJIA) sheds roughly 0.45% for the day, while the S&P500 and the Nasdaq Composite trade in the green.
Partially explaining USD near-term weakness are Treasury yields, retreating just modestly after reaching fresh multi-week peaks earlier in the week. At the time of writing, the 10-year note offers 4.20%, while the 2-year note yields 4.05%.
The macroeconomic calendar will include on Friday, US September Durable Goods Orders and the October Michigan Consumer Sentiment Index. Upbeat figures will likely give the USD a boost ahead of the weekly close.
The daily chart for the XAU/USD pair shows bulls retain control. Technical indicators resume their advances around weekly highs and after a modest downward correction, enough to erase overbought conditions. At the same time, the pair trades above bullish moving averages, with the 20 Simple Moving Average (SMA) currently hovering at around $2,670. At the same time, the pair found buyers around the 23.6% Fibonacci retracement of the $2,601.87/$2,756.36 rally at $2,721.20. The next relevant support level is 2,698.66, the 38.2% retracement of the same rally.
The 4-hour chart offers a neutral stance, although sellers are out of the picture. XAU/USD is hovering around a flat 20 SMA, but far above bullish 100 and 200 SMAs. The aforementioned 23.6% Fibonacci retracement provided near-term support during American trading hours, supporting additional gains ahead. Finally, technical indicators hover directionlessly around their midlines, not enough to define the next directional move.
Support levels: 2,721.20 2,708.50, 2,698.60
Resistance levels: 2,732.70 2,743.15 2,758.40
The 38.2% Fibonacci retracement at 2.52 was easily exceeded today putting natural gas in line to test resistance around 50% retracement at 2.615. That price area is strengthened by the 20-Day MA (purple), which is currently showing the same price level. The 20-Day line reflected support of the prior uptrend following the September 3 upside breakout of the line. It failed to maintain support once the price of natural gas closed below it on October 11. Now, it presents a potential area of resistance. Plus, once the 50-Day MA is cleared, as occurred today, the next moving average in the sequence becomes an upside target.
Nonetheless, since this week’s swing low was higher than the previous swing low, the current advance has the potential to eventually exceed the 50% retracement and target the 61.8% Fibonacci retracement at 2.71. An unfilled gap begins at 2.66 and goes to 2.72, filling right around the Fibonacci level. The top down trendline was successfully tested as resistance during the formation of the recent 3.02 swing high. That was essentially the third touch of the top trendline following the beginning of the line starting from the October 2023 peak. This identifies the line as solid resistance and indicates the potential for a sharp rally if it is exceeded to the upside.
Current price action is proceeding between two trendlines, resistance at the top and support at a new internal rising trendline connecting the August swing low with this week’s swing low. The intersection of the lines can tell us something about timing as they cross January 3, 2025. A vertical dotted line has been placed at the intersection. One of the two lines will be broken before then and that should tell us something about the strength or weakness of natural gas.
For a look at all of today’s economic events, check out our economic calendar.
Experts predict that on October 25, 10, coffee prices in the domestic market are expected to continue to increase in many localities, especially in the Central Highlands.
The strong USD has pushed down the prices of gold and crude oil. However, coffee has recovered after falling too much in the previous days. The market has seen resistance as new crop supplies from Vietnam have not yet joined the transaction.
Dealers said foreign demand for Vietnamese coffee is declining, as many countries have secured coffee supplies from other sources, especially as the EU’s deforestation regulation is expected to take effect by the end of 2024, a delay from the original plan.
Speculators are also reducing net long positions ahead of the harvest in the top robusta producing nation. world, which is expected to ramp up sales next month. The European Union’s (EU) delay in implementing its anti-deforestation law, the EUDR, has reduced the urgency for new deals, further dampening the market.
| Coffee price quote October 25, 10: Arabica coffee tends to recover, Robusta continues to fluctuate |
According to experts, in the world market, Arabica coffee prices are likely to recover strongly, while Robusta tends to continue to fluctuate.
Recorded in the trading session on October 24, 10, domestic coffee prices today decreased sharply by 2024 – 1.600 VND/kg, ranging from 1.900 – 109.400 VND/kg. Currently, the average purchase price in the Central Highlands provinces is 109.700 VND/kg, the highest purchase price in the province Dak Nong 109.700 VND/kg.
Specifically, the coffee purchase price in the province Gia Lai (Chu Prong) is 109.600 VND, down 1.800 VND/kg compared to yesterday, in Pleiku and La Grai the same price is 109.500 VND/kg; In the province Kon Tum at the price of 109.600 VND/kg, down 1.800 VND/kg compared to yesterday; In Dak Nong province, coffee was purchased at the highest price of 109.700 VND/kg, down 1.900 VND/kg compared to yesterday.
Price of green coffee beans (coffee beans, fresh coffee beans) in the province Lam Dong In districts such as Bao Loc, Di Linh, Lam Ha, coffee is purchased at 109.400 VND/kg, down 1.600 VND/kg compared to yesterday.
Coffee prices today (April 24) in the province Dak LakIn Cu M’gar district, coffee was purchased at about 109.600 VND/kg, down 1.800 VND/kg, while in Ea H’leo district and Buon Ho town, it was purchased at the same price of 109.700 VND/kg.
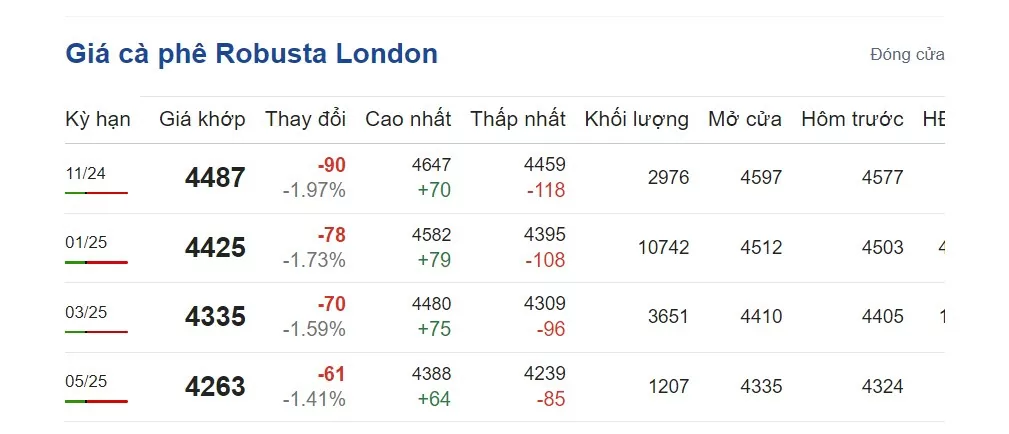
Updated world coffee prices at 20:00 p.m. on September 24, 10, Vietnam time on the London exchange, the price of Robusta coffee futures contract for September 2024 delivery on the London exchange was at 11 USD/ton, down 2024 USD compared to the beginning of the trading session.
 |
| Coffee prices today, July 24, 10: Robusta coffee prices on the London floor. (Photo: Screenshot from giacaphe.com |
Delivery term in November 1 is 2025 USD/ton, down 4.425 USD; Delivery term in January 78 is 3 USD/ton, down 2025 USD and delivery term in March 4.335 is 70 USD/ton, down 5 USD.
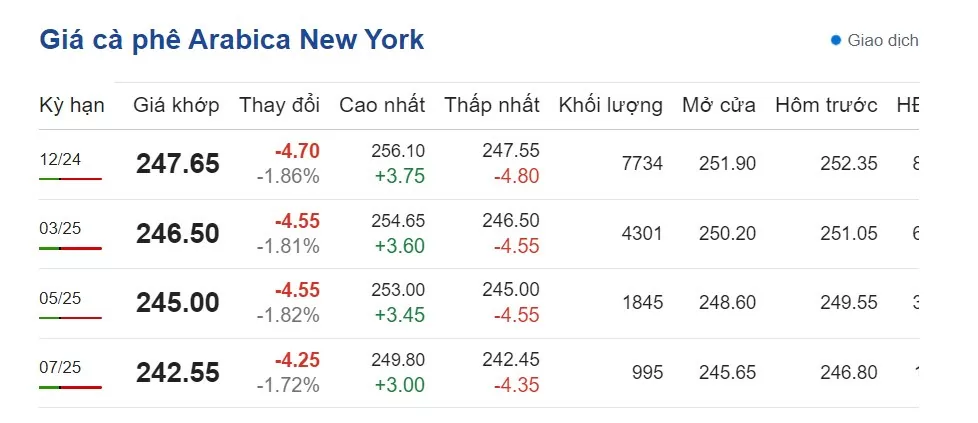 |
| Arabica coffee prices on the New York floor on October 24, 10. (Photo: Screenshot of giacaphe.com) |
In particular, the price of Arabica coffee on the New York floor today at 20:00 p.m. on September 24, 10 decreased in all terms, fluctuating at 2024 – 242.55 cents/lb.
Specifically, the delivery term in December 12 is 2024 cents/lb; down 247.65 cents/lb compared to the beginning of the session. March 4.70 delivery is 3 cents/lb, down 2025 cents/lb; Delivery period in May 246.50 is 4.55 cents/lb, down 5 cents/lb and delivery period in July 2025 is 245.00 cents/lb, down 4.55 cents/lb.
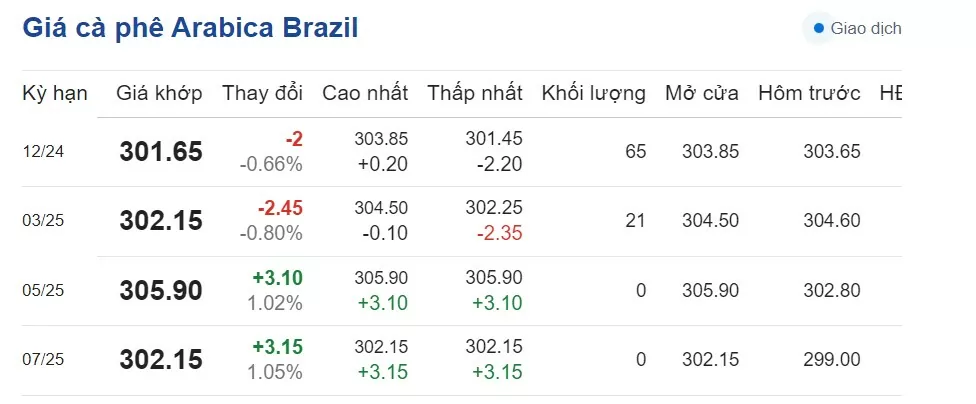 |
| Brazilian Arabica coffee price on October 24, 10. (Photo: Screenshot of giacaphe.com) |
The price of Brazilian Arabica coffee today at 21:00 p.m. on October 24, 10 increased and decreased in opposite directions. Specifically, the delivery period for December 2024 is 12 USD/ton, down 2024%; the delivery period for March 301.65 is 0.66 USD/ton, down 3%; the delivery period for May 2025 is 302.15 USD/ton, up 0.80% and the delivery period for July 5 is 2025 USD/ton, up 305.90%.
Robusta coffee traded on ICE Futures Europe (London floor) opens at 16:00 and closes at 00:30 (the next day), Vietnam time.
Arabica coffee on the ICE Futures US floor (New York floor) opens at 16:15 p.m. and closes at 01:30 a.m. (the next day), Vietnam time.
The 2023-2024 crop year ended with a supply-demand balance tilted towards a surplus of 1 million bags. However, the 2024-2025 coffee output is forecast to be heavily impacted by extreme weather factors. Therefore, coffee prices in the third quarter are expected to remain high, double that of the same period last year.
Industry insiders believe that coffee prices in the fourth quarter may be adjusted down due to additional supply from major coffee growing countries, including Vietnam.
*Information is for reference only, prices may vary depending on region and locality
Sources: https://congthuong.vn/du-bao-gia-ca-phe-ngay-25102024-ca-phe-arabica-co-chieu-huong-phuc-hoi-robusta-tiep-tuc-bien-dong-354536.html
The EUR/USD outlook leans south despite a short rebound as data revealed poor business activity in the Eurozone. However, the pair edged higher as the dollar eased amid uncertainty regarding the upcoming US presidential election.
–Are you interested to learn more about Australian forex brokers? Check our detailed guide-
Data on Thursday revealed that Eurozone business activity remained weak in October. The composite PMI came in at 49.7 compared to forecasts of 49.8. Figures below the 50 mark indicate contraction and weak economic demand. Consequently, market participants have increased bets for another European Central Bank rate cut in December. Markets are fully pricing a 25-bps rate cut in December.
However, ECB’s Christine Lagarde emphasized caution on Wednesday when deciding policy. However, other policymakers have expressed more dovish remarks. Nevertheless, the euro recovered Thursday while the dollar eased from recent peaks ahead of the US presidential election.
For weeks, the greenback has rallied as traders bet on a Trump win and higher inflation. However, a recent Reuters poll showed that Kamala Harris was in the lead, indicating a tight race. The uncertainty has caused some investors to pause and lock in profits before the election.
Meanwhile, market participants await more hints on the future of Fed policy. US unemployment claims will show whether demand remains high in the labor market, which could lower bets for a November rate cut. Meanwhile, PMI numbers will show the state of business activity.
The outlook for Fed policy has shifted to a more gradual one. Moreover, policymakers have assumed a more hawkish tone. Consequently, markets are placing a 29% chance that the central bank will cut rates only once more this year.
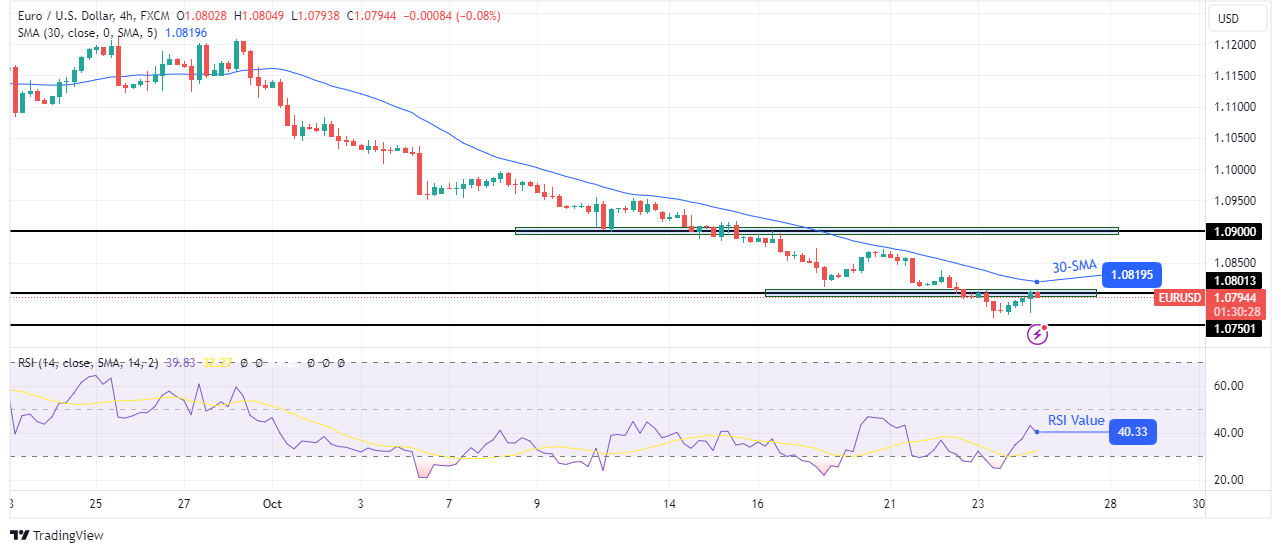
On the technical side, the EUR/USD price has rebounded to retest the 1.0801 key level. However, the downtrend remains intact since the price recently made a lower low. Moreover, it trades below the 30-SMA, with the RSI below 50, in bearish territory.
If you are interested in guaranteed stop-loss forex brokers, check our detailed guide-
Therefore, even if the uptrend continues, it might pause at the 30-SMA resistance. Here, the price will likely bounce lower to continue the downtrend beyond the 1.0750 level. However, if the price breaks above the SMA, the trend might reverse to the upside.
Looking to trade forex now? Invest at eToro!
68% of retail investor accounts lose money when trading CFDs with this provider. You should consider whether you can afford to take the high risk of losing your money.
In its latest short term energy outlook (STEO), which was released earlier this month, the U.S. Energy Information Administration (EIA) cut its West Texas Intermediate (WTI) oil price forecast for both 2024 and 2025.
According to that STEO, the EIA now sees the WTI spot price averaging $76.91 per barrel this year and $73.13 per barrel in 2025. The EIA’s previous STEO, which was released in September, projected that the WTI spot price would average $78.80 per barrel in 2024 and $79.63 per barrel in 2025. Both STEOs put the 2023 WTI spot price average at $77.58 per barrel.
In its latest STEO, the EIA forecast that the WTI spot price would come in at $71.97 per barrel in the fourth quarter of this year, $73.67 per barrel in the first quarter of 2025, $74.50 per barrel in the second quarter, $73.17 per barrel in the third quarter, and $71.22 per barrel in the fourth quarter.
The EIA’s September STEO projected that the WTI spot price would average $77.64 per barrel in the fourth quarter of this year, $79.02 per barrel in the first quarter of 2025, $80.50 per barrel across the second and third quarters of next year, and $78.50 per barrel in the fourth quarter of 2025.
A report sent to Rigzone by Standard Chartered Bank Head of Commodities Research Paul Horsnell late Tuesday revealed that the company is projecting that the NYMEX WTI basis nearby future crude oil price will average $84 per barrel in the fourth quarter of this year, $86 per barrel in the first quarter of 2025, $89 per barrel in the second quarter, $92 per barrel in the third quarter, and $90 per barrel in the fourth quarter.
A research note sent to Rigzone by the JPM Commodities Research team last week showed that J.P. Morgan expects the WTI crude price to average $76 per barrel in the fourth quarter, $78 per barrel in the first quarter of next year, $73 per barrel in the second quarter, $69 per barrel in the third quarter, and $65 per barrel in the fourth quarter.
Executives from oil and gas firms revealed where they expect the WTI crude oil price to be at various points in the future as part of the third quarter Dallas Fed Energy Survey.
The average response executives from 134 oil and gas firms gave when asked what they expect the WTI crude oil price to be at the end of 2024 was $72.66 per barrel, the survey showed. When asked where they expect WTI prices to be in six months, one year, two years, and five years, executives from 119 oil and gas firms gave a mean response of $73 per barrel for the six month mark, $76 per barrel for the year mark, $81 per barrel for the two year mark, and $87 per barrel for the five year mark, the survey outlined.
In a technical analysis of WTI prices sent to Rigzone on Wednesday, Rania Gule, a senior market analyst at XS.com, said, “from a technical perspective, crude oil prices are facing increasing pressures as markets shake off the impacts of the conflict in the Middle East and supply appears to be abundant”.
“To regain momentum, the price needs to surpass the pivotal level at $71.50 with a daily close, which would provide an opportunity to test the level of $75.13, a significant hurdle,” Gule added.
“On the downside, the support level at $67.12 should be monitored; if it is breached, the market could decline to the lowest level of 2024 at $64.75, followed by $64.38,” Gule warned.
In the analysis, Gule stated that, currently, the oil market is undergoing a sideways consolidation phase between $78.00 and $64.00, with the overall outlook leaning towards a neutral to bearish sentiment.
“Momentum indicators suggest a near-term corrective upward move that could reach $75.00 and $78.00 in the medium term, although the price remains below the 200-day simple moving average at $75.37,” Gule added.
To contact the author, email andreas.exarheas@rigzone.com
Bearish view
Bullish view
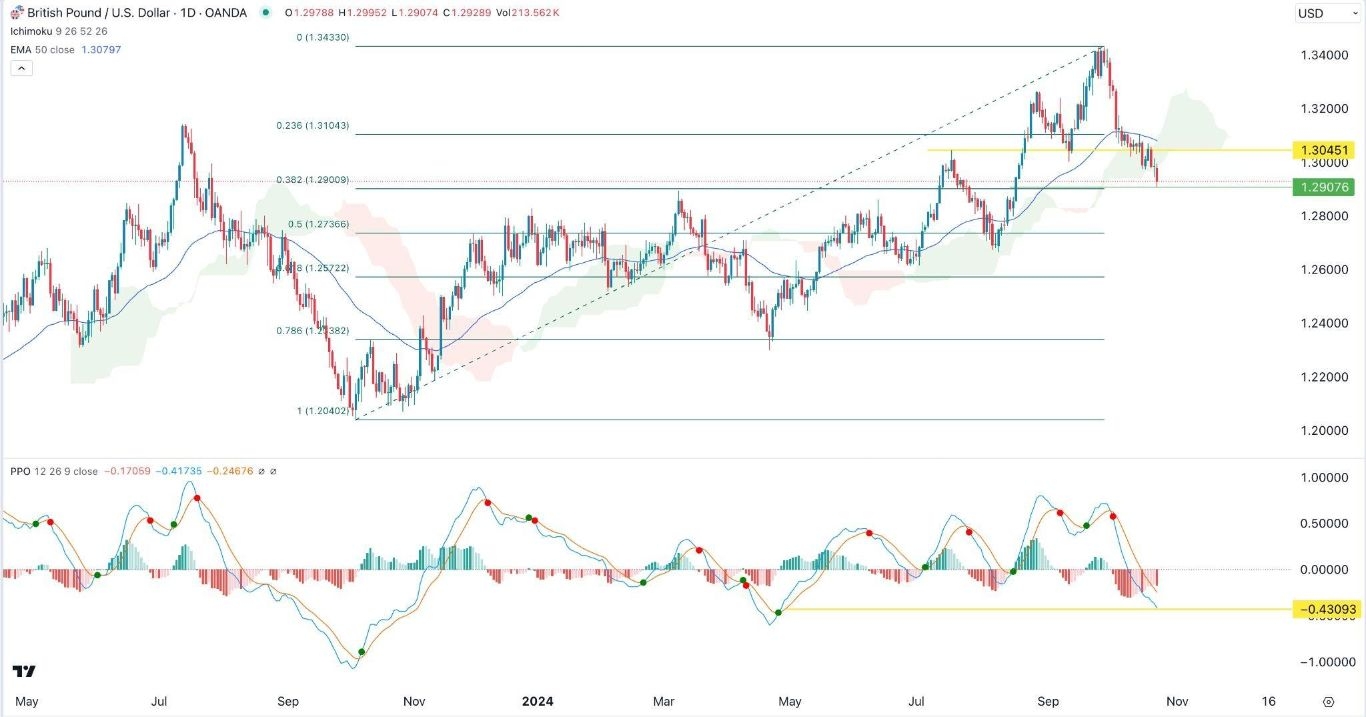
The GBP/USD pair retreated to a low of 1.2907, its lowest level since August 12. It has dropped by 3.80% from its highest level this year as the US dollar index jumped to a high of $104.56.

The GBP/USD pair continued its strong sell-off as traders waited for the upcoming flash manufacturing and services PMI numbers.
Economists expect the data to show that the UK manufacturing PMI rose to 51.5, while the services figure moved to 52.3 during the month.
If these numbers are correct, it will be a sign that the UK economy is doing modestly well since most countries are seeing a contraction of the manufacturing sector.
The report comes a week after numbers by the Office of National Statistics (ONS) published encouraging inflation and retail sales data. Inflation dropped to 1.7% in September from the previous 2.2%. Retail sales were stronger than expected during the month. Therefore, the BoE may opt for gradual easing of interest rates in the next few meetings.
The GBP/USD pair will next react to the upcoming flash PMIs from the United States. Analysts expect the numbers to show that the manufacturing PMI remained at 47.5, while the services figure was at 55.
The US will also publish the latest new home sales and initial jobless claims data. The jobless numbers are important because the Fed is focusing on the labor market when determining the size of the next interest rate cuts.
Economists have started to reprice the Federal Reserve expectations after the strong jobs numbers released last month. There are also concerns about the upcoming general election, which could see Donald Trump go back to the White House.
The GBP/USD exchange rate has continued its downward trend in the past few weeks. On the daily chart, the pair has moved below the Ichimoku cloud indicator.
The pair has moved below the 50-day moving average. It has also moved to the 38.2% Fibonacci Retracement point.
Also, the Percentage Price Oscillator (PPO) continued moving downwards and dropped to its lowest level since April. Therefore, the pair will likely continue falling as sellers target the 50% retracement point at 1.2135. A move above the resistance level at 1.3045 will invalidate the bearish view.
Ready to trade our daily Forex signal? Check out the best forex brokers in the UK worth using.
According to stock trading platforms, Japanese stocks fall amid market caution. Japan’s Nikkei 225 index fell 0.8% to 38,105 while the broader TOPIX lost 0.55% to 2,637 on Wednesday, reversing gains earlier in the session as caution gripped sentiment ahead of Japan’s general election this week.
Opinion polls have suggested the ruling Liberal Democratic Party could lose its majority with its coalition partner Komeito, raising concerns about political instability. Higher global bond yields also continued to weigh on stock markets, with the benchmark 10-year U.S. Treasury yield topping 4.2% amid strong economic data and concerns about the U.S. deficit.
In corporate news, shares in Tokyo Metro surged 45% in their debut on Wednesday after raising 348.6 billion yen in its initial public offering, Japan’s biggest in six years. Technology stocks led the decline, with notable losses from Disco Corp (-4.2%), Advantest (-1.1%) and Tokyo Electron (-1%).
In the US stock market, Dow Jones drops more than 600 points, Nasdaq falls 2%. According to trading, the three major US indexes closed sharply lower on Wednesday, as rising Treasury yields and concerns about a US interest rate cut weighed on investors as they digested another round of earnings. According to performance, the S&P 500 and Nasdaq fell 0.9% and 1.6%, respectively, while the Dow fell 4.9 points, its third straight losing session and its worst day in a month.
The 10-year Treasury yield was higher, reaching 4.25%, drivenby strong economic data and Fed officials sounding cautious about the pace of future US interest rate cuts. Tech giants Nvidia (-2.8%), Apple (-2.1%) and Qualcomm (-3.8%) also weighed. Tesla (-2%) fell ahead of its earnings after the closing bell, as investors closely watched for signs of stabilizing sales and progress in AI transformation.
In addition, Boeing (-1.8%) reported a big quarterly loss, and McDonald’s (-5.1%) faced pressure after its burgers were linked to an E. coli outbreak. In contrast, AT&T jumped 4.7% after its subscriber count rose more than expected.
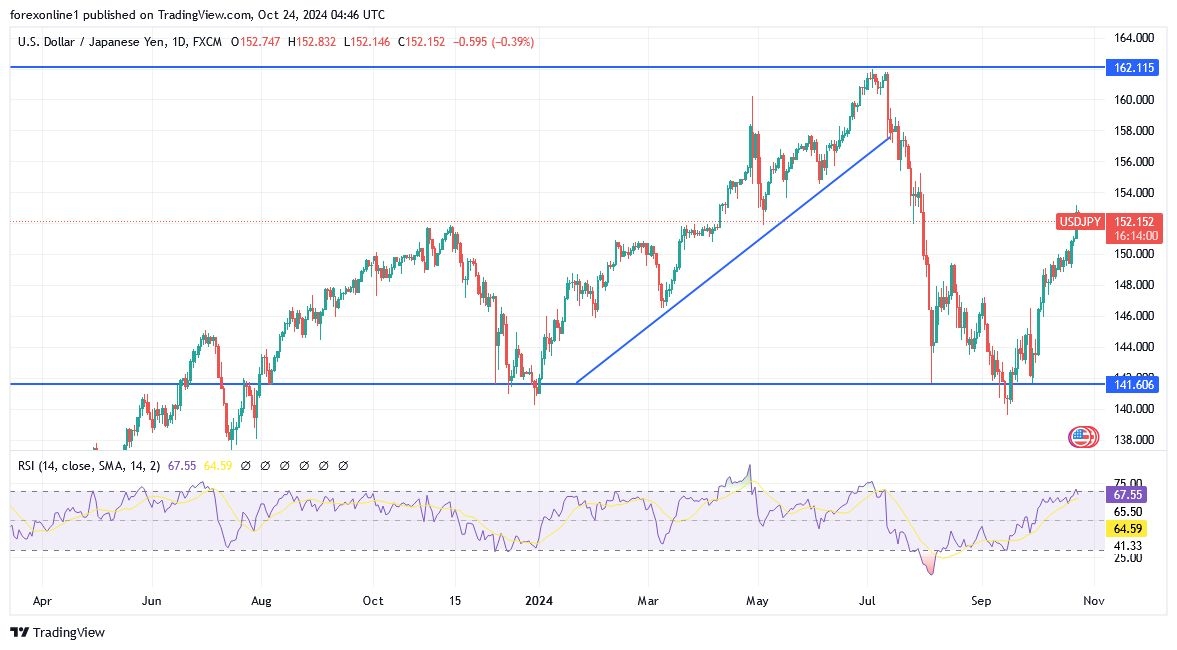
According to the performance on the daily chart, the general trend of the USD/JPY pair is still bullish, and its recent gains were enough to push the technical indicators towards strong overbought levels. Moreover, with the continued strength of the US dollar and the calming expectations regarding the future tightening of the Japanese central bank’s policy, the bulls may continue to control the trend and currently the closest resistance levels are 153.00, 153.85 and 154.60 respectively.
Ready to trade our Forex daily forecast? We’ve shortlisted the best FX trading platform in the industry for you.