The main category of Forex News.
You can use the search box below to find what you need.
[wd_asp id=1]
The main category of Forex News.
You can use the search box below to find what you need.
[wd_asp id=1]
The natural gas markets have rallied significantly during the course of the trading session on Friday, as we have broken above the $3 level, at least initially. That being said, there is a massive amount of resistance above as we had formed a double top back in June, so it’ll be interesting to see if we can get above there. The Relative Strength Index is in an overbought condition, so that also comes into the picture, but really when I look at this, the thing that I would pay the most attention to isn’t even on the chart. It’s the hurricane that just ripped through the Gulf of Mexico area.
The question is, did that damage and slow down production enough to drive prices higher? Probably in the short term, but I do recognize that we are getting much closer to the end of this run than we were at the beginning. I took profit yesterday, I’m okay with that. I don’t have any reason to chase this. If we break out to the upside, so be it, I’ll wave goodbye to the trend. Ultimately though, I do think we are about to hit a bit of a brick wall when it comes to resistance, and I think in that environment, you have to be very cautious.
The USD/JPY price analysis supports further downside as the yen rallies after Japan’s former defense minister, Shigeru Ishiba, won the seat for the next prime minister. Meanwhile, cooler-than-expected US inflation data weighed on the dollar.
–Are you interested in learning more about buying NFT tokens? Check our detailed guide-
Japan announced a new prime minister on Friday after a tight race. The outcome boosted the yen since Ishiba supports the current monetary policy moves. Therefore, he might continue supporting the Bank of Japan as it raises borrowing costs.
Although the last meeting was slightly cautious, economists expect at least one BoJ rate hike before the end of the year. Higher borrowing costs reduce the gap in rates between Japan and the US.
Elsewhere, market focus remained trained on the US core PCE report. The Federal Reserve recently cut interest rates by a massive 50-bps. It was a clear indication of confidence that inflation was under control. Therefore, policymakers expect price pressure to continue declining to the target.
Consequently, an unexpected figure could shift the outlook for future moves. Currently, there is a 50% chance of another massive reduction in November. Data on Friday revealed that inflation rose by 0.1%, smaller than the forecast of 0.2%. Therefore, the Fed has every reason to continue lowering borrowing costs.
Moreover, a soft landing is more likely since the economy remains resilient. Notably, data on Thursday showed that US unemployment claims dropped to 218,000 compared to expectations of 225,000. Another report revealed that corporate profits increased at a faster-than-expected rate.
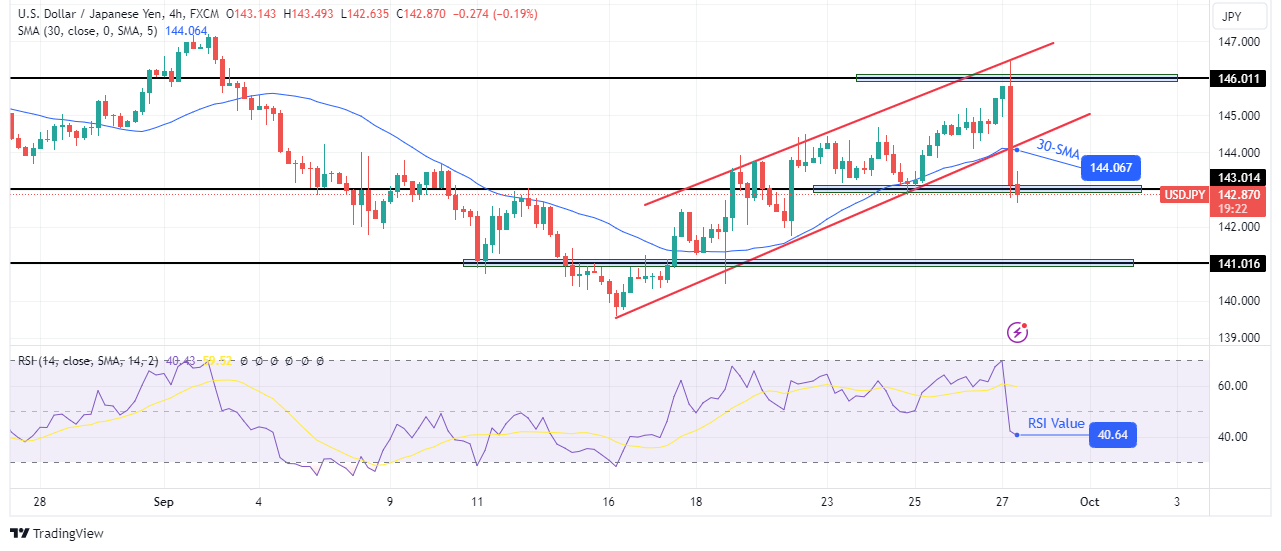
On the technical side, the USD/JPY price has broken out of its bullish channel with a bearish engulfing candle. At the same time, the price has broken below the 30-SMA, indicating a shift in sentiment. Meanwhile, the RSI has dropped below 50, into bearish territory.
-Are you looking for the best CFD broker? Check our detailed guide-
However, the decline has reached the 143.01 support level and might pause here before continuing lower. A pause could allow the price to retest the recently broken channel support. If bears remain in control, the price will likely break below 143.01 support to retest the 141.01 level.
Looking to trade forex now? Invest at eToro!
67% of retail investor accounts lose money when trading CFDs with this provider. You should consider whether you can afford to take the high risk of losing your money.
Currently, the 50-day EMA at $1.33586 offers some near-term support, while the 200-day EMA at $1.32425 provides a more substantial foundation. If GBP/USD breaks above $1.3389, it could shift momentum toward a bullish stance.
Conversely, a drop below $1.3360 may invite more selling pressure and extend losses.
The Euro trades cautiously as traders digest mixed French and Spanish inflation data. France’s Consumer Spending improved by 0.2%, but its Preliminary CPI fell to -1.2%. Meanwhile, Spain’s Flash CPI dropped to 1.5% YoY. German Unemployment Change jumped by 17K, indicating labor market weakness.
Investors are now focusing on the Italian 10-year bond auction and comments from German Buba President Nagel for further direction. Weaker employment data and softer inflation figures may keep the Euro under pressure.
The EUR/USD is trading at $1.11330, down 0.11%, and remains below the key pivot point of $1.11439. The pair is facing immediate resistance at $1.11573, with further upside barriers at $1.11730 and $1.11890.
On the downside, immediate support lies at $1.11221, with additional support at $1.11047 and $1.10921. The 50-day EMA sits at $1.11537, indicating that the pair is struggling to reclaim bullish momentum, while the 200-day EMA at $1.11181 offers some support.
Gold price treads water while within a striking distance of the new record high of $2,686, as buyers take a breather and consolidate the weekly gains in the countdown to the US Personal Consumption Expenditures (PCE) Price Index data release later on Friday.
Despite the recent dovish comments from US Federal Reserve (Fed) policymakers and mixed US economic data, market expectations for a 50 basis points (bps) interest rate cut in November ease, with the odds of such a move now standing at 50%, down from about 62% seen a day ago, the CME Group’s FedWatch Tool shows.
Fading bets of an outsized Fed rate cut at the next meeting seem to fuel a fresh US Dollar (USD) recovery, checking the record-setting rally in Gold price. However, Fed Governor Lisa Cook’s dovish remarks overnight and a risk-on market profile, courtesy of fresh Chinese stimulus measures, continue to limit the Gold price downside.
The next directional move in Gold price and the expectations of a large November Fed rate cut hinge on the upcoming Fed’s most preferred inflation gauge, the core PCE Price Index, due later in American trading on Friday. The US core PCE inflation is seen steady at 0.2% MoM in August while annually, the index is likely to tick higher a bit to 2.7% in the same period from July’s 2.6%.
A hotter-than-expected core PCE inflation data could push back expectations against a November rate reduction by the Fed, initiating a sustained recovery in the US Dollar against its major rivals from over one-yeat highs. In that case, a steep corrective decline could ensue in Gold price from near-lifetime highs. Conversely, a downside surprise in the core readings could ramp up the odds for a large Fed rate cut yet again, setting another record high in Gold price at the expense of the USD.
The reaction to the PCE inflation report, however, could be temporary as the end-of-the-month, as well as, the quarter-end flows could come into play and stir markets. Traders are also likely to resort to profit-taking in Gold price ahead of next week’s high-impact US Nonfarm Payrolls data.
Further, a speech by Fed Governor Michelle Bowman could add to the potential volatility around the Gold price.
Nothing changes for Gold price from a short-term technical perspective, as it remains in extremely overbought territory, suggesting that a meaningful correction could be in the offing.
The 14-day Relative Strength Index (RSI) is currently trading above the 76 level, warranting caution to buyers.
If buyers regain lost momentum, acceptance above the record high of $2,686 is critical to unleashing further upside toward the $2,700 barrier, followed by the $2,750 psychological mark.
Conversely, any correction in Gold price will likely test the September 24 low of $2,623, below which the $2,600 threshold will come into play.
Further south, Gold sellers could target the September 20 low of $2,585.
The Core Personal Consumption Expenditures (PCE), released by the US Bureau of Economic Analysis on a monthly basis, measures the changes in the prices of goods and services purchased by consumers in the United States (US). The PCE Price Index is also the Federal Reserve’s (Fed) preferred gauge of inflation. The YoY reading compares the prices of goods in the reference month to the same month a year earlier. The core reading excludes the so-called more volatile food and energy components to give a more accurate measurement of price pressures.” Generally, a high reading is bullish for the US Dollar (USD), while a low reading is bearish.
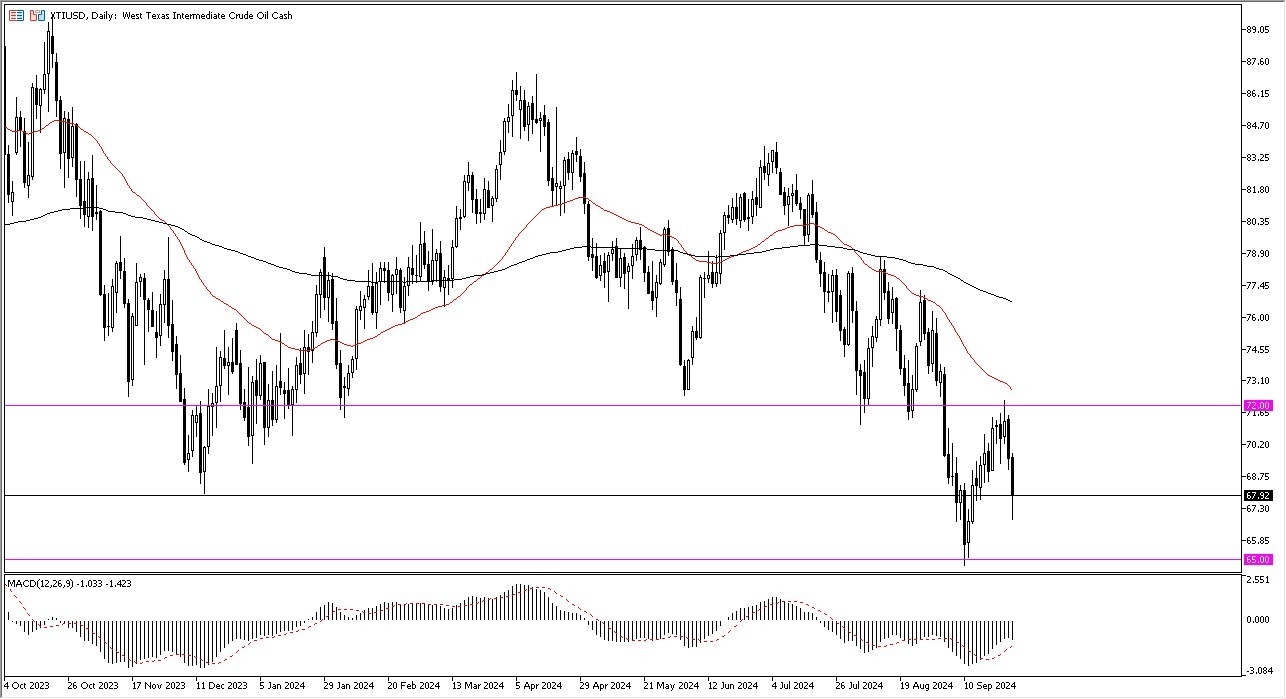
The Moving Average Convergence Divergence indicator is starting to show more momentum to the upside, while price had been dropping, so the question is now whether or not we are getting ready to form some type of bottoming pattern, which would make a certain amount of sense considering that the longer-term charts have shown that the $65 level has been massive support, at least over the last couple of years.

The crude oil market will continue to measure economic movement in the world, and of course potential demand. The employment situation in the United States continues to disintegrate, so it does suggest that perhaps there is going to be a certain amount of downward pressure in this market, as the demand for crude oil tends to fall when you start to see a bit of a recessionary type of market.
However, it’s worth noting that we have bounced quite a bit in the middle of the day, and therefore it’s likely that there is going to be plenty of support between here and the $65 level. If we were to break down below that $65 level, then it’s likely that the market could really start to fall apart, and I think it would also have a lot of negative influence on other markets as well, so the crude oil market is also worth paying close attention to as it can give you a bit of a “heads up” as to how the overall economic momentum continues to break in one direction or the other.
Ready to trade oil price analysis and predictions? Here are the best Oil trading brokers to choose from.
Silver (XAG/USD) extends the overnight modest pullback from the $32.70 area, or its highest level since December 2012 and remains under some selling pressure during the Asian session on Friday. The white metal, however, attracts some dip-buyers at lower levels and currently trades just below the $32.00 mark, down 0.25% for the day.
Meanwhile, technical indicators on the daily chart are holding comfortably in positive territory and are still away from being in the overbought zone. This, along with the recent breakout through a short-term descending trend-line resistance, favor bullish traders and suggests that the path of least resistance for the XAG/USD is to the upside. That said, Thursday’s failure to build on the momentum beyond the $32.45-$32.50 region warrants some caution.
The aforementioned area might continue to act as an immediate hurdle ahead of the overnight swing high, around the $32.70 area. Some follow-through buying should pave the way for a move towards reclaiming the $33.00 mark and lift the XAG/USD further towards the $33.45 intermediate hurdle en route to the December 2012 swing high, around the $33.85 region.
On the flip side, the $31.60-$31.55 zone now seems to have emerged as an immediate support. Any further decline could be seen as a buying opportunity around the $31.25 area and remain limited near the $31.00 mark. A convincing break below the latter could drag the XAG/USD to the $30.60-$30.55 zone en route to the $30.00 psychological mark and the $29.70-$29.65 area, or the descending trend-line resistance breakpoint, now turned support.
The latter now coincides with the 100-day Simple Moving Average (SMA) and should act as a key pivotal point. Failure to defend the said support levels will suggest that the XAG/USD has topped out and pave the way for a meaningful corrective decline in the near term.
Silver is a precious metal highly traded among investors. It has been historically used as a store of value and a medium of exchange. Although less popular than Gold, traders may turn to Silver to diversify their investment portfolio, for its intrinsic value or as a potential hedge during high-inflation periods. Investors can buy physical Silver, in coins or in bars, or trade it through vehicles such as Exchange Traded Funds, which track its price on international markets.
Silver prices can move due to a wide range of factors. Geopolitical instability or fears of a deep recession can make Silver price escalate due to its safe-haven status, although to a lesser extent than Gold’s. As a yieldless asset, Silver tends to rise with lower interest rates. Its moves also depend on how the US Dollar (USD) behaves as the asset is priced in dollars (XAG/USD). A strong Dollar tends to keep the price of Silver at bay, whereas a weaker Dollar is likely to propel prices up. Other factors such as investment demand, mining supply – Silver is much more abundant than Gold – and recycling rates can also affect prices.
Silver is widely used in industry, particularly in sectors such as electronics or solar energy, as it has one of the highest electric conductivity of all metals – more than Copper and Gold. A surge in demand can increase prices, while a decline tends to lower them. Dynamics in the US, Chinese and Indian economies can also contribute to price swings: for the US and particularly China, their big industrial sectors use Silver in various processes; in India, consumers’ demand for the precious metal for jewellery also plays a key role in setting prices.
Silver prices tend to follow Gold’s moves. When Gold prices rise, Silver typically follows suit, as their status as safe-haven assets is similar. The Gold/Silver ratio, which shows the number of ounces of Silver needed to equal the value of one ounce of Gold, may help to determine the relative valuation between both metals. Some investors may consider a high ratio as an indicator that Silver is undervalued, or Gold is overvalued. On the contrary, a low ratio might suggest that Gold is undervalued relative to Silver.
Higher-than-expected inflation figures may reduce investor bets on a 50-basis point November Fed rate cut. However, investors should also consider personal income/spending trends. Weaker personal income and spending could signal a softer inflation look, possibly fueling bets on a 50-basis point November Fed rate cut.
According to the CME FedWatch Tool, the probability of a 50-basis point Fed rate cut was 60.8% on Thursday, September 26.
Weaker-than-expected US data could push the USD/JPY down toward 143.5.
USD/JPY trends will hinge on inflation numbers from Tokyo and the US and central bank commentary. Hotter-than-expected inflation numbers for Tokyo could strengthen expectations of a Q4 2024 BoJ rate hike, possibly pushing the USD/JPY toward 143.5. However, the US Personal Income and Outlays Report also needs consideration amidst rising bets on a 50-basis point September Fed rate cut.
Investors should remain vigilant, with economic indicators and central bank commentary to dictate demand for the USD/JPY pair. Monitor real-time data, central bank views, and expert commentary to adjust your trading strategies accordingly. Stay ahead of the market with our expert insights.
The USD/JPY hovers below the 50-day and 200-day EMAs, confirming bearish price trends.
A USD/JPY breakout from 145 could give the bulls a run at the 145.891 resistance level. Furthermore, a break above the 145.891 resistance level could bring the 50-day EMA into play.
Central bank commentary and inflation figures from Japan and the US require consideration.
Conversely, a drop below the 143.495 support level could signal a fall toward 142.5. A fall through 142.5 may give the bears a run at the 141.032 support level.
The 14-day RSI at 52.10 indicates a USD/JPY climb to 147.5 before entering overbought territory.
A decisive decline below today’s low points to a deeper pullback. The most recent trend high price range of 2.67 to 2.65 marks the first potential support zone. It is followed by the 50% retracement of the most recent upswing at 2.55. The lower 61.8% Fibonacci retracement at 2.48 can be watched along with this week’s low at 2.46 and a prior interim swing high at 2.44. Together, they generate a potential support zone from 2.48 to 2.44.
Following a retracement and bullish reversal natural gas may have a chance to test the top trendline and possibly breakout through it. Otherwise, natural gas may continue to trade range bound within a relatively large developing symmetrical triangle. The bottom line of the triangle was tightened recently following the late-August higher swing low. That swing low marks a new and higher trendline for the bottom of a triangle.
Keep an eye on the internal uptrend line marking support of the most recent trend. The 20-Day MA has recently converged with the line. This is the markets way of telling us to pay attention to the line. Of course, the 20-Day MA also has significance as it shows the near-term trend strengthening. Also, the 50-Day MA has started confirming strength as it began to turn back up earlier this week.
Natural gas has been flirting with the 200-Day MA around a year ago. Each rally above the 200-Day line has gone only so far before the price of natural gas is pulled back to the line. The same thing may happen now. However, notice that the 200-Day line is now flat and that happens before a turn up.
For a look at all of today’s economic events, check out our economic calendar.
Silver price (XAG/USD) edges higher as China, the world’s largest metals market, announces plans for additional stimulus measures to bolster its economy, offsetting the diminishing effects of Tuesday’s earlier actions. Silver price trades around $32.00 per troy ounce during Thursday’s European hours.
China plans to inject over CNY 1 trillion in capital into its largest state banks, which are facing challenges such as shrinking margins, declining profits, and increasing bad loans. This substantial capital infusion would mark the first of its kind since the 2008 global financial crisis.
The safe-haven Silver also receives support from rising tensions in the Middle East. An Israeli airstrike on Beirut killed a senior Hezbollah commander on Tuesday, raising fears of a broader conflict as cross-border rocket attacks intensified.
Meanwhile, the United States, France, and several allies have called for an immediate 21-day ceasefire along the Israel-Lebanon border “Blue Line” and expressed support for a ceasefire in Gaza, following intense discussions at the United Nations on Wednesday.
The non-yielding Silver gained support following last week’s substantial 50 basis point rate cut by the US Federal Reserve (Fed). Moreover, rising expectations of additional Fed rate cuts in 2024 are enhancing the appeal of the commodity for investors amid low opportunity cost.
According to the CME FedWatch Tool, markets are currently pricing in a roughly 50% probability that the Fed will implement a total of 75 basis points in rate cuts, bringing rates down to a range of 4.0-4.25% by year’s end. This has weakened the US Dollar (USD), making Silver more affordable for buyers using other currencies and boosting demand for the dollar-denominated commodity.
Silver is a precious metal highly traded among investors. It has been historically used as a store of value and a medium of exchange. Although less popular than Gold, traders may turn to Silver to diversify their investment portfolio, for its intrinsic value or as a potential hedge during high-inflation periods. Investors can buy physical Silver, in coins or in bars, or trade it through vehicles such as Exchange Traded Funds, which track its price on international markets.
Silver prices can move due to a wide range of factors. Geopolitical instability or fears of a deep recession can make Silver price escalate due to its safe-haven status, although to a lesser extent than Gold’s. As a yieldless asset, Silver tends to rise with lower interest rates. Its moves also depend on how the US Dollar (USD) behaves as the asset is priced in dollars (XAG/USD). A strong Dollar tends to keep the price of Silver at bay, whereas a weaker Dollar is likely to propel prices up. Other factors such as investment demand, mining supply – Silver is much more abundant than Gold – and recycling rates can also affect prices.
Silver is widely used in industry, particularly in sectors such as electronics or solar energy, as it has one of the highest electric conductivity of all metals – more than Copper and Gold. A surge in demand can increase prices, while a decline tends to lower them. Dynamics in the US, Chinese and Indian economies can also contribute to price swings: for the US and particularly China, their big industrial sectors use Silver in various processes; in India, consumers’ demand for the precious metal for jewellery also plays a key role in setting prices.
Silver prices tend to follow Gold’s moves. When Gold prices rise, Silver typically follows suit, as their status as safe-haven assets is similar. The Gold/Silver ratio, which shows the number of ounces of Silver needed to equal the value of one ounce of Gold, may help to determine the relative valuation between both metals. Some investors may consider a high ratio as an indicator that Silver is undervalued, or Gold is overvalued. On the contrary, a low ratio might suggest that Gold is undervalued relative to Silver.
U.S. crude oil prices fell nearly 3% on Thursday on a report that Saudi Arabia is committed to pressing ahead with production increases later this year.
Saudi is prepared to ditch its unofficial oil price target of $100 per barrel, people familiar with the kingdom’s thinking told The Financial Times. Saudi officials are ready to increase oil production in December even if the move results in a prolonged period of low oil prices, the people said.
Here are Thursday’s closing energy prices:
Prices are also under pressure on the expectation that oil production will rise in Libya. Factions in the North African country reached a deal Wednesday to appoint a new central bank governor. A political dispute over who should lead the bank has led to production disruptions.
The prospect of rising production is set against a backdrop of soft demand in China, the world’s largest crude importer and second-largest consumer. Oil prices rallied earlier in the week after Beijing announced a new stimulus package.