The main category of Forex News.
You can use the search box below to find what you need.
[wd_asp id=1]
The main category of Forex News.
You can use the search box below to find what you need.
[wd_asp id=1]
Spot Gold hit $2,685.45 on Thursday, yet another record high. XAU/USD currently trades around $2,671 as investors keep selling the battered US Dollar (USD). The United States (US) published some macroeconomic encouraging figures, albeit nothing shocking. The numbers provided temporal support to the USD at the beginning of the American session, but the Greenback quickly resumed its decline.
The US reported that Initial Jobless Claims for the week ended September 20 rose by 218K, better than the 219K previous and the 225K expected. Also, the country confirmed an annualized pace of growth of 3% in the year to June, according to the final estimate of the Q2 Gross Domestic Product (GDP). Finally, Durable Goods Orders posted 0.0% in August, better than the -2.6% expected.
Meanwhile, multiple Federal Reserve (Fed) officials hit the wires in different events. Nevertheless, no one delivered fresh hints on monetary policy. In fact, most refrained from discussing it after cutting interest rates by a whopping 50 basis points (bps) when they met last week. Such silence left speculative interest in its belief that policymakers would deliver a similar trim in November.
Further harming the USD, Wall Street turned positive. After the back and forth offered in the first half of the week, US indexes seem to have found their way north.
The daily chart for XAU/USD shows it keeps posting higher lows and higher highs, supporting another leg north. Technical indicators, in the meantime, head firmly north within overbought levels, showing no signs of upward exhaustion yet, Meanwhile the pair keeps developing above firmly bullish moving averages which stand far below the current level. Overall, the risk of a downward correction has increased despite the lack of technical signs about it.
In the near term, and according to the 4-hour chart, it is clear that bulls retain control. An intraday slide met buyers around a bullish 20 Simple Moving Average (SMA), now providing dynamic support at around 2,650. At the same time, the 100 and 200 SMAs accelerated higher, far below the shorter ones, reflecting persistent upside strength. Finally, the Momentum indicator aims marginally higher within positive levels, while the Relative Strength Index (RSI) indicator retreats modestly from extreme overbought readings, drawing minor divergences. Such divergences seem not enough to support a decline but are a first warning about a potential decline in the upcoming sessions.
Support levels: 2,662.80 2,650.00 2,638.10
Resistance levels: 2,685.00 2,700.00 2,715.00
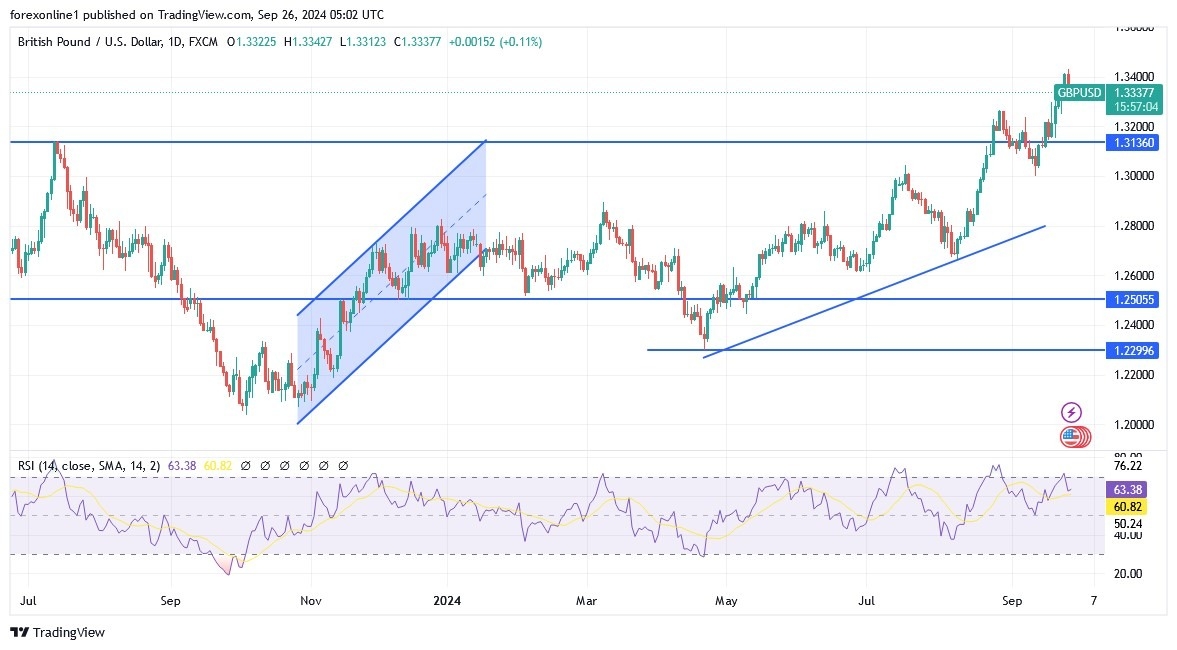
According to Forex trading, the recent rise in the pound has meant that it has reached overbought conditions against both the euro and the US dollar, with the Relative Strength Index (RSI) readings on the daily charts crossing the 70 level. The RSI rarely spends time above 70 (which is overbought) or below 30 (which is oversold) and the RSI is usually expected to return to the mean once these extremes are reached.
A period of neutrality or decline in the exchange rate will therefore bring the RSI back into balance, and we are seeing this in mid-week trading.
However, there is no news to support the pound’s decline and, in this regard, analyst Brad W. Bechtel, an analyst at investment bank Jefferies, said that Wednesday is expected to see end-of-month and quarter flows that will lead to volatility in the forex markets. He said: “We are at the end of the quarter this week and that is likely to start to drive the forex market more in the London morning and New York morning.”
The end of the quarter and month are approaching, which will require global portfolio managers to adjust recent developments in the foreign exchange market. Rebalancing could lead to significant volatility in the near term. “The turbulent third quarter for asset prices opens the door to a significant rebalancing at the end of the quarter,” said Robert Vollem, a Reuters market analyst. Bechtel believes that the end of September and the third quarter of 2024 could be characterized by a stronger US dollar given the weakness seen in recent weeks. “I would be surprised if we end up selling enough US dollars at the end of the quarter to push us through the 100 supports in the US dollar index,” it said. “In general, quarter-ends have been positive for the US dollar, so if anything, we are likely to return above 101 towards 102.”
The recovery in the US dollar index (DXY) – a measure of the overall performance of the US dollar – means that GBP/USD is under pressure again and the current appreciation trend could extend for six days.
Global equity markets are also weaker on Wednesday, which would typically impact the high beta pairs of GBP/USD, GBP/CHF and to some extent GBP/EUR.
Overall, the combination of overbought conditions, end-of-quarter flows and weaker markets are all conspiring against sterling. However, in the medium term, the same factors that have pushed sterling to recent highs remain in place, namely the Bank of England, which will only cut interest rates cautiously due to UK service sector inflation amid continued economic growth. In its latest World Economic Outlook, the OECD said the UK economy is on track to expand by 1.1% this year, up 0.7 percentage points from its last forecast in May.
The UK was among a group of countries that recorded “strong” growth rates this year, she said, having rebounded strongly from a mild recession at the end of 2023.

There are also no major concerns about global stock markets, and the weakness should be short-lived now that the Federal Reserve has begun its easing cycle, which could help the pound. The GBP/USD price will be affected today by the announcement of the US economic growth reading, along with the number of weekly jobless claims and US durable goods orders, in addition to the most important statements from a number of US central bank policy officials led by Jerome Powell.
Ready to trade our GBP/USD daily analysis and predictions? Here’s the best forex trading company in UK to trade with
According to licensed trading platforms, the end of the quarter and month is approaching, which will require global portfolio managers to adjust recent developments in the foreign exchange market. The rebalancing could lead to significant volatility in the near term. Brad Bechtel, an analyst at Jefferies said, “We’re approaching the end of the quarter this week and that’s likely to start driving the FX market more strongly tomorrow morning in London and New York,”
The US dollar had declined against most of its G10 peers in September, but the bigger and more important story for end-of-month flows is the significant rally in global equity markets. Commenting on this, Robert Vollem, a market analyst at Reuters, says, “The turbulent third quarter for asset prices opens the door for significant rebalancing at the end of the quarter.” Bechtel believes that the end of September and the third quarter of 2024 could be characterized by US dollar strength given the weakness seen in recent weeks. He stated, “I would be surprised if we ended up selling enough dollars at the end of the quarter to push us below the 100 level on the US Dollar Index, and generally, quarter-ends have been positive for the US dollar, so we’re likely to return to above 101 towards 102.”
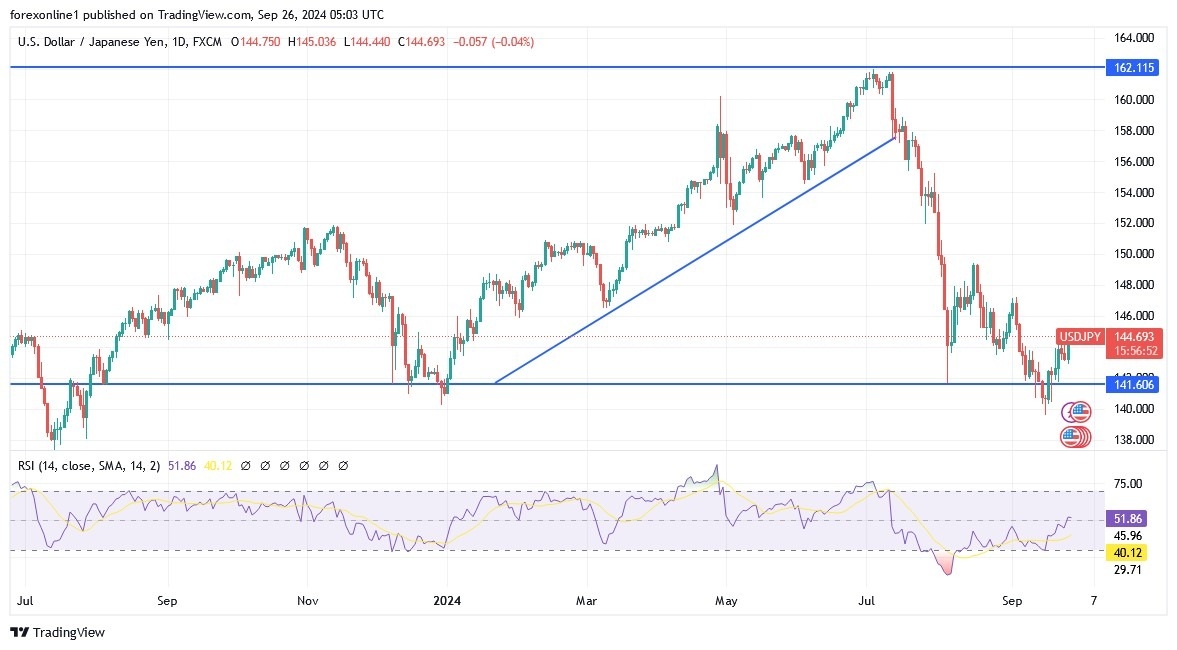
The recovery in the US Dollar Index (DXY) – a measure of the overall performance of the US dollar – means that the USD/JPY pair may extend its current six-day appreciation trend. Looking ahead to October, the yen’s recovery against the US dollar is not necessarily over. Also, the analyst believes that a move in the USD/JPY below 141.75 would put its lowest level since the beginning of the year at 139.58 into consideration, while a close above 145.55 would target September’s high of 147.20.
The Japanese yen fell at the end of last week after the Bank of Japan appeared to waver in its commitment to further interest rate hikes and end its ultra-easy monetary policy. For its part, the Bank of Japan left its benchmark interest rate unchanged at 0.25%, and the guidance showed an upbeat outlook for the economy and a commitment to further rate hikes. However, “what is striking is the lack of explicit guidance in today’s statement. In July, it stated that the BOJ would continue to raise rates if inflation develops as expected. While the statement can still be read in this way, it is no longer explicit.” Added, “This confirms our view that the situation in Japan is not as clear-cut as the BOJ sometimes wants us to believe.”
The market reaction suggests that investors agree, believing that the BOJ may be softening its commitment to raising rates, which could deprive the yen of a major source of support. As a result, the Japanese currency fell against all of its G10 peers.
Despite the recent gains of the USD/JPY pair, the pair is still at the beginning of an upward trend-breaking phase. Moreover, this could succeed if it moves towards the resistance levels of 147.60 and 150.00, respectively. Conversely, and on the same timeframe, a move below the support level of 141.80 will be important for the continued strength of the bears’ control over the trend. The USD/JPY price today will be influenced by the announcement of a package of important US economic releases as well as statements by a number of US Federal Reserve policymakers, led by Governor Jerome Powell.
Want to trade our daily forex analysis and predictions? Here’s a list of forex brokers in Japan to check out.
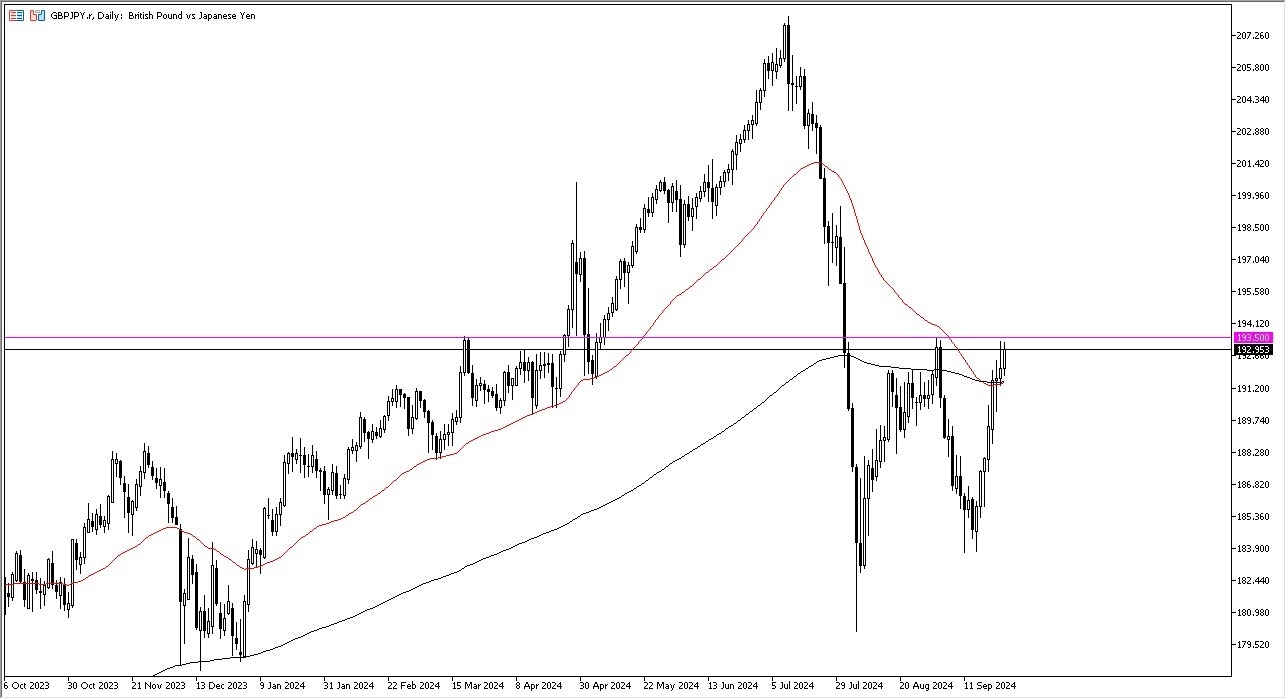
The 193.50 yen level is an area that’s been important multiple times in the past, and the fact that we find ourselves in that general vicinity at the moment does suggest that we are likely to continue to see more of a buy on the at least in the short term.
If the market truly takes off above that level, then I could see the British pound traveling all the way to the 198.50 yen level and possibly even higher than that. Keep in mind that the interest rate situation in Japan is very low and it more likely than not will stay there. Their last interest rate decision was to do nothing. And it’s very possible that you have a situation where traders continue to look at the massive amount of debt in Japan, keeping the Bank of Japan from raising rates.
So, all things being equal, the W pattern here, I think suggests that we are in the midst of a bottoming pattern as well. The measured move, if you will, is for about 5.5% on a breakout, and that could actually put us as high as 204 yen, but I think that’s a longer term grinding kind of just bouncing around and buying the dip on short term charts type of trend. I don’t have any interest in shorting this pair, at least not at the moment. If nothing else, I will be hanging on to this position in order to collect swap for the longer-term run.
Want to trade our daily forex analysis and predictions? Here’s a list of forex brokers in Japan to check out.
The GBP/USD forecast shows a sudden shift in sentiment to bearish as the dollar recovers from a 14-month low. At the same time, the pound was weak as recent economic data pointed to a dimmer outlook.
–Are you interested in learning more about buying NFT tokens? Check our detailed guide-
The dollar recovered against most currencies on Wednesday and Thursday as investors sought safety amid rising Middle East tensions. The conflict between Hezbollah and Israel in Lebanon has escalated, with the two groups exchanging missiles. The US and other partners announced they were working tirelessly to avoid a full-blown war between the two.
Despite the dollar’s rebound, fundamentals point to more downside. The Fed recently cut interest rates by a massive 50-bps, starting a long-awaited easing cycle. The rate cut sent the greenback to fresh lows before it recovered. However, the US central bank flagged more rate cuts to come. As a result, market participants are pricing a 59% chance of another 50-bps rate cut in November.
Nevertheless, incoming data will continue to shape this outlook. The next major report is the core PCE index, which will show the state of inflation. Market participants will also watch GDP data later today.
On the other hand, the pound fell after data in the previous session revealed a significant drop in UK consumer sentiment. The figure fell from -8 to -21 in September. Moreover, it came after soft business activity data showed a slowdown in the economy. Still, sterling has gained about 5.4% against the dollar this year as the Bank of England delays rate cuts.
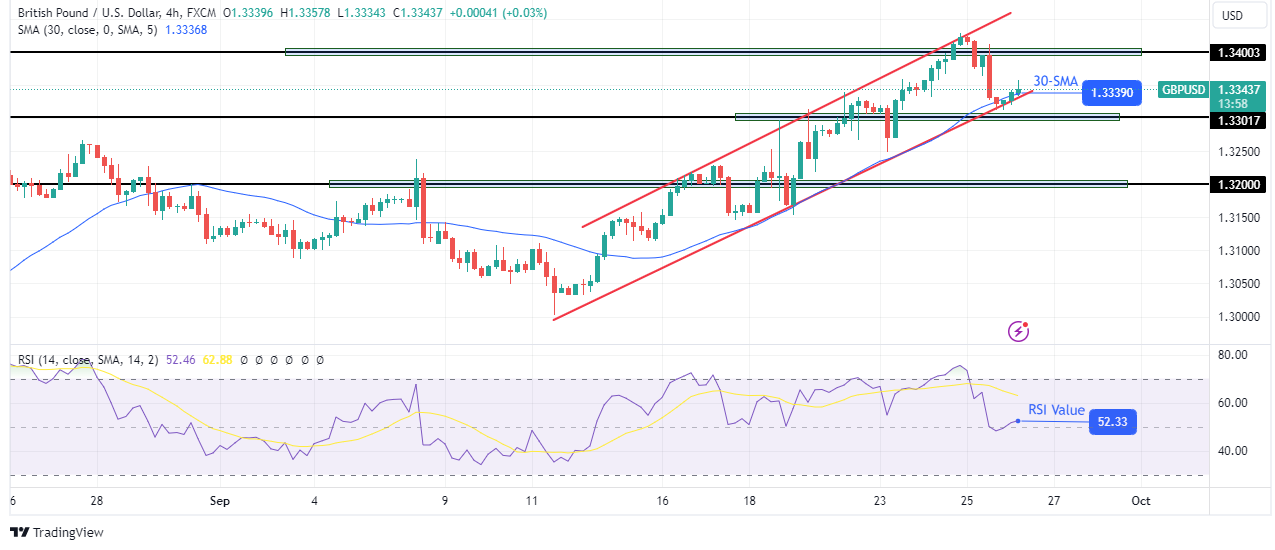
On the technical side, the GBP/USD price is trading in a tight, bullish channel with clear support and resistance lines. The price recently fell to the channel support after failing to sustain a move above the 1.3400 key level.
-Are you looking for the best CFD broker? Check our detailed guide-
The decline has paused at the support line, which coincides with the 30-SMA. Therefore, it might bounce higher to make a new high above 1.3400. However, if bears are strong enough to break below the support zone, the price might revisit the 1.3200 support level.
Looking to trade forex now? Invest at eToro!
67% of retail investor accounts lose money when trading CFDs with this provider. You should consider whether you can afford to take the high risk of losing your money.
However, a break below $1.33132 could see the pair retesting support at $1.32869, with additional downside targets at $1.32621 and $1.32349.
The 50-day EMA at $1.33547 acts as resistance, while the 200-day EMA at $1.32849 offers a strong support cushion.
For now, the outlook remains bullish above the pivot point, but a break lower could quickly shift sentiment.
The euro (EUR) held steady after the German GfK Consumer Climate improved to -21.2, slightly better than the expected -22.4, signalling some stabilization in consumer sentiment.
The ECB Economic Bulletin highlighted ongoing economic challenges, while M3 Money Supply growth at 2.5% and Private Loans at 0.6% showed modest improvements.
Markets are now closely watching ECB President Lagarde’s speech for further insights into future monetary policy.
The EUR/USD is trading at $1.11392, up 0.07% during today’s session, but it’s facing key resistance near $1.11573. The pair has been struggling to gain traction, with the pivot point set at $1.11439.
A break above this level could signal further upward momentum, targeting immediate resistance levels at $1.11685 and $1.11792.
GBP/JPY formed a Hammer candlestick reversal pattern at the September 11 lows and has been pushing higher ever since. It has had an extra left on Thursday following the Bank of England (BoE) interest rate decision.
A new short-term uptrend appears to have formed and is carrying GBP/JPY higher. It is currently hitting support-turned-resistance at 190.34 and could stall. If it decisively breaks higher it will probably target the 50 and 200-day Simple Moving Averages at 192.08 and 190.34 respectively. These are likely to produce even more resistance and may be difficult to break above.
The medium-term trend is sideways and chaotic providing no hints as to where the underlying current is flowing.
This suggests caution should be exercised by traders as price could flip at any moment and start moving in the opposite direction.
Silver (XAG/USD) struggles to gain any meaningful traction and oscillates in a narrow trading band, around the $31.80-$31.85 region during the Asian session on Thursday. The white metal, meanwhile, remains within the striking distance of a four-month peak touched on Wednesday and seems poised to prolong the upward trajectory witnessed over the past two weeks or so.
From a technical perspective, the overnight sustained strength beyond the $31.40-$31.45 supply zone comes on the back of the recent breakout through a short-term descending trend-line resistance. This, along with the fact that oscillators on the daily chart are holding comfortably in positive territory and are still away from being in the overbought zone, validates the positive outlook and suggests that the path of least resistance for the XAG/USD is to the upside.
Hence, a subsequent move beyond the $32.00 mark, towards retesting a one-decade top, around mid-$32.00s touched in May, looks like a distinct possibility. Some follow-through buying should pave the way for a further appreciating move towards conquering the $33.00 round-figure mark for the first time since December 2012.
On the flip side, weakness below the overnight swing low, around the $31.60-$31.55 region, is likely to find some support near the $31.25 area ahead of the $31.00 mark. A convincing break below the latter could drag the XAG/USD to the $30.60-$30.55 zone. The downfall could extend further towards the $30.00 psychological mark before the white metal drops to the $29.70-$29.65 area, or the descending trend-line resistance breakpoint, now turned support.
The latter now coincides with the 100-day Simple Moving Average (SMA) and should act as a key pivotal point, which if broken decisively will suggest that the XAG/USD has topped out in the near term and pave the way for a deeper corrective decline.
Silver is a precious metal highly traded among investors. It has been historically used as a store of value and a medium of exchange. Although less popular than Gold, traders may turn to Silver to diversify their investment portfolio, for its intrinsic value or as a potential hedge during high-inflation periods. Investors can buy physical Silver, in coins or in bars, or trade it through vehicles such as Exchange Traded Funds, which track its price on international markets.
Silver prices can move due to a wide range of factors. Geopolitical instability or fears of a deep recession can make Silver price escalate due to its safe-haven status, although to a lesser extent than Gold’s. As a yieldless asset, Silver tends to rise with lower interest rates. Its moves also depend on how the US Dollar (USD) behaves as the asset is priced in dollars (XAG/USD). A strong Dollar tends to keep the price of Silver at bay, whereas a weaker Dollar is likely to propel prices up. Other factors such as investment demand, mining supply – Silver is much more abundant than Gold – and recycling rates can also affect prices.
Silver is widely used in industry, particularly in sectors such as electronics or solar energy, as it has one of the highest electric conductivity of all metals – more than Copper and Gold. A surge in demand can increase prices, while a decline tends to lower them. Dynamics in the US, Chinese and Indian economies can also contribute to price swings: for the US and particularly China, their big industrial sectors use Silver in various processes; in India, consumers’ demand for the precious metal for jewellery also plays a key role in setting prices.
Silver prices tend to follow Gold’s moves. When Gold prices rise, Silver typically follows suit, as their status as safe-haven assets is similar. The Gold/Silver ratio, which shows the number of ounces of Silver needed to equal the value of one ounce of Gold, may help to determine the relative valuation between both metals. Some investors may consider a high ratio as an indicator that Silver is undervalued, or Gold is overvalued. On the contrary, a low ratio might suggest that Gold is undervalued relative to Silver.
Gold price extends its consolidative mode just below the record high reached near $2670 on Wednesday, as buyers turn cautious in the lead-up to a raft of speeches from US Federal Reserve (Fed) policymakers due later on Thursday.
Amongst several Fed officials taking up the rostrum, Fed Chairman Jerome Powell’s pre-recorded opening remarks will hold the key for gauging the size of the next interest rate cut, especially with markets pricing in about a 62% chance that the Fed will reduce the rate by another 50 basis points (bps) in November.
The dovish Fed outlook was further endorsed by the recent commentary from Fed Governor Adriana Kuglar, who said during her overnight appearance that she “strongly supported” the Fed’s decision to cut the interest rates by a half point last week. Kugler added that she “will support additional rate cuts going forward.”
Recent Fedspeak combined with weak US Conference Board (CB) Consumer Confidence and regional activity data ramped up bets for another jumbo rate cut by the Fed at its next policy meeting.
The Fed’s dovishness and China’s stimulus optimism re-emerge early Thursday, checking the previous recovery in the US Dollar (USD) and the US Treasury bond yields while fuelling a minor Gold price uptick. The fate of Gold price hinges on the upcoming Fed commentaries, as traders refrain from placing further bets amid extremely overbought conditions on the daily chart.
Ahead of the Fedspeak, the US Durable Goods Orders, final Q2 Gross Domestic Product (GDP) and the weekly Jobless Claims will provide some trading incentives to Gold price. Risk sentiment will also play a pivotal role, as the focus will shift to Friday’s US Personal Consumption Expenditures (PCE) Price Index release after Powell’s remarks.
Gold price staged a temporary pullback from all-time highs, as the US Dollar staged an impressive rebound from 14-month lows against its major rivals on fading Chinese stimulus-led market optimism. Traders also resorting to taking profits on the USD shorts ahead of the key speech by Fed Chair Jerome Powell.
Nothing changes for Gold price from a short-term technical perspective, as it remains in extremely overbought territory, suggesting that a meaningful correction could be in the offing.
The 14-day Relative Strength Index (RSI) flirts with the 76 level, at the moment.
If buyers regain lost momentum, acceptance above the record high near $2,670 is critical to unleashing further upside toward the $2,700 barrier.
Conversely, any correction in Gold price will likely test the September 24 low of $2,623, below which the $2,600 threshold will come into play.
Further south, Gold sellers could target the September 20 low of $2,585.
Gold has played a key role in human’s history as it has been widely used as a store of value and medium of exchange. Currently, apart from its shine and usage for jewelry, the precious metal is widely seen as a safe-haven asset, meaning that it is considered a good investment during turbulent times. Gold is also widely seen as a hedge against inflation and against depreciating currencies as it doesn’t rely on any specific issuer or government.
Central banks are the biggest Gold holders. In their aim to support their currencies in turbulent times, central banks tend to diversify their reserves and buy Gold to improve the perceived strength of the economy and the currency. High Gold reserves can be a source of trust for a country’s solvency. Central banks added 1,136 tonnes of Gold worth around $70 billion to their reserves in 2022, according to data from the World Gold Council. This is the highest yearly purchase since records began. Central banks from emerging economies such as China, India and Turkey are quickly increasing their Gold reserves.
Gold has an inverse correlation with the US Dollar and US Treasuries, which are both major reserve and safe-haven assets. When the Dollar depreciates, Gold tends to rise, enabling investors and central banks to diversify their assets in turbulent times. Gold is also inversely correlated with risk assets. A rally in the stock market tends to weaken Gold price, while sell-offs in riskier markets tend to favor the precious metal.
The price can move due to a wide range of factors. Geopolitical instability or fears of a deep recession can quickly make Gold price escalate due to its safe-haven status. As a yield-less asset, Gold tends to rise with lower interest rates, while higher cost of money usually weighs down on the yellow metal. Still, most moves depend on how the US Dollar (USD) behaves as the asset is priced in dollars (XAU/USD). A strong Dollar tends to keep the price of Gold controlled, whereas a weaker Dollar is likely to push Gold prices up.
The July monetary policy decision coincided with a marked shift in sentiment toward the Fed rate path, leading to a ‘Yen carry trade unwind.’ The USD/JPY dropped from a July 31 opening price of 152.748 to an August 5 low of 141.684, impacting the global financial markets, including crypto.
XRP, for instance, tumbled 25.7% during the same period, reflecting the widespread impact of the ‘Yen carry trade unwind.’
While the minutes are dated, considering the BoJ’s September monetary policy decision, they may give insights into the BoJ’s stance on interest rates, the Fed rate path, and market disruption.
The USD/JPY and the global markets could be exposed to another Yen carry trade unwind if the BoJ focuses more on price stability than the Fed rate path and market conditions.
Since July, BoJ Board members have suggested a willingness to raise rates higher if inflation and the economy align with forecasts. However, BoJ Governor Ueda recently downplayed any urgency to lift rates. Nevertheless, hawkish minutes would align with recent Board Member’s insights, possibly supporting a USD/JPY move toward 142.
Recent inflation figures have fueled speculation about a Q4 2024 BoJ rate hike. In reaction to August’s national inflation figures, PGIM Alternatives CIO Aniruddha Naha stated,