The main category of Forex News.
You can use the search box below to find what you need.
[wd_asp id=1]
The main category of Forex News.
You can use the search box below to find what you need.
[wd_asp id=1]
The Pound Sterling lost some steam against the US Dollar in early trading during Wednesday’s North American session after hitting a yearly peak of 1.3429. The GBP/USD trades at 1.3389, down 0.18%, as the Greenback recovers some ground.
From a technical standpoint, the GBP/USD pullback toward the top of an ascending channel at 1.3363 opened the door for further buying, as seen by price action.
The Relative Strength Index (RSI) hints that buyers remain in charge. However, in the short term, the GBP/USD might print another leg-down before resuming its rally, which could put the March 1, 2022, peak at 1.3437 to the test.
If GBP/USD remains above 1.3363, this could pave the way to challenge the current yearly high of 1.3429. On further strength, that will expose 1.3437, followed by the 1.3450 figure, ahead of 1.3500.
Conversely, if the pair slumps past 1.3363, it could hit the current week’s low of 1.3248. On further weakness, the bulls’ following line of defense will be the September 19 daily low of 1.3153.
The table below shows the percentage change of British Pound (GBP) against listed major currencies today. British Pound was the strongest against the Japanese Yen.
| USD | EUR | GBP | JPY | CAD | AUD | NZD | CHF | |
|---|---|---|---|---|---|---|---|---|
| USD | 0.06% | 0.29% | 0.79% | 0.20% | 0.43% | 0.60% | 0.66% | |
| EUR | -0.06% | 0.24% | 0.74% | 0.14% | 0.37% | 0.56% | 0.59% | |
| GBP | -0.29% | -0.24% | 0.48% | -0.10% | 0.13% | 0.28% | 0.36% | |
| JPY | -0.79% | -0.74% | -0.48% | -0.58% | -0.35% | -0.19% | -0.13% | |
| CAD | -0.20% | -0.14% | 0.10% | 0.58% | 0.23% | 0.41% | 0.46% | |
| AUD | -0.43% | -0.37% | -0.13% | 0.35% | -0.23% | 0.19% | 0.23% | |
| NZD | -0.60% | -0.56% | -0.28% | 0.19% | -0.41% | -0.19% | 0.05% | |
| CHF | -0.66% | -0.59% | -0.36% | 0.13% | -0.46% | -0.23% | -0.05% |
The heat map shows percentage changes of major currencies against each other. The base currency is picked from the left column, while the quote currency is picked from the top row. For example, if you pick the British Pound from the left column and move along the horizontal line to the US Dollar, the percentage change displayed in the box will represent GBP (base)/USD (quote).
If resistance continues to hold natural gas may pull back a bit before preparing for a continuation higher. It broke out of a bullish double bottom pattern two weeks ago on a move above 2.30. That advance also triggered a bullish reversal on the monthly chart. Further signs of strength were indicated as the rally exceeded the July high of 2.60 on Monday and it closed above it for the day.
Following the breakout natural gas consolidated for some days before pulling back to test support at the 200-Day MA with last Thursday’s low of 2.22. Notice that the purple 20-Day MA has been rising and it now marks an area near that swing low as trend support. Also, the 20-Day line has also begun to converge with the internal uptrend line. Currently, the 20-Day line is at 2.31, close to the 2.30 breakout level. In addition, the orange 50-Day MA began to turn up this week. These are signs of strength particularly given the bullish reaction once support at the 200-Day line was tested.
Today’s high is 2.56 and a decline below it may lead to a pullback to test lower potential support levels. The 38.2% Fibonacci retracement is at 2.50. It is followed by the 50% retracement at 2.45 along with the prior trend high of 2.44. A little lower is the 61.8% Fibonacci retracement at 2.39. The degree of pullback prior to a bullish reversal may provide insight into the potential for natural gas to eventually continue its ascent. Higher targets include the measuring objective from the double bottom pattern at 2.72.
Natural gas has been rising from the second bottom established at 1.875 in late-August. That bottom generated a higher swing low and a new uptrend line with a higher slope than the lower trendline on the chart. The trendline along with the top downtrend line show natural gas progressing inside a developing symmetrical triangle pattern. Therefore, there is the potential for an eventual test of resistance near the top downtrend line. The 78.6% retracement is also nearby at 2.89.
For a look at all of today’s economic events, check out our economic calendar.
The USD/JPY edges up during the North American session, registering gains of over 0.90% as the US Dollar stages a comeback. The rise in the US 10-year T-note yield sponsored a leg-up in the pair, which trades at 144.54 at the time of writing.
Despite rallying during the session, the USD/JPY remains downward biased, as the exchange rate persists below the Ichimoku Cloud (Kumo) and the 200-day moving average (DMA).
The Relative Strength Index (RSI) has just pierced its neutral line, opening the door for further upside in the near term.
With that said, the USD/JPY next resistance would be the 145.00 psychological figure ahead of testing the 50-DMA at 146.73. On further strength, the pair could hit the 147.00 figure.
Conversely, if USD/JPY tumbles below 144.00, this could pave the way to challenge the Kijun-Sen at 143.39, followed by the Senkou Span A at 142.76 and the Tenkan Sen at 142.13.
The table below shows the percentage change of Japanese Yen (JPY) against listed major currencies today. Japanese Yen was the strongest against the New Zealand Dollar.
| USD | EUR | GBP | JPY | CAD | AUD | NZD | CHF | |
|---|---|---|---|---|---|---|---|---|
| USD | 0.22% | 0.51% | 0.82% | 0.26% | 0.75% | 0.91% | 0.68% | |
| EUR | -0.22% | 0.29% | 0.60% | 0.04% | 0.53% | 0.70% | 0.45% | |
| GBP | -0.51% | -0.29% | 0.27% | -0.25% | 0.24% | 0.37% | 0.18% | |
| JPY | -0.82% | -0.60% | -0.27% | -0.56% | -0.07% | 0.09% | -0.14% | |
| CAD | -0.26% | -0.04% | 0.25% | 0.56% | 0.49% | 0.66% | 0.43% | |
| AUD | -0.75% | -0.53% | -0.24% | 0.07% | -0.49% | 0.17% | -0.07% | |
| NZD | -0.91% | -0.70% | -0.37% | -0.09% | -0.66% | -0.17% | -0.24% | |
| CHF | -0.68% | -0.45% | -0.18% | 0.14% | -0.43% | 0.07% | 0.24% |
The heat map shows percentage changes of major currencies against each other. The base currency is picked from the left column, while the quote currency is picked from the top row. For example, if you pick the Japanese Yen from the left column and move along the horizontal line to the US Dollar, the percentage change displayed in the box will represent JPY (base)/USD (quote).
Silver price retraces after matching the September 24 daily peak of $32.26 and drops beneath the $32.00 figure, losing over 0.85%, weighed by higher US Treasury yields. Also, a recovery of the US Dollar and investors’ reluctance to push the grey metal prices higher kept XAG/USD at familiar levels.
The uptrend on Silver remains in place, but price action suggests that buyers are struggling to keep the spot price above the $32.00 mark. During the year, XAG/USD has cracked the $32.00 barrier eight times, but after that, the non-yielding metal, dove.
For a bullish continuation, the XAG/USD must decisively clear the $32.00 mark. After that, traders need to test the year-to-date (YTD) high at $32.51, followed by the $33.00 mark. On further strength, XAG/USD could aim towards the October 1, 2012, peak at $35.40.
Conversely, if XAG/USD falls below $32.00, the next support would be the September 20 daily high at $31.44 before testing $31.00.
Silver is a precious metal highly traded among investors. It has been historically used as a store of value and a medium of exchange. Although less popular than Gold, traders may turn to Silver to diversify their investment portfolio, for its intrinsic value or as a potential hedge during high-inflation periods. Investors can buy physical Silver, in coins or in bars, or trade it through vehicles such as Exchange Traded Funds, which track its price on international markets.
Silver prices can move due to a wide range of factors. Geopolitical instability or fears of a deep recession can make Silver price escalate due to its safe-haven status, although to a lesser extent than Gold’s. As a yieldless asset, Silver tends to rise with lower interest rates. Its moves also depend on how the US Dollar (USD) behaves as the asset is priced in dollars (XAG/USD). A strong Dollar tends to keep the price of Silver at bay, whereas a weaker Dollar is likely to propel prices up. Other factors such as investment demand, mining supply – Silver is much more abundant than Gold – and recycling rates can also affect prices.
Silver is widely used in industry, particularly in sectors such as electronics or solar energy, as it has one of the highest electric conductivity of all metals – more than Copper and Gold. A surge in demand can increase prices, while a decline tends to lower them. Dynamics in the US, Chinese and Indian economies can also contribute to price swings: for the US and particularly China, their big industrial sectors use Silver in various processes; in India, consumers’ demand for the precious metal for jewellery also plays a key role in setting prices.
Silver prices tend to follow Gold’s moves. When Gold prices rise, Silver typically follows suit, as their status as safe-haven assets is similar. The Gold/Silver ratio, which shows the number of ounces of Silver needed to equal the value of one ounce of Gold, may help to determine the relative valuation between both metals. Some investors may consider a high ratio as an indicator that Silver is undervalued, or Gold is overvalued. On the contrary, a low ratio might suggest that Gold is undervalued relative to Silver.
According to the results of the economic calendar, business activity in the eurozone contracted unexpectedly in September, indicating worsening problems in both the services and manufacturing sectors. According to the announcement, the region’s Purchasing Managers’ Index (PMI), compiled by S&P Global, fell to 48.9 from 51.0 in August, recording the first contraction since February.
The decline, driven by weak demand and economic challenges in major economies such as Germany and France, raises serious concerns about future growth prospects and heightens speculation about possible policy easing by the European Central Bank. The PMI’s fall below the critical 50 threshold highlights deteriorating economic conditions across the eurozone. The services PMI fell sharply from 52.9 in August to 50.5 in September, while the manufacturing PMI fell to 44.8 from 45.8. Germany, the region’s largest economy, was particularly hard hit, contracting by -0.1% in the second quarter and facing further declines in the third. Economists are warning that a technical recession, defined as two consecutive quarters of negative growth, is increasingly likely. Germany’s struggles reflect a broader trend, with France also slipping into recession after a temporary Olympic-led growth spurt earlier in the year. The broad-based weakness in the eurozone, coupled with easing inflation pressures, paints a picture of a fragile economic outlook for the months ahead.
In the services sector, which had previously shown relative resilience, the September PMI pointed to a significant slowdown, falling to 50.5, below all expectations. Firms are seeing a sharp decline in new orders, with the new business index falling to 47.2 – the fastest rate of contraction in eight months. Despite the easing in price pressures, analysts suggest that the European Central Bank may need to implement more aggressive interest rate cuts to stimulate demand. Furthermore, some expect that further deposit rate cuts could be introduced as soon as October to mitigate the economic slowdown.
Meanwhile, manufacturing in the eurozone continues to face severe challenges, as evidenced by the PMI’s fall to 44.8, its lowest level since early 2023. This marks the 26th consecutive month of readings below 50, indicating sustained contraction. The September output index fell to 44.5, with business optimism falling sharply as the future output index fell to an 11-month low of 52.0. Moreover, This continued weakness raises concerns about the potential lack of stability in demand and the ongoing impact of broader macroeconomic uncertainty on Europe’s factories.
Also, the latest data points to a slight easing in inflation in the eurozone, a major concern for businesses. The services output price index also fell to 52.0, its lowest level since April 2021. While inflationary pressures persist, this development offers some hope to policymakers, prompting several economists to suggest that the European Central Bank could consider cutting interest rates in October.
Overall, business sentiment across the eurozone remains bleak as September’s PMI data has sparked concerns that recent measures by the ECB may not be enough to avoid a prolonged recession. As central banks around the world adjust their monetary policies, Europe finds itself at a pivotal crossroads, where more stimulus is likely to be needed to stabilize growth and restore confidence in the economy.
In contrast, according to licensed trading platforms, the yield on 10-year US Treasury bonds has approached 3.8%, a new three-week high, after the People’s Bank of China’s measures to stimulate its economy boosted market sentiment. Meanwhile, S&P Global’s Purchasing Managers’ Indices continued to signal strong, albeit slower, growth in the US private sector. The expansion was led by the services sector, while contraction in the manufacturing sector deepened. Traders are closely watching comments from Federal Reserve officials to gauge the central bank’s intentions, as well as the upcoming personal consumption expenditure report for insights into consumer strength and inflationary pressures. The probability of another 50-basis point cut in the federal funds rate in November remains at around 47%.

Based on the daily chart attached, EUR/USD is neutral, and bulls will strengthen their control over the trend by settling above the 1.1200 resistance. Consequently, this could encourage bulls to move towards stronger bullish levels. As we mentioned before, the 1.1075 and 1.0885 support levels are the most important to end the EUR/USD bullish expectations. Technically, the currency pair may remain in a tight range until the announcement of the US inflation reading preferred by the Federal Reserve.
Ready to trade our daily EUR/USD Forex analysis? We’ve made a list of the best forex trading platforms for beginners worth trading with.
Spot Gold positive bias continued on Wednesday, as the bright metal traded as high as $2,670.43 a troy ounce. The XAU/USD pair retreated as the US Dollar gathered momentum within American trading hours, firmly up against most major rivals. Gold, however, remains resilient due to its safe-haven conditions, as Wall Street turned red, with the Dow Jones Industrial Average losing over 240 points at the time of writing.
The sentiment deteriorated rapidly by the end of the European session, helped by escalating geopolitical concerns. On the one hand, United States (US) President Joe Biden said that an all-out war is possible in the Middle East, but there is also the possibility of a settlement. Meanwhile, Russian President Vladimir Putin threatened once again with the use of nuclear weapons.
At the same time, the Organization for Economic Cooperation and Development (OECD) maintained the US growth forecast for 2024 at 3.6% but downwardly revised 2025 progress to 1.6% from 1.8% previously. Finally, higher US Treasury yields are helping the USD on its way up.
Data-wise, the macroeconomic calendar remained scarce. Speculative interest keeps waiting for the US Personal Consumption Expenditures (PCE) Price Index to be released on Friday. The Federal Reserve’s (Fed) favorite inflation gauge is expected to show that price pressures continued to recede in August.
The daily chart for the XAU/USD pair shows it struggles around its opening and that a corrective decline is not out of the picture. Technical indicators retreated modestly but hold within overbought readings without downward strength. At the same time, the pair keeps developing above bullish moving averages, with the 20 Simple Moving Average (SMA) maintaining its firm upward slope over $100 below the current level.
The 4-hour chart shows XAU/USD entered a consolidative phase, while the risk of a downward extension seems limited. The 20 SMA keeps heading north at around $2,638, while the 100 and 200 SMAs extended their advances far below the shorter one. The Momentum indicator turned lower, although it holds far above its midline, while the Relative Strength Index (RSI) indicator turned flat at around 66, also suggesting absent selling interest.
Support levels: 2,652.60 2,638.10 2,623.25
Resistance levels: 2,670.00 2,685.00 2,700.00
He told Kent Online: “I think the path of interest rates will be down, gradually.”
When asked if British households would see interest rates near zero again, Bailey said he “doesn’t expect” that “what caused interest rates to go up so much was, among other things, two very big shocks to the economy.” He adds, saying: “It all started with the financial crisis and then Covid was another big shock.” Commenting on this, forex analyst Brad Bechtel at investment bank Jefferies says Bailey is indicating “that he doesn’t see a return to very low interest rates in this cycle and that has also helped support the pound a bit.”
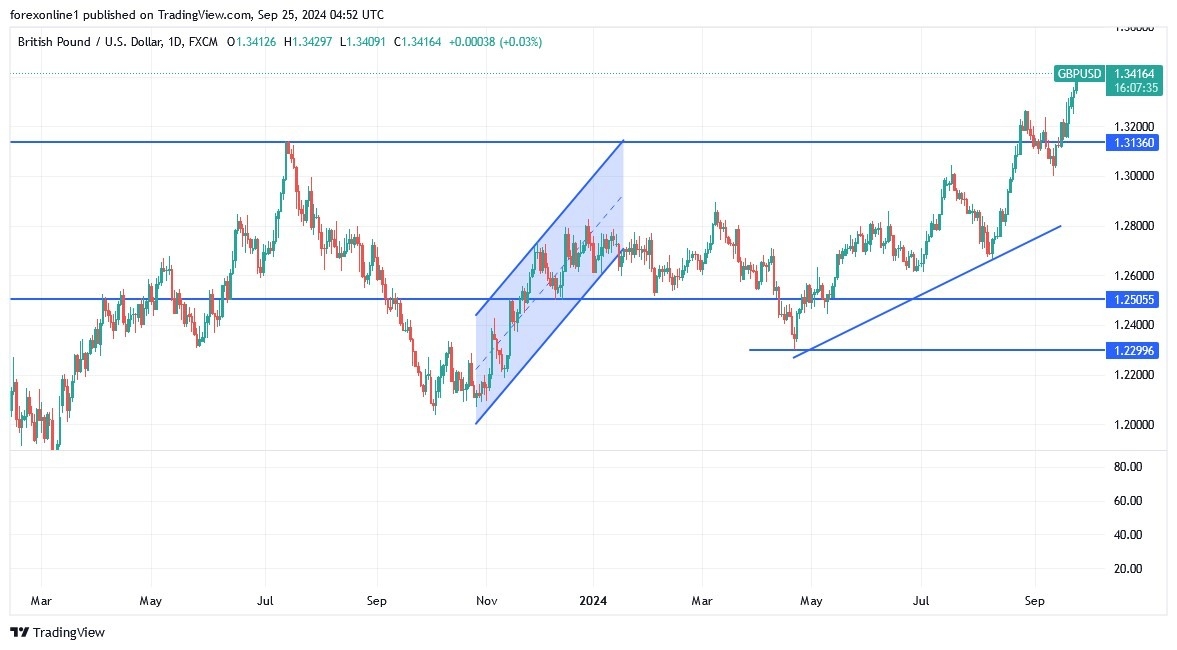
According to forex trading, the GBP/EUR exchange rate rose to its highest level in more than two years, exceeding 1.20 amid expectations that interest rates in the UK will be cut more slowly than those in the eurozone. Meanwhile, the GBP/USD exchange rate is testing levels near 1.34 as US interest rates start to decline, with the Federal Reserve delivering a massive 50 basis point cut last week.
For its part, the bank said last week that it believes inflation risks remain and that a gradual approach to easing is appropriate. As long as the UK is on a slow track when it comes to cutting interest rates, the pound can maintain its upward momentum. According to analysts: “So far, the pound has outperformed other currencies on the margins, and is likely to remain in a better position against currencies such as the euro, the Japanese yen, and sometimes the US dollar, for the foreseeable future.”
Previously, the US dollar had retreated to new lows against the pound sterling after the comments of Bostic and Kashkari. Recently, the US dollar has come under renewed pressure after two members of the Federal Open Market Committee (FOMC) indicated that the market was right to expect more interest rate cuts. Sterling gains accelerated to their highest level since March 2022, after FOMC member and Atlanta Fed President Raphael Bostic said, “Progress on inflation and cooling the Labor market has appeared much faster than I imagined at the beginning of the summer.” In a speech to the European Centre for Economic and Financial Research, he said: “At this moment, I imagine normalizing monetary policy sooner than I thought would be appropriate even a few months ago.”
Recently, the Federal Reserve cut US interest rates by 50 basis points last month and the forecasts from the FOMC members showed that further rate cuts were in the works. This boosted US stocks, weighed on US bond yields and put the dollar exchange rate under pressure. The next test for the US dollar is this week’s speeches and appearances by FOMC members, who will give their views on why the decision was made and what they think the future holds. For the forex markets, the path to further rate cuts is clear; this supports stocks and will weigh on the US dollar.
The GBP/USD bullish trend is strengthening, and the test of the 1.3400 resistance confirms this while technical indicators are moving towards strong overbought levels. Technically, the GBP/USD bullish momentum may remain until financial markets and investors react to the Fed’s preferred US inflation reading at the end of the week. Finally, we still prefer to sell GBP/USD from every upside level.
Ready to trade our GBP/USD daily forecast? We’ve shortlisted the best regulated forex brokers UK in the industry for you.
In general, this is a market that has plenty of things to push it higher, but I don’t necessarily think that it’s got a huge run ahead of it. When you look at longer term charts, you see that the $3 level has been crucial multiple times, and as we approach it, I would expect some type of pullback unless of course a hurricane or a tropical storm actually shuts down production in places like Louisiana.
Even if that were to happen, that would have a short-term effect. We would probably get some type of pullback that you could buy into heading into the winter, and then you collect your profit. Remember, I am long of natural gas via an ETF, and now we’re getting to the point where I may close out even more of my position and just take my profit and go home. As far as jumping in here and buying, I mean, it could work out, but it is a little late for that.
For a look at all of today’s economic events, check out our economic calendar.
Adds comments and closing prices
NEW YORK, Sept 24 (Reuters) –Arabica coffee futures on ICE rose to a 13-year high on Tuesday as worries over the crop in top producer Brazil persisted, compounded by fears there will not be enough rains in the country in the weeks ahead.
Raw sugar futures also gained, hitting a seven-month peak.
COFFEE
* December arabica coffee KCc1 settled up 4.15 cents, or 1.6%, at $2.678 per lb, having hit the highest since September 2011 at $2.7040.
* Dealers said rains this past weekend in Brazil’s coffee growing regions might be enough to stimulate the first crop flowering, but follow-up rains will be needed to help fix the flowers into cherries.
* “This is where things get tricky,” said one dealer, noting the 11-15 day forecast has trended drier.
* Capping gains in coffee prices though were reports that the EU Deforestation Regulation banning the import of commodities linked to deforestation could be delayed, dealers said.
* The regulation is due to come into effect at the end of December, and has been boosting coffee imports into the bloc for much of this year.
* November robusta coffee LRCc2 rose 0.7% at $5,312 a metric ton.
SUGAR
* October raw sugar SBc1 settled up 0.57 cent, or 2.5%, at 23.12 cents per lb, having hit a seven-month high of 23.30 cents.
* Dealers said the market continues to be supported by downgrades to projections for sugar output in top producer Brazil both this year and next due to the drought and related fires.
* A survey by S&P Global Commodity Insights expects sugar production in Brazil’s centre-south to have fallen 1.3% in the first half of September from last year. Industry group Unica is expected to release the data in coming days.
* December white sugar LSUc1 rose 1.9% at $595.40 a ton.
COCOA
* December New York cocoa CCc1 settled up $81, or 1%, to $7,867 a ton.
* March London cocoa LCCc2 fell 0.7% to 4,526 pounds per ton.
Reporting by Maytaal Angel and Marcelo Teixeira; Editing by Emelia Sithole-Matarise and Daniel Wallis
Yesterday, the US Consumer Confidence report surprised to the downside
with one of the largest drops since 2021. The labour market data in the report
softened a lot and it generally leads the unemployment rate.
The market responded by
raising the probabilities for the Fed to cut by 50 bps in November to roughly
60%. The question now is whether this is just about the low hiring rate or
something worse. We will have to wait for the NFP report next Friday.
On the EUR side, the market
started to price in a back-to-back cut in October from the ECB following the
latest Eurozone PMIs where the data deteriorated more than expected. Moreover,
ECB’s Muller opened the door for a rate cut in October saying that it cannot be
totally excluded.
EURUSD Daily
On the daily chart, we can
see that EURUSD rallied back to the 1.12 handle after a brief selloff following
the Eurozone PMIs. From a risk management perspective, the buyers would have a
much better risk to reward setup around the trendline, although a break of the high will
likely see the bullish momentum increasing. The sellers, on the other hand,
will likely step in around these levels to position for a drop into the
trendline.
EURUSD 4 hour
On the 4 hour chart, we can
see that we have another minor trendline defining the current bullish momentum.
If we were to get a pullback, the buyers will likely lean on the trendline to
position for a rally into the 1.13 handle. The sellers, on the other hand, will
want to see the price breaking lower to increase the bearish bets into the
major trendline.
EURUSD 1 hour
On the 1 hour chart, there’s
not much we can add as buyers will look for a breakout to the upside to
increase the bullish bets into new highs, while the sellers will look to step
in around these levels to target a pullback into the trendline.. The red lines
define the average daily range for today.
Tomorrow, we get the latest US Jobless Claims figures, while on Friday, we
conclude the week with the US PCE.