The main category of Forex News.
You can use the search box below to find what you need.
[wd_asp id=1]
The main category of Forex News.
You can use the search box below to find what you need.
[wd_asp id=1]
A spike in jobless claims could rekindle fears of a US hard landing. Weaker labor market conditions could affect wage growth and consumer spending, which contributes over 60% to the US GDP. Deteriorating labor market conditions could fuel speculation about an aggressive November Fed rate cut to bolster the economy. A more dovish Fed rate path may push the USD/JPY below 139.5.
Other stats include housing sector-related data and the Philly Fed Manufacturing Index. However, labor market data will likely have more impact on the USD/JPY pair.
USD/JPY trends will depend on the US labor market data and Friday’s BoJ interest rate decision. A spike in jobless claims and a hawkish Bank of Japan stance on interest rates may push the USD/JPY pair below 139.5. Currently, the BoJ and Fed monetary policy stances suggest a narrowing interest rate differential, signaling downward pressure for the USD/JPY.
Investors should remain alert, with the BoJ’s interest rate decision crucial for the USD/JPY pair. Monitor real-time data, central bank views, and expert commentary to adjust your trading strategies accordingly. Stay ahead of the market with our expert insights.
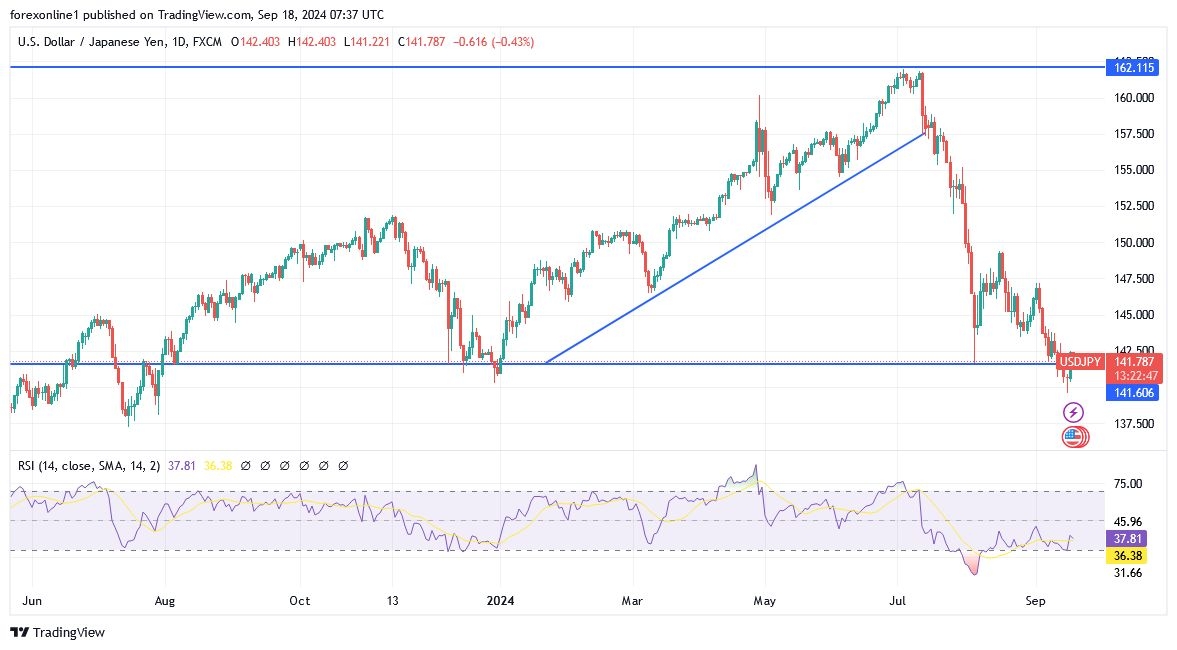
The USD/JPY remains well below the 50-day and 200-day EMAs, affirming bearish price signals.
A USD/JPY return to the 142.500 level could give the bulls a run at the 143.495 resistance level. Furthermore, a breakout from the 143.495 resistance level could signal a move toward the 145.891 resistance level.
Economic indicators from Japan, US labor market data, and central bank commentary require consideration.
Conversely, a drop below the 141.032 support level could give the bears a run at the September 16 low of 139.576. A return to 139.576 may signal a drop toward the 137.712 support level.
The 14-day RSI at 38.60 indicates a USD/JPY break below the 141.032 support level before entering oversold territory.
The 50-day EMA at $1.31424 supports the current bullish momentum, while the 200-day EMA at $1.30481 reinforces the longer-term uptrend.
As long as the pair stays above the $1.3156 pivot, the upward channel remains intact, suggesting more buying interest. A break below this level, however, could shift the bias towards selling.
The Euro (EUR) remains stable following the release of Final CPI, which held at 2.2% year-over-year, matching expectations. Core CPI also aligned at 2.8%.
Markets now shift focus to the upcoming speech from German Buba President Nagel, which could offer insights into future European Central Bank policy direction and impact the Euro’s outlook.
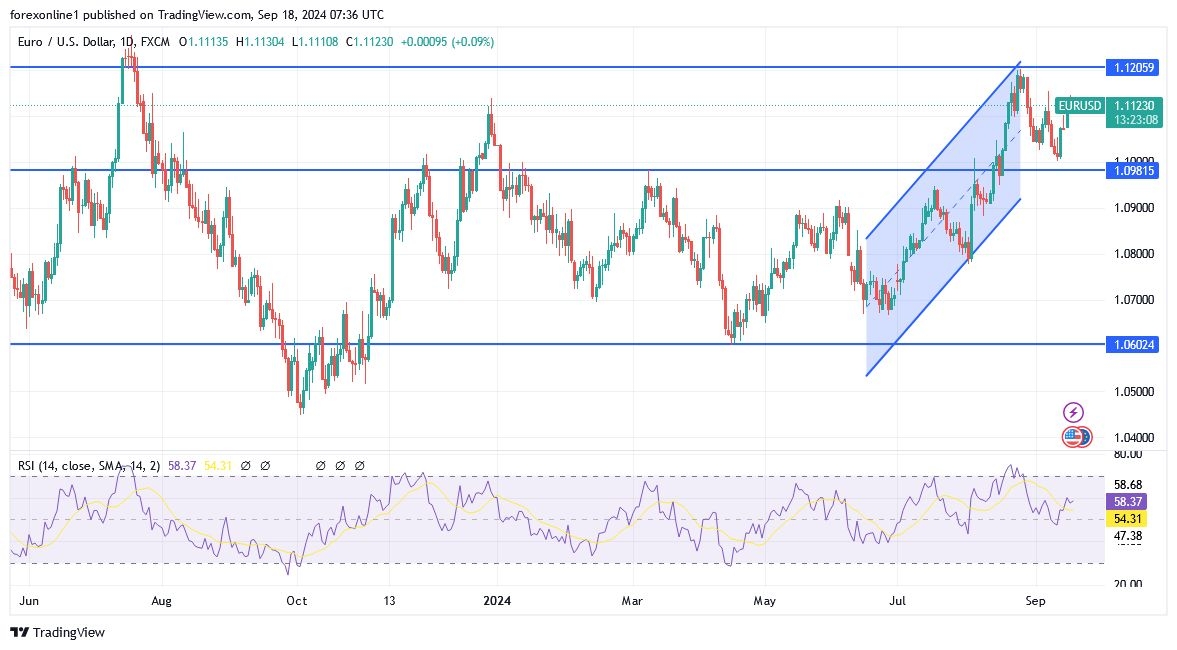
The EUR/USD pair is currently trading at $1.11188, up 0.08%, and hovering just above its pivot point at $1.11107, signaling potential bullish momentum. Immediate resistance is seen at $1.11453, with higher targets at $1.11753 and $1.12007.
On the downside, key support levels are at $1.10827, followed by $1.10525 and $1.10213.
Wall Street financial services company UBS has cut its oil price forecasts for the period 2024-2026, citing weaker global demand and a more stable supply outlook. The analysts have lowered the forecast for average Brent crude oil in 2024 by $4 to $80 per barrel, with the forecast for Q4 2024 lowered to $75 per barrel from $83.
UBS now sees Brent averaging $75 per barrel in both 2025 and 2026, a $5 per barrel reduction. The analysts have suggested that OPEC+ will be forced to postpone the unwinding of its voluntary production cuts, with any meaningful increases now seen coming in 2027 or 2028, compared to earlier expectations of a return by mid-2025.
The latest oil price rally continued on Monday’s session despite crude production in the Gulf of Mexico resuming following disruptions caused by Hurricane Francine. Brent crude for November delivery was up 1.3% at 11.50 am ET to trade at $72.56/barrel while WTI crude for October delivery was up 1.0% to change hands at $69.66/barrel.
Last week, commodity experts at Standard Chartered reported that oil markets are overlooking the imminent removal of even more barrels from the markets in the coming months. Back in July, Russia, Iraq and Kazakhstan submitted their compensation plans to the OPEC Secretariat for overproduced crude volumes for the first six months of 2024. According to OPEC, the entire over-produced volumes will be fully compensated for over the next 15 months through September 2025, with Russia ‘paying back’ a cumulative 480 kb/d, Iraq 1,184 kb/d and Kazakhstan 620 kb/d. According to StanChart, the compensatory output cuts by the three OPEC members work out to a combined 370 kb/d reduction in October, and then an amount varying between 162 kb/d and 206 kb/d for November 2024 through to September 2025. StanChart has worked out that adding the compensation schedule to the recently announced reduction in targets due to delaying the implementation of tapering will result in OPEC production clocking in at 530 kb/d lower in Q4-2024; 540 kb/d lower in Q1 and Q2-2025 and 560 kb/d lower in Q3-2025, if all commitments are kept.
By Alex Kimani for Oilprice.com
The Federal Reserve cuts interest rates for the first time in 4 years . Today, the US Federal Reserve is expected to cut the federal funds rate, which is currently at a 23-year high of 5.25% – 5.50%, at its meeting in September 2024. Decisively, this will be the first rate cut since March 2020. While the size of the cut remains uncertain, there is growing discussion of a possible cut of 50 basis points, although the Fed typically implements cuts of 25 basis points. The US headline annual inflation rate slowed for the fifth straight month to 2.5% in August, the lowest since February 2021, while the annual core inflation rate hit a more than three-year low of 3.2%. The annual core personal spending rate, the Fed’s preferred measure of core inflation, remained at 2.6% for the third straight month in July. In addition, the unemployment rate rose to 4.2% in August and monthly payroll growth has slowed this year.
The US quarterly economic outlook and interest rates are also on the Fed’s agenda. Concurrently, Traders have priced in more than a full percentage point of cuts this year.

In this regard, Société Generale Bank says that the euro price has the fuel needed to reach the 1.12 resistance. The euro exchange rate against the US dollar (EUR/USD) started the new week’s trading with fresh momentum as the market adjusts to the increasing possibility of a 50-basis point cut in US interest rates by the Federal Reserve on Wednesday.
This has led to a decline in US Treasury yields, narrowing the gap between US and European government bonds, leading to a rise in the EUR/USD pair. However, an analysis from société Generale says the gap has not yet closed and “sets the stage for further gains this week.” Kate Judd, head of FX foreign exchange analysis at Société Generale, says, “A return to the 1.12 resistance, a post-Jackson Hole high, is on the cards if the Fed cuts 50 basis points on Wednesday.”
However, a smaller cut of 25 basis points would be relatively disappointing compared to market expectations. Ultimately, the analyst believes that this could lead to profit-taking on the euro against the US dollar.
From a technical perspective, the setup for the EUR/USD currency pair is constructive. Based on the performance on the daily chart attached, the 1.12 resistance will remain the main hurdle going forward. The EUR/USD pair has broken a large symmetrical triangle and extended its upward move.
Overall, financial markets now see a 75% chance of a 50 basis point US interest rate cut by the Federal Reserve on Wednesday, while a week ago, this was only around 30%. The rise in the probability of a 50-basis point rate cut came following media reports suggesting that a 50-basis point rate cut is possible. However, since the report is uncertain, there is a real risk of disappointment. If the rate is cut by 25 basis points, the dollar could recover, and the EUR/USD pair would decline sharply.
Ready to trade our daily Forex forecast? Here’s a list of some of the top forex brokers in Europe to check out.
The Pound Sterling posted modest gains during the North American session, hitting a three-week high of 1.3254, but failed to gain traction as traders braced for the Federal Reserve’s monetary policy decision. Therefore, GBP/USD traders dragged the exchange rate toward 1.3205, still above its opening price by 0.30%.
The GBP/USD bias is bullish, though it has failed to break to new yearly highs due to a possible change of scenario. At the time of writing, the Relative Strength Index (RSI) favors buyers, while price action hints they-‘re booking profits ahead of the Fed.
If Powell and Co. decide to cut rates by 25 basis points (bps), further downsides will be seen in the GBP/USD. This will put into play the 1.3200 figure and the daily low of 1.3151. If those levels are taken out, the next support would be 1.3100 ahead of the latest cycle low at 1.3001, the September 11 low.
On the other hand, a 50-bps cut could cause the GBP/USD to climb past 1.3300, opening the door to testing the March 1, 2022 peak at 1.3437.
The table below shows the percentage change of British Pound (GBP) against listed major currencies today. British Pound was the strongest against the US Dollar.
| USD | EUR | GBP | JPY | CAD | AUD | NZD | CHF | |
|---|---|---|---|---|---|---|---|---|
| USD | -0.04% | -0.34% | -0.31% | -0.05% | -0.18% | -0.39% | -0.20% | |
| EUR | 0.04% | -0.32% | -0.28% | -0.01% | -0.14% | -0.36% | -0.16% | |
| GBP | 0.34% | 0.32% | 0.02% | 0.30% | 0.18% | -0.05% | 0.18% | |
| JPY | 0.31% | 0.28% | -0.02% | 0.28% | 0.15% | -0.05% | 0.16% | |
| CAD | 0.05% | 0.00% | -0.30% | -0.28% | -0.13% | -0.35% | -0.12% | |
| AUD | 0.18% | 0.14% | -0.18% | -0.15% | 0.13% | -0.20% | 0.03% | |
| NZD | 0.39% | 0.36% | 0.05% | 0.05% | 0.35% | 0.20% | 0.20% | |
| CHF | 0.20% | 0.16% | -0.18% | -0.16% | 0.12% | -0.03% | -0.20% |
The heat map shows percentage changes of major currencies against each other. The base currency is picked from the left column, while the quote currency is picked from the top row. For example, if you pick the British Pound from the left column and move along the horizontal line to the US Dollar, the percentage change displayed in the box will represent GBP (base)/USD (quote).
Gold hovers around $2,570 a troy ounce on Wednesday, unchanged on a daily basis as the Federal Reserve’s (Fed) monetary policy announcement looms. The United States (US) central bank is expected to trim interest rates for the first time in four years after pushing toward record highs amid soaring inflation in the pandemic aftermath. Policymakers are also weighing the effects of monetary restrictions on economic progress, but the market won’t hear that from them.
The Fed will also release the Summary of Economic Projections (SEP) with fresh forecasts for growth, inflation and unemployment and officials´ views on the future path for monetary policy. The latter could have a large impact on the US Dollar, as, ahead of the announcement, financial markets have already priced in a 25 basis points (bps) rate cut.
Generally speaking, the more dovish the event, the more will the US Dollar lose against its major rivals, while an unexpected hawkish outcome will likely have a larger impact amid the surprise factor, benefiting the American currency.
From a technical point of view, the daily chart for XAU/USD shows the risk skews to the upside. The pair holds near an all-time high of $2589.50 posted this week, while all moving averages aim higher, far below the current level. The closest one is the 20 Simple Moving Average (SMA), providing support in the $2,520 price zone. At the same time, technical indicators hold well above their midlines with uneven and limited directional strength.
In the near term, however, the risk leans to the downside. A directionless 20 SMA provides intraday resistance, rejecting advances. The 100 and 200 SMA have partially lost their upward strength, far below the current level. Finally, technical indicators aim lower, with the Momentum indicator accelerating lower below its 100 line.
Support levels: 2,561.65 2,550.00 2,542.40
Resistance levels: 2,574.80 2,590.00 2,605.00
Meanwhile, the Japanese Yen gains came as investors prepare for the latest monetary policy decisions from Japan and the United States this week. The Bank of Japan is expected to keep interest rates unchanged on Friday, but it is likely to indicate more rate hikes. Financial markets are betting that the Bank of Japan will raise interest rates again in December, while the move in October remains uncertain. Elsewhere, the US Federal Reserve is widely expected to deliver its first interest rate cut in four years on Wednesday, with financial markets pricing in a two-thirds chance of a large 50 basis point cut. Elsewhere, Japanese Finance Minister Shunichi Suzuki said on Tuesday that forex volatility has both advantages and disadvantages for the economy, stressing that rapid moves are undesirable.
Furthermore, Japan’s 10-year bond yield hits one-month low. The yield on the benchmark 10-year Japanese government bond fell to around 0.83%, hitting a one-month low and tracking a decline in US bond yields amid growing expectations that the Federal Reserve will cut US interest rates more aggressively this week. Financial markets are currently pricing in a 67% chance of a 50-basis point cut, up from just 25% a month ago, according to CME’s FedWatch tool.
On the other hand, the Bank of Japan is widely expected to keep its policy steady this week but is likely to signal further rate hikes. Markets are betting that the BoJ will raise interest rates again in December, while a move in October remains elusive. Fitch recently revised its interest rate forecasts for Japan, now expecting them to be 0.5% by the end of 2024, 0.75% in 2025 and 1% by the end of 2026.
Despite recent rebound attempts, the overall trend for the USD/JPY exchange rate remains bearish, and the psychological support level of 140.00 will remain a testament to the bears’ strong control of the trend. At the same time, technical indicators will move towards oversold levels. Technically, the reaction to the announcements of the world’s central banks this week will determine the fate of the dollar/yen. Moreover, it will decline further and break important support levels, with the nearest support at 138.00 for further strengthening of the bears’ control. Conversely, according to the daily chart, the psychological resistance of 150.00 will remain the most important for a real reversal of the overall trend to bullish.
Want to trade our daily forex analysis and predictions? Here’s a list of forex brokers in Japan to check out.
The EUR/USD pair hovers around 1.1120 ahead of Wall Street’s opening, little changed on a daily basis. The US Dollar is broadly weak ahead of the Federal Reserve (Fed) monetary policy announcement later in the day, but the Euro can’t take advantage of it. The Fed is expected to trim interest rates for the first time in four years, with markets anticipating a 25 basis points (bps) cut. However, a larger 50 bps trim is not out of the table.
Even further, the Fed will present a fresh Summary of Economic Projections (SEP) or dot-plot, which may add to the expected peak in volatility. The document could provide clues on what Fed officials plan to do in the upcoming months and whether they will adopt a more conservative or hawkish stance.
In the meantime, the Eurozone confirmed that the Harmonized Index of Consumer Prices (HICP) rose by 2.2% in the year to August. The monthly reading was downwardly revised to 0.1% from the flash estimate of 0.2%. Ahead of the Fed’s decision, the United States (US) published Building Permits and Housing Starts figures for August, up 4.9% and 9.6%, respectively.
From a technical point of view, the EUR/USD pair is bullish. In the daily chart, the pair is comfortable above a flat 20 Simple Moving Average (SMA) at around 1.1090, while the 100 SMA keeps grinding higher above the 200 SMA, both far below the shorter one. At the same time, the Momentum indicator crossed its midline into positive territory, maintaining a firm upward slope. Finally, the Relative Strength Index (RSI) indicator consolidates at around 58 without signs of upward exhaustion.
EUR/USD is losing its bullish poise in the near term. The 4-hour chart shows that technical indicators head lower, although still above their midlines. At the same time, the price is pressuring a mildly bullish 20 SMA, with a break below it favoring a slide. Still, the upcoming direction will depend on the Fed’s announcement and how financial markets understand the accompanying documents.
Support levels: 1.1090 1.1050 1.1010
Resistance levels: 1.1160 1.1200 1.1250
Silver (XAG/USD) drifts lower during the Asian session on Wednesday and moves away from a one-month peak, around the $31.10 region touched earlier this week. The white metal currently trades around mid-$30.00s, or the weekly low and down nearly 0.70% for the day, though the technical setup supports prospects for the emergence of some dip-buying.
The recent breakout through a short-term descending trend-line resistance, around the $29.40 area, which coincided with the 100-day Simple Moving Average (SMA) validates the near-term positive outlook. Moreover, oscillators on the daily chart are holding in positive territory and are still far from being in the overbought zone, suggesting that the path of least resistance for the XAG/USD is to the upside.
From current levels, any subsequent decline is likely to attract fresh buyers near the $30.00 psychological mark. This should help limit the downside near the $29.40 confluence resistance breakpoint, now turned support. The latter should act as a pivotal point, which if broken could drag the XAG/USD below the $29.00 round figure, towards the $28.45-$28.40 intermediate support en route to the $28.00 mark.
On the flip side, the $30.80 region now seems to act as an immediate hurdle ahead of the $31.00 mark, above which the white metal could prolong its appreciating move. The XAG/USD might then climb to the $31.45 region and retest the July swing high, around the $31.75 zone, before aiming to reclaim the $32.00 round-figure mark and challenge a one-decade high, around mid-$32.00s touched in May.
Silver is a precious metal highly traded among investors. It has been historically used as a store of value and a medium of exchange. Although less popular than Gold, traders may turn to Silver to diversify their investment portfolio, for its intrinsic value or as a potential hedge during high-inflation periods. Investors can buy physical Silver, in coins or in bars, or trade it through vehicles such as Exchange Traded Funds, which track its price on international markets.
Silver prices can move due to a wide range of factors. Geopolitical instability or fears of a deep recession can make Silver price escalate due to its safe-haven status, although to a lesser extent than Gold’s. As a yieldless asset, Silver tends to rise with lower interest rates. Its moves also depend on how the US Dollar (USD) behaves as the asset is priced in dollars (XAG/USD). A strong Dollar tends to keep the price of Silver at bay, whereas a weaker Dollar is likely to propel prices up. Other factors such as investment demand, mining supply – Silver is much more abundant than Gold – and recycling rates can also affect prices.
Silver is widely used in industry, particularly in sectors such as electronics or solar energy, as it has one of the highest electric conductivity of all metals – more than Copper and Gold. A surge in demand can increase prices, while a decline tends to lower them. Dynamics in the US, Chinese and Indian economies can also contribute to price swings: for the US and particularly China, their big industrial sectors use Silver in various processes; in India, consumers’ demand for the precious metal for jewellery also plays a key role in setting prices.
Silver prices tend to follow Gold’s moves. When Gold prices rise, Silver typically follows suit, as their status as safe-haven assets is similar. The Gold/Silver ratio, which shows the number of ounces of Silver needed to equal the value of one ounce of Gold, may help to determine the relative valuation between both metals. Some investors may consider a high ratio as an indicator that Silver is undervalued, or Gold is overvalued. On the contrary, a low ratio might suggest that Gold is undervalued relative to Silver.
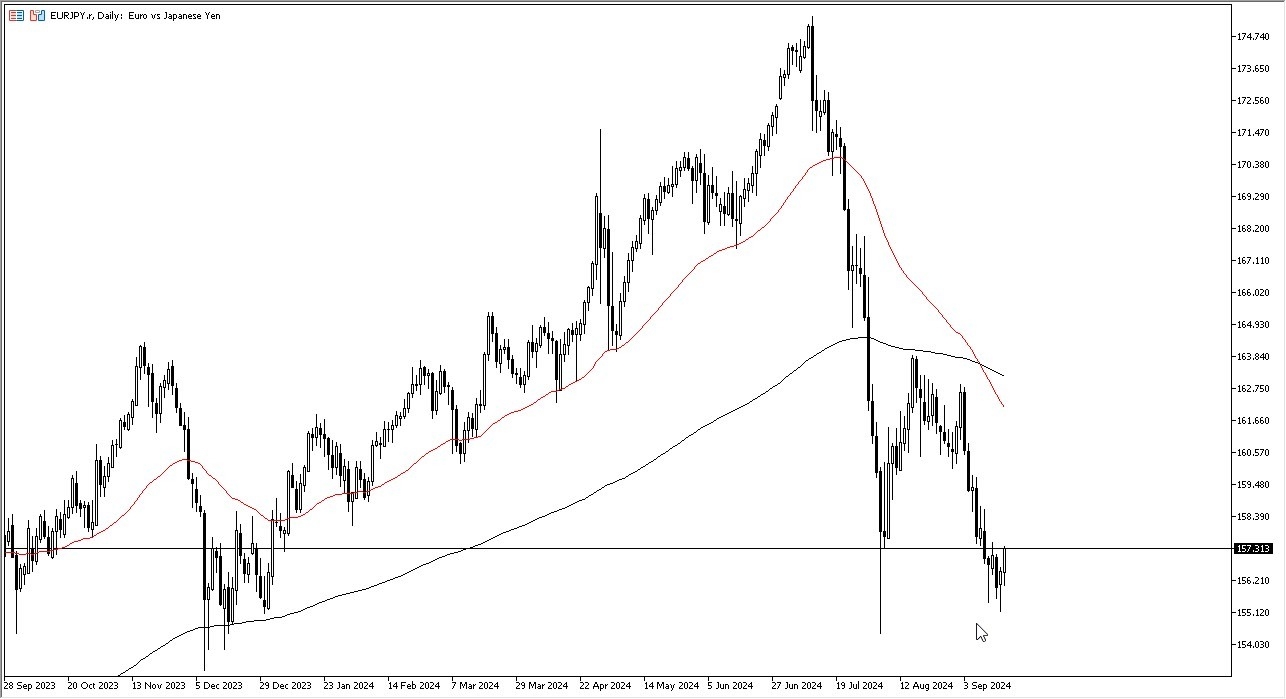
At this point, I suspect that the 155 yen level will end up being the floor in the market, unless of course something drastic happens that has a huge risk off trade going forward. Keep in mind though, Friday is the Bank of Japan interest rate decision and that of course will have its own influence on the market and could cause this pair to be very volatile. This is normal for yen-related pairs, but in the next few weeks, I suspect it will only get worse when it comes to the volatility.
All of that being said, you get paid at the end of every day to hang on to this pair. I think the carried trade may come back into vogue, especially in some of the other currencies like the New Zealand dollar, the Australian dollar against the yen. And I think the euro will just simply follow right along.
On the other hand, if we were to get a crash below the 155 yen level, we could see this pair just really fall apart we could drop another 500 pips rather quickly. In general, this is a market that I think continues to be noisy, very volatile, but we are in the midst of trying to form some type of bottoming power pattern in the yen related pairs on the whole. So, with that being said, I do think that the risk is to the upside, not the down in the current environment.
Ready to trade our daily Forex analysis? We’ve made a list of the best forex demo accounts worth trading with.