The main category of Forex News.
You can use the search box below to find what you need.
[wd_asp id=1]
The main category of Forex News.
You can use the search box below to find what you need.
[wd_asp id=1]
Interest rates have been kept high to squeeze the economy and slow down price rises – reducing inflation.
In a long-awaited move, the Bank of England cut the base rate from 5.25% to 5.0% last month- and is meeting again tomorrow.
This morning’s inflation data, however, has furthered dampened hopes of another cut tomorrow, analysts say.
The markets now put the chance of a 0.25 percentage point cut at 26% – it was 37% before the release of inflation data an hour ago.
Capital Economics analysts say the next cut is expected to take place in November.
“The good news on inflation in recent months did not last for long. As we had expected, food and fuel price inflation exerted some downward pressure on CPI inflation,” Ruth Gregory, deputy chief UK economist, says.
“But this was offset by the upward effects from rising furniture/household equipment inflation, recreation/culture inflation and a surprisingly large rise in airfares inflation from -10.1% in July to +11.9% in August.
“As a result, core inflation crept back up from 3.3% to 3.6%. And after falling in July to its lowest rate in two years of 5.2%, services inflation rebounded to 5.6% in August.”
Two other measures were below predictions: CPI was below the 2.4% first predicted in August and services inflation was 5.6%, below the Bank’s prediction of 5.8% (some of which was due to the rise in airfares, which are volatile in August anyway).
“But there’s no denying that services inflation is still too high for the Bank of England’s liking. And CPI inflation will almost certainly rise in the coming months, perhaps to 2.9% in November due to higher utility prices before it falls back towards 2.0% in mid-2025. So the Bank may start to worry about the trajectory of CPI inflation and services inflation,” Ms Gregory says.
“Overall, a pause on interest rate cuts was already expected tomorrow and today’s release cements that view.”
STORY LINK Euro to Pound Exchange Rate Forecast: EUR/GBP Firm Ahead of Latest UK Inflation Test
The Pound to Euro (GBP/EUR) exchange rate secured a net gain to 1.1870 on Tuesday and close to 10-day highs.
Weak German data hampered the Euro while expectations of no change in Bank of England interest rates this week supported the Pound.
Equities have also made headway over the past 24 hours with markets optimistic over the potential for a 50 basis-point interest rate hike.
The FTSE 100 index hit 2-week highs and overall risk conditions helped support Sterling.
At this stage, there are very strong expectations that the Bank of England will hold interest rates at 5.00%, but the latest UK inflation data will be released on Wednesday and could have an important impact on market expectations.
Consensus forecasts are for the headline rate to remain at 2.2% for August while the core rate is expected to increase to 3.5% from 3.3%.
The BoE is likely to watch the core data very closely with a particular focus on the services sector.

A stronger than expected release would make it even less likely that the BoE would be willing to sanction a rate cut this week.
There will, however, be additional pressure for action if there is a weaker than expected reading for core inflation.
Andrew Goodwin, chief UK economist for Oxford Economics, commented; “most members of the MPC are likely to be content to sit back and reassess the situation in November, a meeting at which the MPC will update its forecasts to incorporate the impact of the budget.”
He added; “We think that fiscal event will be the factor most likely to push the MPC off the gradual loosening path that it advocated in August.”
Danske Bank sees a potential Pound move lower on Thursday, but expects longer-term GBP/EUR gains; “we more generally still expect EUR/GBP to continue its recent move lower driven by UK economic outperformance, BoE lagging peers in an easing cycle for the time being and tight credit spreads. The key risk is policy action from the BoE.”
As far as the Euro-Zone is concerned, the German ZEW economic sentiment index declined sharply to 3.6 for September from 19.2 the previous month and well below consensus forecasts of 17.0.
The current conditions component also deteriorated to -84.5 from -77.3 and below expectations of -80.0. There was a slightly more modest decline in the Euro-Zone index.
According to ZEW President Professor Achim Wambach; “The hope for a swift improvement in the economic situation is visibly fading. Although the falling economic expectations for the eurozone point to an overall rise in pessimism, the drop in expectations for Germany is significantly greater.”
ING commented; “the euro’s strong momentum has gone through several concerning eurozone activity prints, and the ZEW should merely confirm the widely-priced notion that Germany’s outlook remains grim.”
International Money Transfer? Ask our resident FX expert a money transfer question or try John’s new, free, no-obligation personal service! ,where he helps every step of the way,
ensuring you get the best exchange rates on your currency requirements.
TAGS: Pound Euro Forecasts
Oil prices increased by approximately 2% on Monday, driven by ongoing disruptions to U.S. Gulf oil infrastructure, which offset persistent concerns about demand following new data from China. Investors are also anticipating a potential reduction in U.S. interest rates later this week.
By 1315 GMT, Brent crude futures for November rose by $1.40, or 1.96%, reaching $73.01 a barrel. Meanwhile, U.S. crude futures for October climbed by $1.60, or 2.33%, to $70.25 per barrel.
The market is expected to remain cautious until the Federal Reserve announces its interest rate decision on Wednesday, Phillip Nova analyst Priyanka Sachdeva, was quoted as saying by Reuters.
Sachdeva further noted that prices continue to be supported by supply concerns, as some production capacity remains offline in the Gulf of Mexico.
The market remains cautious ahead of the Federal Reserve’s interest rate decision scheduled for Wednesday.
Traders are increasingly leaning towards a 50 basis point rate cut by the Fed, rather than a 25 basis point reduction, as indicated by the CME FedWatch tool that monitors Fed fund futures.
Typically, lower interest rates decrease borrowing costs, which can stimulate economic activity and increase demand for oil.
A 50 basis point rate cut by the Federal Reserve could indicate underlying weakness in the U.S. economy, which may raise concerns about future oil demand, OANDA market analyst Kelvin Wong, was quoted as saying by Reuters.
China’s industrial output growth, the highest oil importer globally, slowed to a five-month low in August, with further declines in retail sales and new home prices.
Additionally, the country’s oil refinery output decreased for the fifth consecutive month due to weak fuel demand and reduced export margins.
Last week, both Brent and WTI crude prices rose by approximately 1%, yet they remain significantly below their average prices for August, which were $78.88 and $75.43 per barrel, respectively. This decline was influenced by concerns over demand that emerged at the beginning of the month.
(With inputs from Reuters)
The 50-day EMA at $1.31424 supports the current bullish momentum, while the 200-day EMA at $1.30481 reinforces the longer-term uptrend.
As long as the pair stays above the $1.3156 pivot, the upward channel remains intact, suggesting more buying interest. A break below this level, however, could shift the bias towards selling.
The Euro (EUR) remains stable following the release of Final CPI, which held at 2.2% year-over-year, matching expectations. Core CPI also aligned at 2.8%.
Markets now shift focus to the upcoming speech from German Buba President Nagel, which could offer insights into future European Central Bank policy direction and impact the Euro’s outlook.
The EUR/USD pair is currently trading at $1.11188, up 0.08%, and hovering just above its pivot point at $1.11107, signaling potential bullish momentum. Immediate resistance is seen at $1.11453, with higher targets at $1.11753 and $1.12007.
On the downside, key support levels are at $1.10827, followed by $1.10525 and $1.10213.
Gold price is finding some fresh demand near $2,570 early Wednesday, as buyers look to fight back control following the previous day’s correction from record highs of $2,590. Traders, however, could refrain from placing fresh directional bets on Gold price in the lead-up to all-important US Federal Reserve (Fed) monetary policy announcements.
On the Fed day, markets continue to price in a 65% probability of 50 basis points (bps) interest rate cut, the CME Group’s FedWatch Tool showed, reviving the selling interest around the US Dollar (USD), as the US Treasury bond yields also turn defensive amidst the market caution.
Thus. Gold price attempts to retake the all-time-high just shy of the $2,600 mark, with eyes on the Fed verdict, Chairman Jerome Powell’s press conference and the Dot Plot chart, all of which will help gauge the US central bank’s future policy action.
If the Fed delivers a 25 bps rate cut later this Wednesday, it could fuel a knee-jerk US Dollar upswing. However, the immediate reaction to the Fed announcements could be overshadowed by the implications of the Fed’s projections and Powell’s words. Gold price, therefore, remains subject to intense volatility during the Fed event.
An outrightly dovish outcome and rate projections by the world’s most powerful central bank could prompt Gold price to refresh record highs at the expense of the US Dollar. “A dovish Fed on a substantial easing path should generally lead to a weaker dollar,” said Nathan Swami, head of currency trading at Citi in Singapore.
In contrast, should the Fed acknowledge potential upside risks to inflation and maintain a cautious tone, it could bring the hawks back in the game, weighing negatively on the non-interest-bearing Gold price.
Gold price corrected briefly from record highs on Tuesday, courtesy of a profit-taking spree in the US Dollar ahead of the Fed event while strong US Retail Sales data also contributed to the resurgent USD demand. US Retail Sales rebounded by 0.1% MoM in August, data showed on Tuesday, against expectations for a 0.2% contraction. Data somewhat eased fears over a potential US ‘hard-landing’.
Gold buyers regain control, as the 14-day Relative Strength Index (RSI) remains comfortably above the 50 level, having eased off from near the overbought territory.
The optimism prevails so long as they defend the one-and-a-half-month-old symmetrical triangle target now support at $2,560.
That said, the immediate resistance is seen at the record high of $2,590, above which the $2,600 level will be tested.
Acceptance above that level will call for a test of the $2,650 psychological barrier.
If the Fed disappoints the doves, Gold price could witness a fresh sell-off, which could challenge the August 20 high of $2,532.
Additional declines will threaten the 21-day Simple Moving Average (SMA) at $2,522, below which the $2,500 mark will be on sellers’ radars.
The Federal Reserve (Fed) deliberates on monetary policy and makes a decision on interest rates at eight pre-scheduled meetings per year. It has two mandates: to keep inflation at 2%, and to maintain full employment. Its main tool for achieving this is by setting interest rates – both at which it lends to banks and banks lend to each other. If it decides to hike rates, the US Dollar (USD) tends to strengthen as it attracts more foreign capital inflows. If it cuts rates, it tends to weaken the USD as capital drains out to countries offering higher returns. If rates are left unchanged, attention turns to the tone of the Federal Open Market Committee (FOMC) statement, and whether it is hawkish (expectant of higher future interest rates), or dovish (expectant of lower future rates).
Next release: Wed Sep 18, 2024 18:00
Frequency: Irregular
Consensus: 5.25%
Previous: 5.5%
Source: Federal Reserve
Upbeat trade data and a surge in machinery orders could test the theory of the Fed being in the policy driving seat.
Beyond Japan’s data, the Fed interest rate decision, FOMC projections, and Powell’s press conference could prove crucial.
A 50-basis point Fed rate cut, downward revisions to growth, and a more dovish Fed rate path could send the USD/JPY below 140. Conversely, a 25-basis point rate hike and expectations of a soft landing could push the USD/JPY toward 145.
Other stats include housing sector-related data. However, these will play second fiddle to the Fed.
USD/JPY trends will likely hinge on the Fed interest rate decision and FOMC projections as the BoJ interest rate decision looms. The USD/JPY could face heightened volatility, with the Fed likely to address unanswered questions about the rate path and the economic outlook.
Investors should remain alert with the BoJ’s interest rate decision also pivotal for the USD/JPY pair. Monitor real-time data, central bank views, and expert commentary to adjust your trading strategies accordingly. Stay ahead of the market with our expert insights.
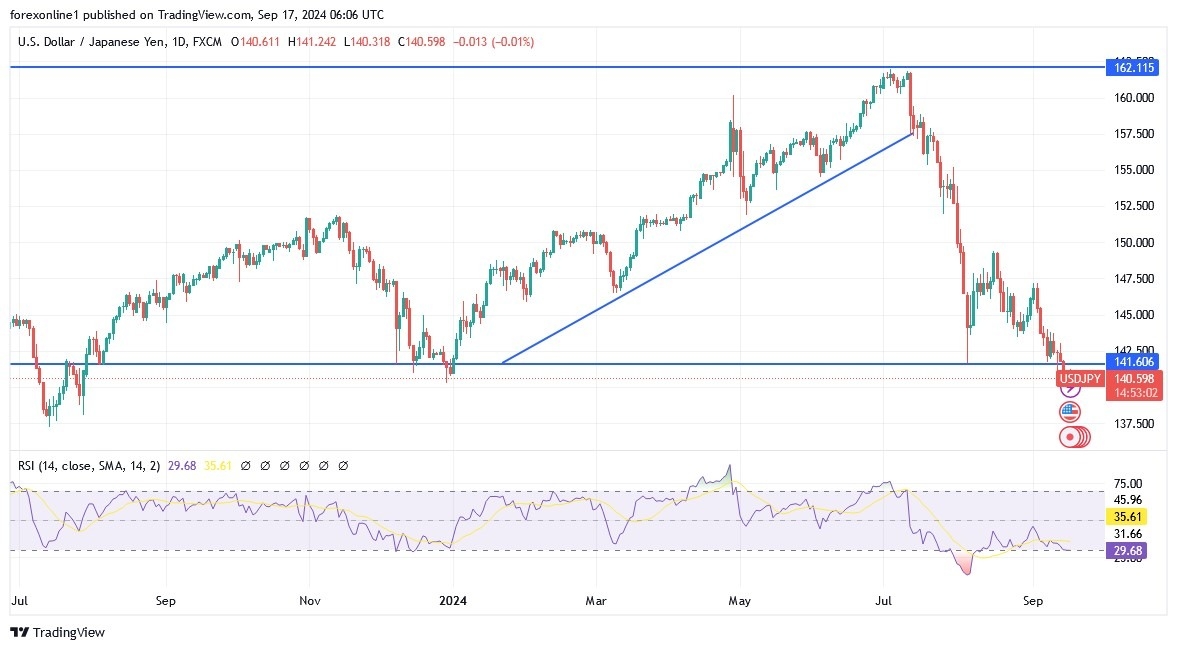
The USD/JPY hovers well below the 50-day and 200-day EMAs, confirming bearish price trends.
A USD/JPY breakout from the 142.500 level may bring the 143.495 resistance level into play. Furthermore, a break above the 143.495 resistance level could give the bulls a run at the 145.891 resistance level.
Economic indicators from Japan, the Fed interest rate decision, the FOMC projections, and the FOMC press conference require consideration.
Conversely, a break below the 141.032 support level could signal a drop to the September 16 low of 139.576. A fall through 139.576 could bring the 137.712 support level into play.
The 14-day RSI at 38.58 suggests a USD/JPY fall below the 141.032 support level before entering oversold territory.
Silver price consolidates for the second straight day, prints back-to-back doji’s a sign that neither buyers nor sellers control the grey’s metal price action. At the time of writing, XAG/USD trades at $30.69, virtually unchanged, as the Wednesday Asian session commences.
Silver has been subdued during the last few days as traders brace for the Fed’s decision.
Momentum remains bullish, as portrayed by the Relative Strength Index (RSI), but its slope turned flat, hitting indecision amongst investors.
If XAG/USD clears the current week’s high of $31.09, this could underpin Siver’s to challenge the July 11 high at $31.75 ahead of the year-to-date (YTD) high of $32.51. On the other hand, if Silver drops below the September 17 daily low of $30.52, it would expose the September 13 low of $29.86, followed by the 100-day moving average (DMA) at $29.36, followed by the 50-DMA at $28.98.
Silver is a precious metal highly traded among investors. It has been historically used as a store of value and a medium of exchange. Although less popular than Gold, traders may turn to Silver to diversify their investment portfolio, for its intrinsic value or as a potential hedge during high-inflation periods. Investors can buy physical Silver, in coins or in bars, or trade it through vehicles such as Exchange Traded Funds, which track its price on international markets.
Silver prices can move due to a wide range of factors. Geopolitical instability or fears of a deep recession can make Silver price escalate due to its safe-haven status, although to a lesser extent than Gold’s. As a yieldless asset, Silver tends to rise with lower interest rates. Its moves also depend on how the US Dollar (USD) behaves as the asset is priced in dollars (XAG/USD). A strong Dollar tends to keep the price of Silver at bay, whereas a weaker Dollar is likely to propel prices up. Other factors such as investment demand, mining supply – Silver is much more abundant than Gold – and recycling rates can also affect prices.
Silver is widely used in industry, particularly in sectors such as electronics or solar energy, as it has one of the highest electric conductivity of all metals – more than Copper and Gold. A surge in demand can increase prices, while a decline tends to lower them. Dynamics in the US, Chinese and Indian economies can also contribute to price swings: for the US and particularly China, their big industrial sectors use Silver in various processes; in India, consumers’ demand for the precious metal for jewellery also plays a key role in setting prices.
Silver prices tend to follow Gold’s moves. When Gold prices rise, Silver typically follows suit, as their status as safe-haven assets is similar. The Gold/Silver ratio, which shows the number of ounces of Silver needed to equal the value of one ounce of Gold, may help to determine the relative valuation between both metals. Some investors may consider a high ratio as an indicator that Silver is undervalued, or Gold is overvalued. On the contrary, a low ratio might suggest that Gold is undervalued relative to Silver.
The USD/JPY exchange rate fell sharply as investors anticipated the upcoming interest rate decision from the US Federal Reserve. Recent economic figures show that the economy has been slowing, meaning the Federal Reserve will need to step in to cut US interest rates. Also, economic data released earlier this month showed that the unemployment rate held steady above 4% in August as the economy created 113,000 jobs.
Moreover, there are signs that the number of US non-farm payrolls has been weaker than reported. Also, the Bureau of Labor Statistics has revised down the number of jobs added to the economy in recent months. In a recent report, the bureau revised down the number of jobs created in the 12 months through March by more than 818,000. At the same time, there are signs that inflation in the US is slowing and could fall to the Fed’s target of 2.0%. Data released last week showed that the core consumer price index fell from 2.9% in July to 2.5% in August, its lowest level in months.
Meanwhile, there are signs that inflation in the country is slowing as energy prices fall. Brent crude, the global benchmark, fell to $71, while West Texas Intermediate (WTI) crude fell to $69. As a result, gasoline prices have been moving lower in the past few months.
Therefore, expectations are for the Fed to cut rates by either 0.25% or 0.50% at this meeting. In a note, Bloomberg analysts said: “We believe Fed Chairman Jerome Powell supports a 50-basis point cut. However, the lack of a clear signal from New York Fed President John Williams before the blackout period before the meeting makes us believe that Powell does not have the committee’s full support.”
The Fed’s cut will come a week after the European Central Bank cut interest rates for the second time this year to stave off a slowdown in the country.
Another major catalyst for the USD/JPY exchange rate will be the Bank of Japan’s upcoming interest rate decision on Friday. Clearly, the decision comes a month after the bank stirred up market turmoil by raising interest rates for the second time this year. Likewise, economists expect the central bank to take a wait-and-see approach at this meeting even as inflation remains stubbornly high.
The latest data showed that the core consumer price index remained at 2.8% in July, above the median estimate of 2.7%. furthermore, It has risen from a low of 2.2% earlier this year. Also, there are signs that the Japanese economy is slowing. The latest economic data showed that GDP expanded by 2.9% in the second quarter, below the expected 3.1%. One of the main concerns for Japan is that the auto industry is undergoing a major change, with China becoming a dominant player. China also dominates other industries in Southeast Asia, and Japan has been a big player.
The decisions of the Bank of Japan and the US Federal Reserve will be notable because of the carry trade that has been around for many years. Meanwhile, the carry trade is a situation where investors borrow money in countries with low interest rates and invest in countries with high interest rates. In the past, it was very profitable to borrow in Japan, where interest rates were negative, to invest in the United States. Now, with the Fed cutting rates and the Bank of Japan relatively hawkish, the gap has narrowed, making the carry trade unattractive.
Therefore, the major actions of the Fed and the Bank of Japan are unlikely to have a significant impact on the USD/JPY pair. Instead, the currency pair will react to the comments of Powell and Kazuo Oda of the Bank of Japan, who will indicate the next actions.

The daily chart shows that the USD/JPY exchange rate peaked above 160 earlier this year and then experienced a sharp reversal as the BoJ began raising rates. Recently, the pair formed a death cross pattern, where the 200-day and 50-day exponential moving averages crossed. The death cross is one of the most bearish patterns in the market. Additionally, the pair has fallen below the key support level of 141.67, the lowest level in August. Therefore, the pair is likely to continue lower as sellers target the key support level at 137.16, the lowest since July last year.
If a deeper pullback comes before new trend highs, natural gas should find support at or above its 200-Day MA, which is now at 2.24. A bullish breakout of the 200-Day line triggered last Wednesday, and it was confirmed the following day by a daily close above the line. Previously, natural gas had traded below the 200-Day MA since July 2. Since the price of natural gas moved away from the line following the breakout, it is the market’s way of confirming subsequent strength.
Therefore, the first real pullback to test support around the 200-Day line should be successful. If it is not, and natural gas falls below the 200-Day line, it will likely find support around the 20-Day and 50-Day MAs, from 2.18 to 2.16, respectively. However, that would be a deeper pullback that negates some of the strength indicated by the bullish breakout above the 200-Day line.
There are several higher targets yet to be tested. The first target zone is from 2.52 to 2.54. It is derived by the 50% retracement at 2.52, and an initial target for a rising ABCD pattern at 2.54. That price range is followed by a range from 2.65 to 2.72. The top of the range is significant is it marks an initial target derived from measuring the recent double bottom. A bull breakout of the double bottom triggered last Wednesday on a rally above 2.30. The 61.8% Fibonacci retracement is also contained within the price zone at 2.67.
Dynamics seen in the monthly chart confirm a bullish outlook. A bull breakout on the monthly time frame triggered at the same time the double bottom triggered as the prior swing high of 2.30 was also a monthly high. Since it covers a larger time frame it is given greater significance than the shorter weekly and daily charts. It just triggered last week and continues to point to higher prices for natural gas.
For a look at all of today’s economic events, check out our economic calendar.
Gold price is marginally lower on Tuesday, with XAU/USD trading in the $2,560 region in the American session. The US Dollar gathered modest strength ahead of Wall Street’s opening amid better-than-anticipated United States (US) data. Local indexes hold on to modest gains, reflecting the optimistic mood that undermines demand for the safe-haven metal.
Still, financial boards’ activity is limited ahead of major central banks’ announcements. The Federal Reserve (Fed) will kick-start the wave of announcements on Wednesday, followed by the Bank of England (BoE) on Thursday and the Bank of Japan (BoJ) on Friday. The Fed is widely anticipated to trim interest rates for the first time in years, a movement that has been priced in long ago. The BoE, on the other hand, will likely remain on hold while speculative interest sees the BoJ hiking rates.
In anticipation of the Fed, speculative interest has priced in a 25 basis points (bps) rate cut, although there are some hopes the central bank will go for a wider trim of 50 bps. The level of aggressiveness from US officials will determine what will happen with Greenback on Wednesday. The more dovish the decision, meaning a 50 bps trim and anticipation of more cuts coming, the more will suffer the USD. The US Dollar, on the other hand, can recover sharply should the central bank deliver a more hawkish stance.
The daily chart for the XAU/USD pair shows the slide seems corrective. The pair keeps developing above all its moving averages, with the 20 Simple Moving Average (SMA) partially losing its bullish strength but well above the longer ones, at around $2,520. Technical indicators, in the meantime, remain well above their midlines, although lacking clear directional strength. The Relative Strength Index (RSI) indicator eases from near overbought readings but not enough to anticipate a steeper decline.
In the near term, however, the risk skews to the downside. In the 4-hour chart, XAU/USD has broken below a bullish 20 SMA, while the 100 and 200 SMAs aim marginally higher, far below the current level. Finally, technical indicators aim south almost vertically, currently challenging their midlines and hinting at another leg south, particularly if Gold pierces the intraday low at $2,561.65.
Support levels: 2,561.65 2,550.00 2,542.40
Resistance levels: 2,574.80 2,590.00 2,605.00