The main category of Forex News.
You can use the search box below to find what you need.
[wd_asp id=1]
The main category of Forex News.
You can use the search box below to find what you need.
[wd_asp id=1]
Silver price (XAG/USD) rises to near $29.30 in Friday’s North American session, with investors focusing on the Federal Reserve (Fed) Chair Jerome Powell’s speech at the Jackson Hole (JH) Symposium. The white metal gains as bond yields decline on expectations that Jerome Powell will deliver a dovish guidance on interest rates.
10-year US Treasury yields fall to near 3.84%. Lower yields on interest-bearing assets bode poorly for non-yielding assets, such as Silver, given that they reduce the opportunity cost of holding an investment in them.
The US Dollar Index (DXY), which tracks the Greenback’s value against six major currencies, recovers its intraday losses and rebounds to near 101.50.
Market participants are optimistic about Powell’s dovish guidance but they want more clarity on the likely size of interest rate cuts in September. According to the CME FedWatch tool, 30-day Federal Funds Futures pricing data shows that the probability of 50 basis points (bps) interest-rate cut in September is 28.5%. While rest is favoring a 25-bps interest rate reduction.
Investors will also focus on Powell’s speech to know about whether chances of ‘soft landing’ are intact. Market experts started anticipating a potential United States (US) recession after the Nonfarm Payrolls (NFP) report for July indicated a sharp slowdown in the labor demand and an increase in the Unemployment Rate to 4.3%, the highest level seen since November 2021.
Silver price turns sideways after a decisive break above August 2 high of $29.20, which faltered the lower high lower low formation on a four-hour timeframe. The 200-period Exponential Moving Average (EMA) near $28.77 acts as cushion for Silver price bulls.
The 14-period Relative Strength Index (RSI) falls to near 60.00, suggesting that the bullish momentum has concluded for now. However, the bullish bias remains intact.
Silver is a precious metal highly traded among investors. It has been historically used as a store of value and a medium of exchange. Although less popular than Gold, traders may turn to Silver to diversify their investment portfolio, for its intrinsic value or as a potential hedge during high-inflation periods. Investors can buy physical Silver, in coins or in bars, or trade it through vehicles such as Exchange Traded Funds, which track its price on international markets.
Silver prices can move due to a wide range of factors. Geopolitical instability or fears of a deep recession can make Silver price escalate due to its safe-haven status, although to a lesser extent than Gold’s. As a yieldless asset, Silver tends to rise with lower interest rates. Its moves also depend on how the US Dollar (USD) behaves as the asset is priced in dollars (XAG/USD). A strong Dollar tends to keep the price of Silver at bay, whereas a weaker Dollar is likely to propel prices up. Other factors such as investment demand, mining supply – Silver is much more abundant than Gold – and recycling rates can also affect prices.
Silver is widely used in industry, particularly in sectors such as electronics or solar energy, as it has one of the highest electric conductivity of all metals – more than Copper and Gold. A surge in demand can increase prices, while a decline tends to lower them. Dynamics in the US, Chinese and Indian economies can also contribute to price swings: for the US and particularly China, their big industrial sectors use Silver in various processes; in India, consumers’ demand for the precious metal for jewellery also plays a key role in setting prices.
Silver prices tend to follow Gold’s moves. When Gold prices rise, Silver typically follows suit, as their status as safe-haven assets is similar. The Gold/Silver ratio, which shows the number of ounces of Silver needed to equal the value of one ounce of Gold, may help to determine the relative valuation between both metals. Some investors may consider a high ratio as an indicator that Silver is undervalued, or Gold is overvalued. On the contrary, a low ratio might suggest that Gold is undervalued relative to Silver.
The USD/JPY outlook is mildly bearish as the yen strengthens after hawkish comments from the Bank of Japan Governor Kazuo Ueda. Meanwhile, the US dollar was under pressure ahead of Powell’s speech at the Jackson Hole symposium.
-Are you interested in learning about the forex signals telegram group? Click here for details-
On Friday, BoJ’s Ueda had to explain before parliament why the central bank surprised markets with a rate hike at the last meeting. He reaffirmed his commitment to hike rates if inflation rises sustainably. Economists believe Japan’s central bank will hike rates one more time before the year ends. The last rate hike caused turmoil in global markets as investors unwound the popular carry trade.
Initially, investors borrowed the low yielding yen to buy high yielding US assets. However, when the Bank of Japan started tightening its monetary policy, investors panicked. However, Ueda’s tone showed policymakers were ready to keep increasing borrowing costs.
Meanwhile, in the US, Fed policymakers on Thursday supported the outlook for a rate cut next month. They dropped the previous cautious tone, indicating confidence that inflation will reach the 2% target. At the same time, markets are implying a 73.5% chance the central bank will cut rates by 25 bps.
The focus is now on the Jackson Hole symposium. Powell’s speech might contain clues about the size and pace of future moves. Investors will likely react more to clues about policy after September.
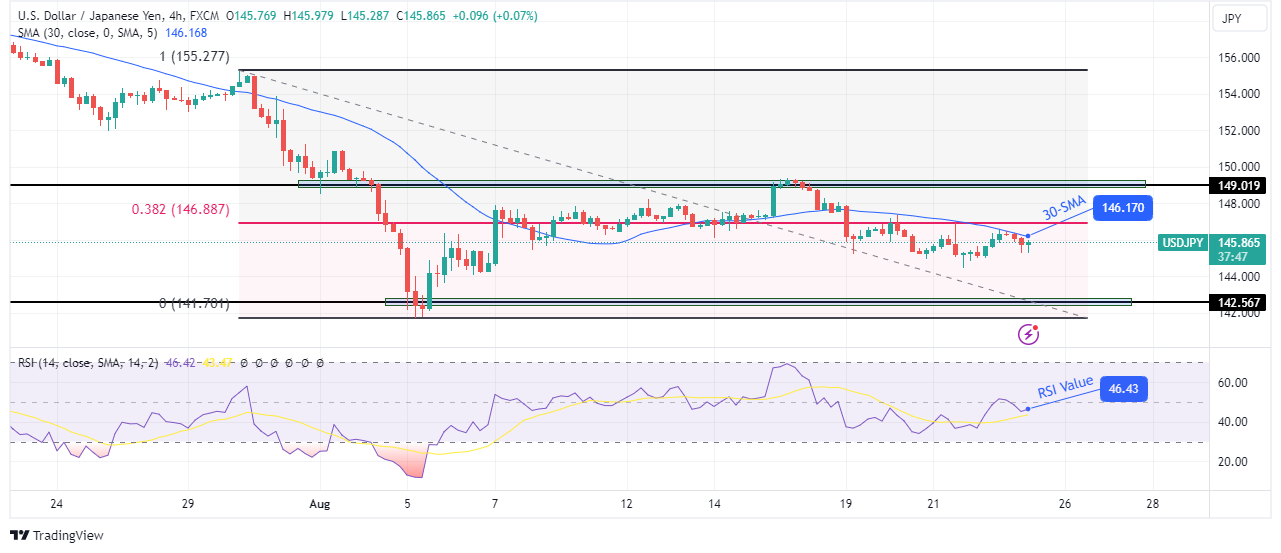
On the technical side, the USD/JPY price has risen to retest the 30-SMA resistance. However, the bias remains bearish since it has stayed below the SMA and the RSI is slightly under 50. Nevertheless, there is little enthusiasm to make large swings.
-If you are interested in forex day trading then have a read of our guide to getting started-
Neither bears nor bulls are ready to push the price too far away from the SMA. This is a sign of indecision. At the same time, the price has remained near the 0.382 Fib level. If bears regain momentum, USD/JPY will bounce lower to the 142.56 support level. Otherwise, it might break above the SMA to retest the 149.01 resistance.
Looking to trade forex now? Invest at eToro!
67% of retail investor accounts lose money when trading CFDs with this provider. You should consider whether you can afford to take the high risk of losing your money.
EUR/USD recovers mildly to near 1.1120 in Friday’s New York session after correcting from a fresh year-to-date high of 1.1174 on Thursday. The major currency pair edges higher as the US Dollar (USD) resumes its recent weakness after a decent recovery move a day earlier, amid caution ahead of Federal Reserve (Fed) Chair Jerome Powell’s speech at the Jackson Hole (JH) Symposium.
The US Dollar Index (DXY), which tracks the Greenback’s value against six major currencies, drops to near 101.30 after recovering from a more-than-seven-month low of 101.00 to nearly 101.60 on Thursday. The US Dollar bounced back strongly after the flash US S&P Global PMI report for August showed that the Composite PMI came in better than estimated at 54.1. Overall, the report showed that business activity was boosted by a robust expansion in the services sector, while the manufacturing part of the economy contracted at a faster-than-expected pace.
In his speech at the JH Symposium – scheduled at 14:00 GMT – Jerome Powell is expected to provide cues on interest rates and the United States (US) economic outlook. Market participants are keen to know the size of interest rate cuts in the September meeting, given that a “vast majority” of officials said that “if the data continued to come in about as expected, it would likely be appropriate to ease policy at the next meeting,” according to Federal Open Market Committee (FOMC) minutes of July 30-31 policy meeting.
Investors also consider the chances of the US economy to achieve a “soft landing”, knowing that price pressures are on track to return to the desired rate of 2%. Fears of a potential US recession escalated after the Nonfarm Payrolls (NFP) report for July indicated a sharp slowdown in the labor demand and an increase in the Unemployment Rate to 4.3%, the highest level seen since November 2021.
Analysts don’t expect Jerome Powell to provide a preset interest rate path. However, he may call rate cuts in September as appropriate, given that risks have now expanded to both aspects of dual mandate (inflation and employment).
The table below shows the percentage change of Euro (EUR) against listed major currencies today. Euro was the strongest against the Swiss Franc.
| EUR | USD | GBP | JPY | CAD | AUD | NZD | CHF | |
|---|---|---|---|---|---|---|---|---|
| EUR | 0.09% | -0.08% | -0.36% | -0.08% | -0.17% | -0.13% | 0.19% | |
| USD | -0.09% | -0.17% | -0.44% | -0.16% | -0.25% | -0.45% | 0.11% | |
| GBP | 0.08% | 0.17% | -0.27% | 0.02% | -0.09% | -0.03% | 0.03% | |
| JPY | 0.36% | 0.44% | 0.27% | 0.25% | 0.17% | 0.20% | 0.31% | |
| CAD | 0.08% | 0.16% | -0.02% | -0.25% | -0.09% | -0.04% | 0.04% | |
| AUD | 0.17% | 0.25% | 0.09% | -0.17% | 0.09% | 0.05% | 0.11% | |
| NZD | 0.13% | 0.45% | 0.03% | -0.20% | 0.04% | -0.05% | 0.06% | |
| CHF | -0.19% | -0.11% | -0.03% | -0.31% | -0.04% | -0.11% | -0.06% |
The heat map shows percentage changes of major currencies against each other. The base currency is picked from the left column, while the quote currency is picked from the top row. For example, if you pick the Euro from the left column and move along the horizontal line to the US Dollar, the percentage change displayed in the box will represent EUR (base)/USD (quote).
EUR/USD holds above the round-level support of 1.1100, with investors focusing on Fed Powell’s speech at the JH Symposium. The outlook of the shared currency pair has remained upbeat after a breakout of a channel formation on a daily time frame. All short-to-long-term Exponential Moving Averages (EMAs) are sloping higher, suggesting a strong uptrend.
The 14-day Relative Strength Index (RSI) oscillates in the bullish range of 60.00-80.00, touching overbought levels but still suggesting a strong upside momentum.
In case of a decisive break above the December 28, 2023, high at 1.1140, Euro bulls could aim to recapture round-level resistance of 1.1200. On the downside, the round-level figure of 1.1100 acts as a major support zone.
Monetary policy in the US is shaped by the Federal Reserve (Fed). The Fed has two mandates: to achieve price stability and foster full employment. Its primary tool to achieve these goals is by adjusting interest rates. When prices are rising too quickly and inflation is above the Fed’s 2% target, it raises interest rates, increasing borrowing costs throughout the economy. This results in a stronger US Dollar (USD) as it makes the US a more attractive place for international investors to park their money. When inflation falls below 2% or the Unemployment Rate is too high, the Fed may lower interest rates to encourage borrowing, which weighs on the Greenback.
The Federal Reserve (Fed) holds eight policy meetings a year, where the Federal Open Market Committee (FOMC) assesses economic conditions and makes monetary policy decisions. The FOMC is attended by twelve Fed officials – the seven members of the Board of Governors, the president of the Federal Reserve Bank of New York, and four of the remaining eleven regional Reserve Bank presidents, who serve one-year terms on a rotating basis.
In extreme situations, the Federal Reserve may resort to a policy named Quantitative Easing (QE). QE is the process by which the Fed substantially increases the flow of credit in a stuck financial system. It is a non-standard policy measure used during crises or when inflation is extremely low. It was the Fed’s weapon of choice during the Great Financial Crisis in 2008. It involves the Fed printing more Dollars and using them to buy high grade bonds from financial institutions. QE usually weakens the US Dollar.
Quantitative tightening (QT) is the reverse process of QE, whereby the Federal Reserve stops buying bonds from financial institutions and does not reinvest the principal from the bonds it holds maturing, to purchase new bonds. It is usually positive for the value of the US Dollar.
GBP/JPY retraces its recent gains from the previous two days, trading around 190.90 during the Asian session on Friday. The daily chart analysis indicates that the pair is attempting to break below the lower boundary of the ascending channel, suggesting a potential for a weakening bullish bias. Additionally, the 14-day Relative Strength Index (RSI) is positioned below the 50 level, indicating that bearish momentum is in play.
The MACD (Moving Average Convergence Divergence) line is above the signal line, suggesting that there is some upward momentum in the short term. However, the MACD line is still below the zero line, signaling the overall trend is still bearish. This could indicate a potential recovery or a temporary upward movement within a broader downtrend.
In terms of resistance, the 21-day Exponential Moving Average (EMA) at 191.63 level appears as the immediate barrier. A break above the 21-day EMA could reinforce the bullish sentiment and support the pair GBP/JPY cross to explore the region around the upper boundary of the ascending channel at the 195.50 level.
On the downside, a successful breach below the ascending channel may cause the emergence of the bearish bias and put downward pressure on the GBP/JPY cross to navigate the area around the seven-month low at 180.09 level, which was recorded on August 5. Further support appears at throwback support at 178.50 level.
The table below shows the percentage change of British Pound (GBP) against listed major currencies today. British Pound was the weakest against the Japanese Yen.
| USD | EUR | GBP | JPY | CAD | AUD | NZD | CHF | |
|---|---|---|---|---|---|---|---|---|
| USD | -0.15% | -0.25% | -0.64% | -0.19% | -0.34% | -0.57% | 0.07% | |
| EUR | 0.15% | -0.10% | -0.47% | -0.05% | -0.20% | -0.20% | 0.21% | |
| GBP | 0.25% | 0.10% | -0.40% | 0.04% | -0.10% | -0.08% | 0.07% | |
| JPY | 0.64% | 0.47% | 0.40% | 0.42% | 0.28% | 0.27% | 0.46% | |
| CAD | 0.19% | 0.05% | -0.04% | -0.42% | -0.15% | -0.13% | 0.03% | |
| AUD | 0.34% | 0.20% | 0.10% | -0.28% | 0.15% | 0.02% | 0.17% | |
| NZD | 0.57% | 0.20% | 0.08% | -0.27% | 0.13% | -0.02% | 0.15% | |
| CHF | -0.07% | -0.21% | -0.07% | -0.46% | -0.03% | -0.17% | -0.15% |
The heat map shows percentage changes of major currencies against each other. The base currency is picked from the left column, while the quote currency is picked from the top row. For example, if you pick the British Pound from the left column and move along the horizontal line to the US Dollar, the percentage change displayed in the box will represent GBP (base)/USD (quote).
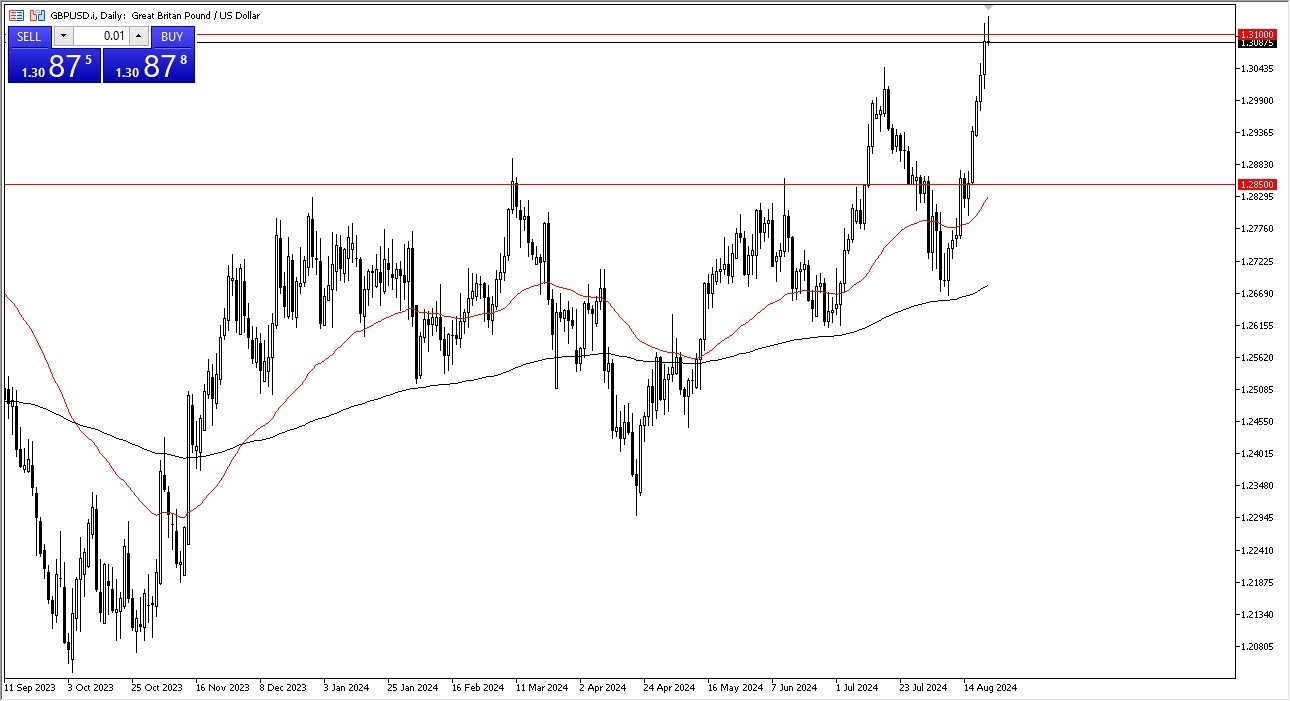
The question now is whether or not we will get a significant pullback. If we do, there are a couple of levels that I’ll be watching for potential support. The first one, of course, is the 1.30 level, as it is a large, round, psychologically significant figure, but after that we have the 1.2850 level that’s been important multiple times in the past. Furthermore, we have the 50-day EMA hanging around the 1.2850 level, so it all ties together quite nicely.

This could be the end of the US dollar selling. We’ll just have to wait and see. I think a lot of that comes down to what Jerome Powell says on Friday. He has a big speech, and if he sounds overly hawkish or maybe not so sure about being dovish, that’s going to cause chaos in the market yet again. That will almost certainly send the US dollar higher in value. And that, of course, would be felt over here. On the other hand, if he sounds somewhat dovish or we get some other risk on move.
A break above the 1.3150 level probably kicks off the next leg higher. Regardless, we are a little overdone, so I think a pullback is probably the most likely outcome here, as the market had gotten way too far ahead of itself as it seems to be prone to do these days. All things being equal, keep in mind, it’s a very volatile situation out there, so you do not want to have a huge position on whatever you choose to do.
Ready to trade our Forex daily analysis and predictions? Here are the best forex trading platforms UK to choose from.
Gold price is back in the green zone early Friday, adding on to Thursday’s late rebound. The Gold price rebound could be linked to the resumption of the US Dollar (USD) decline, in the face of fresh USD/JPY sell-off and negative US Treasury bnnd yields.
Markets stay risk averse in Asian trading so far this Friday, as they keenly await US Federal Reserve (Fed) Chair Jerome Powell’s Jackson Hole appearance for fresh hints on the central bank’s interest-rate path, especially with traders pricing in aggressive Fed rate cuts on signs of loosening labor market conditions.
Risk-off flows boost the haven demand for the US government bonds, weighing on the Treasury bond yields across the curve and thus, dragging the USD lower. The Greenback also bears the brunt of the renewed USD/JPY sell-off, following Bank of Japan (BoJ) Governor Kazuo Ueda’s hawkish remarks before the parliament on Friday.
Ueda reaffirmed his commitment to raise interest rates if inflation stayed on course to sustainably hit the 2.0% target but remained wary about unstable financial markets.
Despite the latest upswing, Gold price looks set to book the second straight weekly loss, as a Fed interest-rate cut for September is a done deal. However, Fed Chair Jerome Powell’s comments are critical to gauging the magnitude of easing expected in the coming months.
Gold price corrected roughly 1% on Thursday after the US Dollar rebounded firmly from over one-year lows against its major rivals, as risk sentiment deteriorated on unimpressive US S&P Global business PMIs and Jobless Claims data. Further, traders resorted to repositioning in the lead-up to Powell’s Jackson Hole showdown on Friday.
The short-term technical outlook for Gold price remains in favor of buyers so long as the triangle resistance-turned-support, now at $2,470, holds.
Note that Gold price yielded a symmetrical triangle breakout last week while the 14-day Relative Strength Index (RSI) points north above 50.
These technical indicators suggest that the bullish potential remains well in place for Gold price.
On the upside, should Gold buyers recapture the record high of $2,532, the next relevant topside target is seen at the $2,550 level.
Acceptance above the latter could challenge the $2,600 round level en-route to the triangle target, measured at $2,660.
If the Gold price correction resumes, the immediate support is seen at the abovementioned triangle resistance-turned-support at $2,470.
A breach of the latter will call for a test of the. Further south, the $2,450 psychological barrier will come to the rescue of Gold optimists.
Jerome H. Powell took office as a member of the Board of Governors of the Federal Reserve System on May 25, 2012, to fill an unexpired term. On November 2, 2017, President Donald Trump nominated Powell to serve as the next Chairman of the Federal Reserve. Powell assumed office as Chair on February 5, 2018.
Frequency: Irregular
Consensus: –
Previous: –
Source: Federal Reserve
The USD/JPY pair comes under some renewed selling pressure on Friday and reverses a part of the overnight modest gains, led by a goodish US Dollar (USD) recovery from the YTD low. Spot prices, however, manage to hold above the weekly low touched on Wednesday and remain confined in a multi-day-old range as traders opt to wait on the sidelines ahead of a crucial speech by Federal Reserve (Fed) Chair Jerome Powell later today. Powell’s remarks at the Jackson Hole Symposium will be scrutinized for cues about the US central bank’s rate-cut path, which will influence the US Dollar (USD) price dynamics and determine the next leg of a directional move for the currency pair. In the meantime, expectations for an imminent start of the Fed’s policy easing cycle continue to act as a headwind for the buck and seem to weigh on the currency pair.
According to the CME Group’s Fedwatch Tool, investors are convinced that the US central bank will lower borrowing costs by 25 basis points (bps) and are also pricing in the possibility of a larger-than-normal, 50 bps rate cut move. The bets were lifted by the annual benchmark review of employment data released on Wednesday, which showed that US employers added 818,000 fewer jobs than reported during the year through March. Furthermore, the minutes of the July 30-31 FOMC meeting revealed that an increasing number of policymakers backed the case for a rate cut next month amid progress in bringing down inflation. Adding to this, the US Department of Labor (DoL) reported on Thursday that Initial Jobless Claims rose to a seasonally adjusted 232K in the week ending August 17, up from the 228K previous, pointing to a cooling labor market.
Meanwhile, the S&P Global flash composite US PMI showed that the business activity in the US private sector continued to expand at a healthy pace and a fall in selling price inflation to a level close to the pre-pandemic average. Additional details of the report indicated that the gauge for the services sector unexpectedly ticked higher, though was largely offset by the fact that business activity in the US manufacturing sector shrank at the fastest pace this year. This, in turn, revived fears that the world’s largest economy is at risk of a slowdown and tempers investors’ appetite for riskier assets, driving some haven flows towards the Japanese Yen (JPY) and contributing to the USD/JPY pair’s downtick. The JPY is further underpinned by Bank of Japan Governor Kazuo Ueda’s hawkish remarks, signaling to raise rates if inflation stays on course to hit the 2% target.
Speaking during his first appearance in Japan’s parliament, Ueda said that the recent market volatility – led by concerns of a US recession – would not derail the BoJ’s long-term rate hike plan. This marks a big divergence in comparison to the Fed’s dovish outlook, which, in turn, suggests that the path of least resistance for the USD/JPY pair is to the downside.
From a technical perspective, any further weakness is likely to find some support near the 145.00 psychological mark ahead of the weekly low, around the 144.45 region touched on Wednesday. Some follow-through selling will reaffirm the negative outlook and prompt aggressive selling. Given that oscillators on the daily chart are holding deep in negative territory and still away from being in the oversold zone, the USD/JPY pair might then accelerate the fall towards the 144.00 round figure. The downward trajectory could eventually drag spot prices to the 143.40 intermediate support en route to the 143.00 mark.
On the flip side, any strength beyond the 146.00 round figure might continue to attract fresh sellers and remain capped near the 146.50-146.55 supply zone. A sustained strength beyond, however, could trigger a short-covering rally and lift the USD/JPY pair beyond the 147.00 mark, towards the next relevant hurdle near the 147.35-147.40 region. Some follow-through buying could negative the negative outlook and pave the way for a move towards reclaiming the 148.00 mark.
In Europe, markets are awaiting key economic data that could influence the European Central Bank’s decisions, with expectations of a 65-basis point interest rate cut by the ECB in 2024.
Meanwhile, the euro price may take its direction from the results of the region’s purchasing managers’ index surveys, as a slight recovery in manufacturing and services activity is expected in Germany and France. Stronger-than-expected results could dampen hopes of immediate ECB easing, which could lead to a rise in the value of the common European currency.
At its meeting on July 30, several Federal Reserve officials acknowledged that a case could be made for cutting US interest rates before the central bank’s policy committee voted unanimously to keep rates unchanged. The meeting minutes, released on Wednesday in Washington, stated: “Several noted that the recent progress on inflation and the increase in the unemployment rate provided a reasonable case for reducing the target range by 25 basis points at this meeting or that they might have supported such a decision. A large majority noted that if incoming data evolved as expected, it would likely be appropriate to ease policy at the next meeting.”
On the stock trading front, European stocks close higher. Concurrently, European stocks held onto early gains and closed higher on Wednesday, recovering from the previous session’s slide to extend the stock market’s recovery from a selloff earlier in the month as investors continued to assess the outlook for growth and future credit costs. Furthermore, the euro zone’s Stoxx 50 index added 0.6% to close at a one-month high of 4,885, while the Stoxx 600 advanced 0.3% to close at 514. Consumer cyclicals dominated gains, with Hermes, Ferrari and Adidas adding between 3% and 1.2%. Mercedes, BMW, Volkswagen and Stellantis also gained between 1.5% and 0.5%, setting the pace for automakers.
Meanwhile, chip stocks outperformed the sector on Wall Street, with ASML and Infineon up about 1.5%. also, European investors mostly shrugged off the aggressive downward revision to U.S. payrolls data for the year to March, as they awaited minutes from the latest Federal Reserve meeting due after the closing bell.
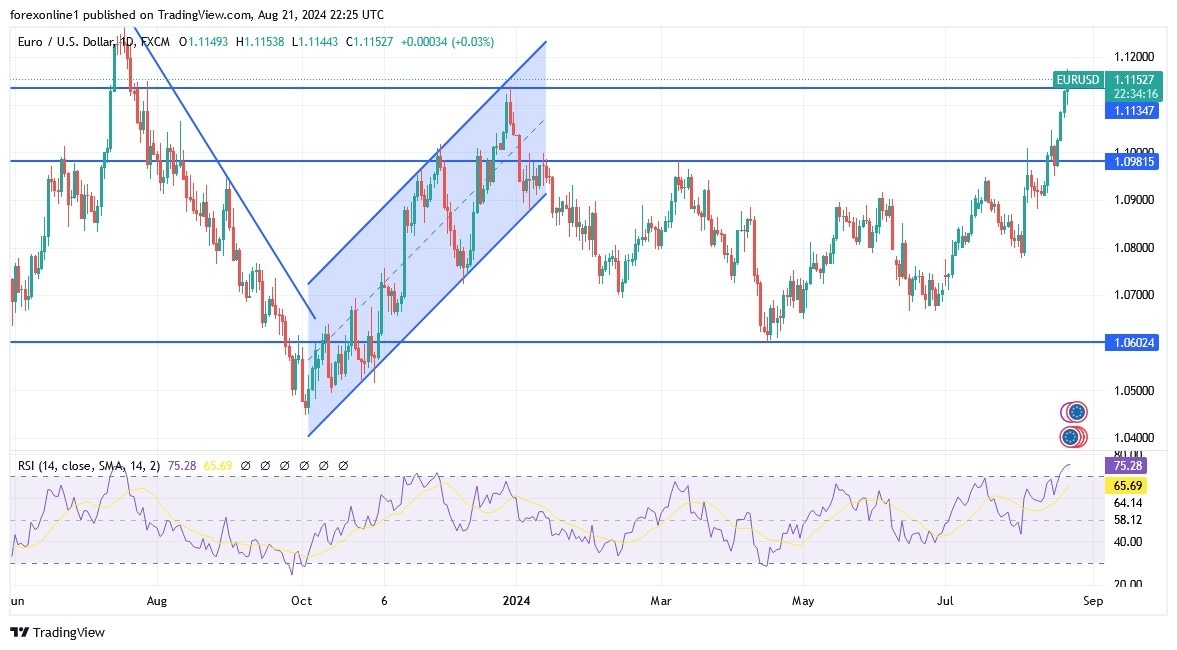
EUR/USD is trending higher, forming higher lows connected by a bullish trend line that has held since early August. Furthermore, there could be another test of this support area as the pair stops at the 1.1135 area. The Fibonacci retracement tool shows levels where buyers might wait to join the rally. Also, the 38.2% Fibonacci retracement level is at 1.1065, then the 50% Fibonacci retracement level is at 1.1043 near the dynamic turning point of the 100 simple moving average. Moreover, the larger correction could reach the 61.8% Fibonacci retracement level closer to the trend line at 1.1021.
If any of these levels are able to keep losses under control, EUR/USD could resume its climb to a higher high or higher. Also, the 100 SMA is above the 200 SMA to indicate that the path of least resistance is up or that the upside is more likely to gain momentum than reverse.
At the same time, the Stochastic indicator is already pointing to overbought levels and looks ready to turn lower, indicating an increase in selling pressure. The oscillator has room to slide before reaching the oversold zone, so the correction may continue until that happens. Similarly, the RSI is in the overbought zone and looks ready to head lower, so the EUR/USD pair may follow suit as bearish pressures increase.
Begin trading the EUR/USD market analysis! Open a Forex account with a top broker in Europe here.
XAU/USD faces some renewed selling pressure and adds to Wednesday’s losses, returning to the sub-$2,500 region per ounce troy.
The corrective decline in the precious metal was accompanied by quite a marked rebound in the Greenback, all after the US Dollar Index (DXY) broke below the key 101.00 support for the first time since December 2023 during the previous day.
Adding to the downward pressure on the yellow metal, US yields bounced across the spectrum as market participants digested the dovish tone from the FOMC Minutes released on Wednesday and started to warm up for the upcoming speech by the Federal Reserve’s (Fed) Chair Jerome Powell at the Jackson Hole Symposium on Friday.
Although the FOMC Minutes suggested that an interest rate cut could be imminent as early as next month, Powell’s upcoming speech might provide additional insights into his perspective on this possibility and, more crucially, reveal the potential magnitude of the cut. At present, CME Group’s FedWatch Tool indicates a nearly 75% chance of a 25 bps rate reduction at the September 18 gathering.
If there are indications of a larger cut, say 50 bps, it is anticipated to put significant pressure on the Greenback and enable Gold to test recent highs. Regardless, the US Dollar is likely to remain under close watch for the time being, which may limit any decline in bullion prices.
The daily chart shows XAU/USD navigating above all of its moving averages, with a bullish 55 Simple Moving Average (SMA) speeding north at about $2,390, as well as bullish lengthier ones. Meanwhile, technical indicators (RSI and Momentum) receded from recent tops, while the daily ADX indicates a stable trend for the time being.
In the short term, and according to the 4-hour chart, the corrective decline persists. XAU/USD is now facing the next support at the 100-SMA at $2,452 prior to $2,432, which appears underpinned by the more relevant 200-SMA at $2,428. A sustained breakdown of this region could open the door to a deeper retracement to $2,379, ahead of $2,364.
Support levels: 2,470.85 2,432.22 2,428.35
Resistance levels: 2,519.18 2,531.76 2,535.00
There was a bearish reversal triggered on the weekly chart earlier this week and it looks like that is now playing out. Moreover, natural gas remains below both its 50-Day MA and 200-Day MAs, in addition to falling back below its 20-Day MA today. If the 2.02 price area fails to hold as support, then a dip lower may be in the plans. It looks like the next lower price zone is from around 1.95 to 1.92. The lower level is the 78.6% Fibonacci retracement level and the 1.95 level is the target from a falling ABCD pattern extended by the 161.8% ratio.
Despite short-term weakness, natural gas remains on track to progress higher once the retracement is complete. It broke up and out of a falling bull wedge two weeks ago and then rallied to a high of 2.30, which was above a prior swing high at 2.27. That rally also recaptured the 20-Day MA. The bottom at 1.88 on August 5 completed a 40.2% decline from the prior swig high at 3.16. On a percentage basis, that drop exceeded all the prior corrections starting from the February 2023 bottom starting from the February 2023 bottom, except one. The decline from the January peak to the February low was 55.1%.
The current retracement is the first pullback since the bottom reversal since the bottom earlier this month. Once support is found followed by a bullish reversal on some time frame (daily or intraday) It has the potential to lead to a resumption of the developing bull trend. Given the significance of the prior decline a reversal up also has the potential to surprise to the upside.
For a look at all of today’s economic events, check out our economic calendar.